


Malnutrition by excess, and particularly obesity, has been considered a problem characteristic of high-income countries, but this situation is now more prevalent in low- and medium-income countries as well, including countries in Latin America( 1 , 2 ). In Chile, a steady rise in overweight has been reported for the different socio-economic groups( Reference Vio, Albala and Kain 3 , Reference Garmendia, Alonso and Kain 4 ), coinciding with improved socio-economic conditions as reflected by higher per capita gross domestic product and a reduction in poverty( 5 , 6 ).
In parallel with this, the population has experienced lifestyle changes, particularly in relation to dietary habits( Reference Vio 7 , 8 ). According to the literature, the increase in obesity among the lowest socio-economic strata of high-income countries is related to social inequity and is predominant among women( Reference Cohen, Rai and Rehkopf 9 – Reference McLaren 11 ). In less-developed countries the relationship between socio-economic level (SEL) and excess weight is less evident. In some places there is a direct relationship (improvement in SEL and increase in excess weight among adults, for example, in Vietnam, Jamaica and Cameroon) while in other places this relationship is less consistent (Brazil, Philippines)( Reference Monteiro, Moura and Conde 12 , Reference Dinsa, Goryakin and Fumagalli 13 ).
Particular mention has been made of the existence of a double burden of malnutrition in Latin America, where excess weight such as obesity among adults exists while children are stunted. However, there is a great deal of variation in these phenomena and in some countries excess weight is predominant while in others malnutrition is more prevalent( Reference Atalah, Amigo and Bustos 14 – Reference Freire, Silva-Jaramillo and Ramirez-Luzuriaga 16 ). According to Chile’s most recent National Health Survey, about two-thirds of the adult population has excess weight; this situation is particularly evident among the most vulnerable social groups( 17 ). In this country actually there is no double burden( Reference Atalah, Amigo and Bustos 14 ) and for this reason the focus of the present study is on excess of weight.
However, because no longitudinal studies have been conducted in this area, there are no precise data on the evolution of socio-economic conditions and nutritional status among adults. To address this gap in the literature, the present study sought to evaluate the relationship between changes in SEL and changes in the nutritional status of young adults born in Chile’s Valparaíso Region over a 10-year period.
Methodology
In the present concurrent cohort study, the participants are live births from 1974 to 1978 in the only hospital in Limache, a semi-rural community located about 110 km from the country’s capital, Santiago. The hospital serves the population in two communes or about 62 000 inhabitants. The main economic activities in the Limache area are agriculture and, more recently, agrotourism. The poverty rate for the area is equivalent to the median in Chile (19·1 %)( 18 ). The participants were evaluated for the first time between 2000 and 2002 and again between 2010 and 2012; recovery of information at birth was non-concurrent (retrospective).
The sampling frame consisted of 3092 live births in Limache Hospital between January 1974 and December 1978. A random sample of 1232 participants was obtained and evaluated between 2000 and 2002; if one of the persons randomly chosen could not be located, the previous or subsequent person on the list was selected as a replacement. Ten years later, 796 members of the original cohort were measured a second time (sample size details are available in Amigo et al.)( Reference Amigo, Bustos and Zumelzú 19 ). In both instances, the participants provided responses to questionnaires about socio-economic characteristics and behavioural habits (i.e. smoking), energy intake (through an FFQ) and physical activity (short form of the International Physical Activity Questionnaire). They also underwent a physical evaluation that included anthropometric measurements( Reference Amigo, Bustos and Zumelzú 19 – 21 ). In the second evaluation, the female participants were also asked to provide information about the number of children they had. Pregnant and nursing mothers (up to 6 months after delivery) were excluded from both phases of the study due to the impacts of pregnancy and nursing on nutritional status and the metabolic parameters evaluated.
The participants in the first evaluation were located at their places of residence in the Limache and Olmue communes. For the second evaluation, the participants were again located at their places of residence since most continued to live in the same district (due to a low migration rate).
The participants’ weight and height were measured using a Seca scale with an integrated measuring rod and a precision level of 0·1 kg for weight and 1 mm for height. These data were used to calculate the participants’ BMI. Waist circumference (WC) was measured at the midaxillary line halfway between the last rib and the iliac crest using a flexible measuring tape. The measurements were taken by trained nurses and/or nutritionists under constant supervision, in accordance with internationally validated techniques for controlling the quality of data collected( Reference de Onis, Onyango and Van den Broeck 22 ).
In both evaluations the SEL of the participants was based on the occupation and educational level of the person supporting the household, as recommended by the European Society for Opinion and Marketing Research and adapted to the Chilean situation( 23 ). The head of household’s education level was categorized as follows: incomplete primary; complete primary; incomplete secondary; complete secondary; incomplete university; and complete university. Occupation was categorized into three groups: informal or unskilled worker; qualified administrative employee; and executive to senior executive. The questions about these variables were identical in both phases of the study.
The two variables were combined in a matrix to classify the participants into the following socio-economic categories: high; medium high; medium; medium low; and low. To estimate the change in SEL over 10 years, the participants were classified into categories as follows: always low level; worsened (if the participant moved to a lower category); improved (if the participant moved to a higher category); and maintained level (maintained a SEL above low over the 10-year period).
Statistical analysis
A database was developed with a double-entry system using the EpiData program version 3.1. The sample characteristics were described by comparing means between the first and second evaluations (using the t test for paired samples) and changes in proportions (using the χ 2 test). We used ANOVA to compare differences by sex in the mean of BMI and WC. The effect of changes in SEL on nutritional status over the decade was determined using multiple linear regression analysis with the following control variables: urban or rural place of residence, sex, currently a smoker, physical activity and energy intake. We also assessed possible interaction between confounding variables and SEL. To address sample losses in the second measurement, we used inverse-probability-of-attrition weights( Reference Weuve, Tchetgen Tchetgen and Glymour 24 ), a weighting factor that considers the reciprocal of the probability of losses, taking account of the characteristics of the participants compared with non-participants. We used this technique because the losses were not random. The data analysis was performed with the statistical software package IBM SPSS Statistics version 22.
The study was approved by the Ethics Committee for Human Research of the Medical School of the University of Chile. In both phases, the participants signed an informed consent form after receiving an explanation of the study. Data management processes were designed to ensure anonymity.
Results
The mean age increase between the first and second evaluations was 11 years. Over the 10-year period, mean years of schooling increased slightly and the number of individuals in the low SEL group fell by 13 %, while the number classified in the medium high category rose. None of the study participants were classified in the high SEL. The data showed a 2·8 kg/m2 increase in BMI for all participants, while for WC the mean increase was 9·3 cm for women and 9·6 cm for men in the period studied (Table 1).
Table 1 Characteristics of the study population of young Chilean adults born in Limache Hospital, Valparaíso Region, between 1974 and 1978
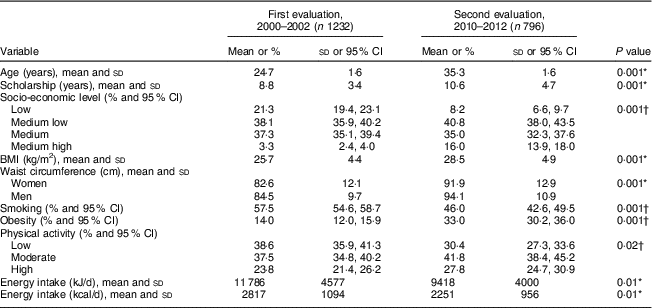
* P value from the paired t test.
† P value from the χ 2 test.
In the first evaluation, there were no differences in BMI between the sexes in the sample studied, nor was a BMI difference observed by SEL. However, a decade later we found that women in the two lowest SEL had higher BMI means than men, with a significant difference of 3·0 kg/m2 among individuals in the low SEL and 2·4 kg/m2 among those in the medium low SEL (P=0·02 and 0·0001, respectively). Regarding this measurement, BMI fell as SEL improved among women, but not among men (Table 2).
Table 2 Changes in socio-economic level and BMI in young Chilean adults born in Limache Hospital, Valparaíso Region, between 1974 and 1978
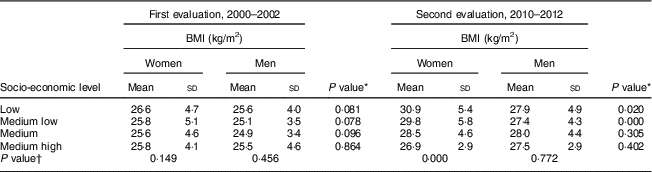
* P value from the paired t test.
† P value from ANOVA.
WC was within normal ranges (according to the National Cholesterol Education Program Adult Treatment Panel III criteria)( 25 ) in all SEL in the first evaluation, but increased significantly in both sexes and in all SEL in the second evaluation. The increase was greatest among women in the low and medium low SEL (13·3 and 11·8 cm, respectively). In the second evaluation, a significant gradient was also observed for having lower WC value as SEL improved among women. However, this trend was not observed in males (Table 3).
Table 3 Changes in socio-economic level and waist circumference (WC) in young Chilean adults born in Limache Hospital, Valparaíso Region, between 1974 and 1978
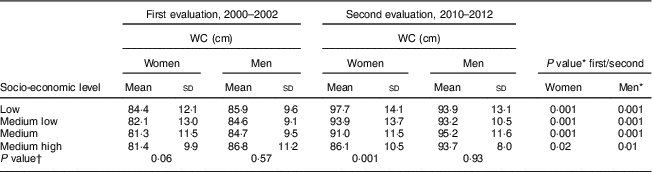
* P value from the paired t test.
† P value from ANOVA.
When change in SEL was related to change in nutritional status, an interaction between sex and SEL was detected. To control for this interaction, the sample was segmented by sex, verifying that in the adjusted and non-adjusted models, women who remained in the low SEL and those whose SEL worsened had a BMI that was 2·4 and 2·2 kg/m2 higher, respectively, than women who maintained their SEL (and were not in the low SEL). As for the men, we did not detect any correlation between variations in BMI and changes in SEL (Table 4).
Table 4 Changes in socio-economic level (SEL) and their relationship with changes in BMI over 10 years in young Chilean adults born in Limache Hospital, Valparaíso Region, between 1974 and 1978
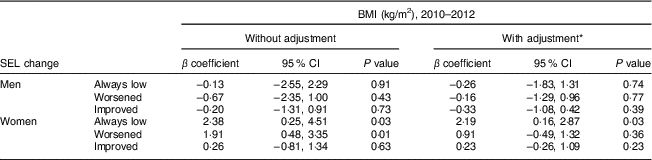
Linear regressions; reference group is participants who maintained the same SEL (and whose SEL is above low over the 10-year period).
* Adjusted by area of residence, smoking, energy intake, physical activity and BMI of the evaluation in 2000–2002.
In terms of the relationship between changes in SEL and WC, no relationship was observed in the men. Among women, those who remained in the low SEL showed a 6·7 cm increase in WC in the unadjusted model and a 4·1 cm increase in the adjusted model (Table 5).
Table 5 Changes in socio-economic level (SEL) and their relationship with changes in waist circumference (WC) over 10 years in young Chilean adults born in Limache Hospital, Valparaíso Region, between 1974 and 1978

Linear regressions; reference group is participants who maintained the same SEL (and whose SEL is above low over the 10-year period).
* Adjusted by area of residence, smoking, energy intake, physical activity and WC of the evaluation in 2000–2002.
Discussion
In the period studied – between the third and fourth decade of life in a cohort of young adults – the SEL of the study population improved overall. Increases in BMI and WC were observed in women, although the lowest socio-economic group experienced more significant changes than the others. Consistent with this result, we noted that women who remained in the low SEL increased their BMI and WC more than those who maintained their SEL over the 10-year period (and were not in the low SEL).
Chile’s socio-economic situation has evolved positively in recent decades, as evidenced by indicators such as lower poverty levels and growth in per capita gross domestic product( 5 ). These changes have also had an impact on the lifestyle and nutritional status of the population, although few studies in Chile have provided evidence of this relationship( Reference Kain, Orellana and Leyton 26 , Reference Adjemian, Bustos and Amigo 27 ).
The increase in BMI observed in this population is similar to that reported in several studies conducted in Chile among groups including pre-school and school-age children and adults( 28 , 29 ), suggesting that weight increase is affecting all population groups in the country. According to the National Health Survey conducted by the Ministry of Health, the percentage of adults affected by malnutrition by excess increased from 61 to 67 %( 17 , 30 ) between 2003 and 2009. However, there are scarce national data on changes in SEL and their effects on anthropometric measurements.
Growth in malnutrition by excess may be explained by greater access to high-energy food resulting from economic improvements among the most disadvantaged population groups. According to the National Survey on Food Consumption carried out 2010, the reported intakes of energy, fat, sugar and sodium were higher among those in the lowest socio-economic strata( 8 ). This situation may also be explained by other factors such as diminishing levels of physical activity and increasing urbanization( 31 ).
The results of our study are in line with those published for developed countries, in that the poorest population groups show the greatest prevalence of overweight( Reference Krishna, Razak and Lebel 32 , Reference White, Rehkopf and Mortensen 33 ). This phenomenon has grown over time and has also been observed in less-developed countries.
One hypothesis for the relationship between excess weight and SEL is that people of higher socio-economic status may choose healthier foods as a result of greater economic access to such foods and a better understanding of healthy eating habits( Reference Mayen, Marques-Vidal and Paccaud 34 , Reference de Mestral, Mayen and Petrovic 35 ).
One important finding of the current study is that for women, the increase in anthropometric measurements between the third and fourth decade of life was higher among the poor and those whose SEL worsened. For men, the increase was minor and not related to SEL. One explanation for these results could be that women engage in less physical activity (both in their work and in leisure time) than men( Reference Saquib, Saquib and Stefanick 36 – Reference Katulanda, Jayawardena and Ranasinghe 38 ); this is consistent with other studies carried out in the country( 31 ). Moreover, the women who participated in the current study are in a period of their lives in which weight increases due to maternity( Reference Araya, Padilla and Garmendia 39 ). As for the correlation with SEL, this may be explained by the greater prevalence of inadequate dietary habits among lower SEL, in addition to less active lifestyles( Reference Wells, Nermo and Östberg 40 , Reference Ricceri, Giraudo and Sieri 41 ).
The findings regarding WC were similar to those described for BMI, which was expected since these measurements are correlated. In women, increased WC is a cause for concern because it is associated with greater abdominal fat mass and related health risks. What is important to take into consideration is that if this condition is sustained over time, it becomes a risk factor for metabolic and cardiovascular diseases( Reference Alvero-Cruz, Fernández Vázquez and García Vega 42 ).
The screening programme used by Chile’s public health system to detect risk factors for CVD prioritizes older age groups than the one considered in the present study. However, there is increasing evidence that such screening should begin earlier. For example, a recent study on the prevalence of cardiovascular risk factors in the second age group reported herein (32–38 years old) showed that one-quarter of the individuals had elevated glycaemia and one-third had high TAG and blood pressure values( Reference Bustos, Amigo and Vasquez 43 ), according to the definition of metabolic syndrome. All these cardiovascular risk factors are related to an increase in WC. Therefore, specific strategies should be developed to promote early prevention of CVD in this age group.
The accumulation, throughout the life cycle, of risk factors for chronic diseases such as excess weight among women of low socio-economic status is an indication that programmes designed to reduce excess weight should be based on approaches that take account of both gender and socio-economic vulnerability.
Interestingly, despite the increase in BMI and WC, the energy intake reported by the participants was lower in the second evaluation. This may be due to under-reporting in the latter period (such under-reporting was also found in a national survey). Moreover, participants with excess weight may have experienced the weight increase well before the second interview, such that current energy intake does not necessarily reflect nutritional status.
One of the limitations of the present study is participant attrition between the two evaluations. Although a certain amount of attrition was expected, statistical techniques were used to minimize selection bias resulting from losses, using a weighting factor in the analysis of the results. Another limitation, and one which poses a significant challenge, is the difficulty of measuring the socio-economic situation of young people, many of whom still live with their parents while others are financially independent. In the current study the measurement of socio-economic status was based on a matrix combining the occupation and educational level of the head of household; this method is the one most frequently used at the international level and has been used in previous studies in Chile to measure socio-economic determinants of health conditions( 23 ).
One strength of the study is the large number of participants and the opportunity it presented to re-evaluate them, due to the low level of migration from the area, as well as the rigorous quality control measures implemented for data collection. Both these strengths reinforced the internal validity of the study.
Finally, it should be noted that the present study of the cohort of live births in Limache Hospital (Valparaíso Region) from 1974 to 1978 is one of the few concurrent cohort studies that has been conducted among young adults in Latin America. Tracking of this group provides evidence that the epidemiological and nutrition transition that Chile has undergone is probably similar to what has occurred in other countries in the region and contributes to understanding the evolution of one nutritional problem (excess of weight) in relationship to changes in socio-economic condition among adults. Continued monitoring of this situation is recommended to provide data that can be used to develop preventive interventions for this age group and also because the study found that socio-economic changes affect nutritional status. All of this raises questions about the future health of this population if steps are not taken to address risk factors of chronic disease among young adults.
Acknowledgements
Financial support: This research was funded by the National Research Fund of Chile (grant numbers 1010572, 1100414 and 1140453) and The Wellcome Trust (grant number 059448z7). The funders had no role in the design, analysis or writing of this article. Conflict of interest: None. Authorship: H.A. and P.B. originated the project, planned and collected the data of the study. H.A. and A.V. drafted the paper. All authors commented on each version of the paper and approved the final version. Ethics of human subject participation: This study was conducted according to the guidelines laid down in the Declaration of Helsinki and all procedures involving human subjects were approved by the Ethics Committee for Human Research of the Medical School of the University of Chile. In both phases, the participants signed an informed consent form after receiving an explanation of the study.


