


Unhealthy food environments are characterised by the disproportionate availability and promotion of obesogenic foods. They have been recognised as a major driver of the weight gain seen globally over the last three decades( Reference Swinburn, Sacks and Hall 1 ). Supermarkets are a key component of the food environment, being the primary source of food in many countries. As a major provider of fresh and nutritious foods, supermarkets are often considered to have a positive influence on population diets( Reference Giang, Karpyn and Laurison 2 ).
The simultaneous availability and promotion of unhealthy discretionary foods in supermarkets, however, means that their influence on eating behaviours is equivocal. A recent report using data from the US National Health and Nutrition Examination Survey, for instance, found that the majority of discretionary foods consumed were purchased in supermarkets( Reference An and Maurer 3 ). Studies of the within-store supermarket environment have demonstrated the excessive placement of discretionary foods at key strategic sites such as end-of-aisle and checkout displays( Reference Thornton, Cameron and McNaughton 4 ), while discretionary foods and alcohol similarly dominate the supermarket catalogues in most countries( Reference Charlton, Kahkonen and Sacks 5 ).
The fact that supermarkets are simultaneously a source of healthy and unhealthy foods means it is difficult to simply assess their contribution to the food environment. The US Healthy Food Financing Initiative took the position that new supermarkets in underserved areas should improve population diets and waistlines by providing greater access to healthier foods( Reference Giang, Karpyn and Laurison 2 ). Evidence to date that this type of expensive initiative has failed to result in meaningful change( Reference Dubowitz, Ghosh-Dastidar and Cohen 6 – Reference Rudkin 8 ) could suggest that a focus on the in-store environment may be as or more important than merely their presence in a community.
Given that most studies find a higher prevalence of obesity in rural/non-metropolitan( Reference Itoi, Yamada and Watanabe 9 – Reference Eberhardt and Pamuk 22 ) and urban-fringe areas( Reference Ewing, Meakins and Hamidi 23 – Reference Lopez 29 ) than in urban areas, investigations of the respective food environments in these areas should be a priority. The present study aimed to assess the shelf space and strategic placement of healthy and discretionary foods in supermarkets from urban, urban-fringe and rural/non-metropolitan areas in Australia.
Methods
In-store audits were conducted in supermarkets from a single major Australian supermarket chain in urban (n 19), urban-fringe (n 20) and non-metropolitan (n 26) areas of Victoria, Australia. Urban stores were located within the city of greater Melbourne, while urban-fringe stores were located on the periphery of this large city. A stylised map of the urban and urban-fringe areas of Melbourne from which stores were sampled is presented in Fig. 1. Melbourne is the capital of the State of Victoria and the second most populous city in Australia (population >4·7 million( 30 )). It has the largest urban footprint in Australia (total land area 2543 km2) and is among the top 3 % of large cities globally( Reference Cox 31 ). The sample selection of urban stores (audited September 2010 to February 2011) has been described in previous publications( Reference Thornton, Cameron and McNaughton 32 , Reference Cameron, Thornton and McNaughton 33 ); however, only the stores from one of the two chains used in those previous publications were included in the current study (so that stores were comparable in urban, urban-fringe and rural/non-metropolitan areas). Selection of urban stores was random and stratified by level of socio-economic disadvantage, with an equal number of stores from suburbs in the highest and lowest quintiles of disadvantage as assessed by the Australian Bureau of Statistics’ Index of Relative Socio-economic Disadvantage( 34 ). Lower scores on this index indicate a greater level of relative disadvantage. Selection of rural/non-metropolitan and urban-fringe stores was neither random nor based on level of disadvantage, but rather on the logistics of data collection in those areas. The urban fringe was able to be clearly defined based on a satellite image of metropolitan Melbourne, with all sampled stores being close to the Urban Growth Boundary defined previously by the Victorian Government( 35 ). Rural/non-metropolitan stores were located outside greater Melbourne, all being located in large population centres (population >6000). Outside Melbourne (population >4·7 million), only one Victorian city currently has a population >100 000 (Geelong, population ~185 000, which was excluded from the study on this basis). The twenty-six rural/non-metropolitan stores and twenty urban-fringe stores audited represent approximately two-thirds of all rural/non-metropolitan and urban-fringe stores, respectively, operated by the retailer in the State of Victoria (according to the areas indicated by Fig. 1). Therefore, the rural/non-metropolitan and urban-fringe samples are likely to be highly representative of all stores in those regions. The average distance to the Melbourne General Post Office (fastest driving distance according to Google Maps) was 17·1 (sd 9·8) km for urban stores, 39·7 (sd 10·4) km for urban fringe stores and 180·5 (sd 60·7) km for rural/non-metropolitan stores. Urban and urban-fringe areas (combined) in the present study are equivalent to Greater Capital City Statistical Areas in the Australian Bureau of Statistics’ Australian Statistics Geography Standard classification system( 36 ).
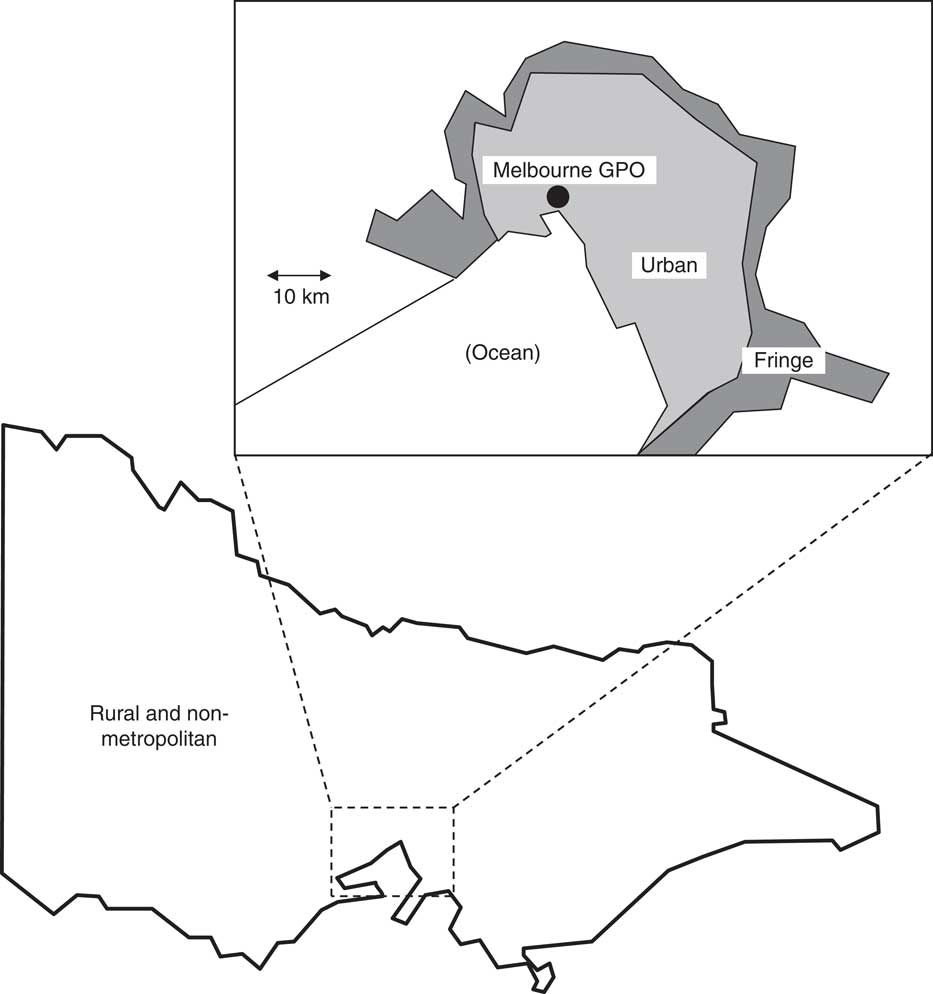
Fig. 1 Representation of the sampling zones for stores from urban, urban-fringe and rural/non-metropolitan areas within the state of Victoria, Australia (GPO, General Post Office)
Audit tool
The audit tool used in the present study has been described previously( Reference Thornton, Cameron and McNaughton 32 , Reference Cameron, Thornton and McNaughton 33 ). Briefly, the tool was developed to measure the following aspects of the supermarket food environment: (i) shelf space of fruits and vegetables, snack foods and soft drinks; (ii) the presence of these products at end-of-aisle displays (both front of aisle (i.e. near checkouts) and back of aisle); and (iii) the presence of these products at checkout displays. All data collection was undertaken by fieldworkers trained in the use of the audit tool, which also included written instructions. Urban audits were conducted between September 2010 and February 2011 (but not including December, due to the influence of Christmas on in-store displays). Urban-fringe audits were conducted in May 2012 and rural/non-metropolitan audits were conducted between July 2012 and November 2012. Four fieldworkers conducted the audits (two for urban stores, two for urban-fringe and rural/non-metropolitan stores). The audit tool has previously been found to have good test–retest reliability, with audits of two stores six weeks apart having 13 % absolute mean difference in numbers of items counted and 4·8 % difference in total snack food shelf space( Reference Cameron, Thornton and McNaughton 33 ).
The products assessed here were chosen based on their clearly healthy (fresh fruits, vegetables) and unhealthy nutrient profiles. Unhealthy foods chosen were stocked/displayed in clearly defined sections, usually consumed outside the three main meals (i.e. were snack foods/drinks) and clearly defined as being discretionary foods based on their high energy content and low micronutrient content. These included crisps (potato chips), chocolate (as bars, blocks, boxes or bags), confectionery/lollies (excluding chewing gum) and soft drinks. The shelf space (in linear metres) of each product type in the aisle was measured using a measuring wheel. Literature demonstrating the importance of managing shelf space to increase sales dates back at least four decades( Reference Curhan 37 ), with Rose et al. demonstrating a modest relationship between shelf space of unhealthy foods and obesity( Reference Rose, Hutchinson and Bodor 38 ). The presence of each product at checkout or end-of-aisle displays was recorded on a checklist (individual displays could contain multiple product types), with the percentage of displays containing each product type calculated.
When measuring shelf space, both regular and diet soft drinks were included together (as they are often intermingled in displays). When assessing their presence at end-of-aisle or checkout displays, regular and diet soft drinks were assessed separately. The shelf space of fruits and vegetables was calculated as the sum of the total aisle length (in metres) of standard shelf space, refrigerator space and island bin space containing fresh fruits and vegetables (‘island bins’ being two-dimensional free-standing displays also known as ‘produce bins’). Shelf space of island bins was defined as the circumference of bins containing fruits and vegetables. Because of the difference between the display types of fruits/vegetables v. soft drinks, crisps, chocolate and confectionery, the shelf space of these categories should not be compared directly. Total store size was measured as the sum of the length of each aisle in the supermarket (length and width of the store was not measured due to the reality that many supermarkets are not square or rectangular in shape).
Statistical analysis, ethical considerations and consent
The ratio of shelf space allocated to fruits and vegetables v. snack foods and soft drinks was calculated by dividing the former by the latter, to provide a summary measure that reflects the overall shelf space of both healthy and discretionary foods. The mean shelf space allocated to the various included foods was assessed as the estimated marginal mean (using the ‘margins’ command in Stata) in linear regression models that also included a term for total store size. Two-sided t tests for the difference in means between urban, urban-fringe and rural/non-metropolitan areas were calculated. To estimate the association between location and the shelf space or placement of foods, independent of neighbourhood socio-economic position, models were fit that also included a term for area-level socio-economic disadvantage. The percentage of both checkout and end-of-aisle displays containing snack foods were calculated, stratified by location. All statistical analysis was undertaken using the statistical software package Stata version 13. Informed consent was obtained from store managers prior to auditing stores. Although the project was assessed by a Human Research Ethics Advisor from the Office of Research Integrity at Deakin University, formal ethical approval was not required since no personal disclosure was involved.
Results
A total of sixty-five stores were included in the present study. On average, stores were largest in the urban-fringe and smallest in urban areas (P for difference=0·05; Table 1). The level of disadvantage was greater, and population density lower, in rural/non-metropolitan areas compared with both urban and urban-fringe areas (P<0·01). The shelf space allocated to both fruits and vegetables and snack foods/soft drinks is also presented in Table 1, with all values adjusted for total store size. Urban stores had considerably greater fruit and vegetable shelf space (122·8 m) compared with both urban-fringe (99·6 m) and rural/non-metropolitan (99·4 m) stores (both P<0·05). No significant differences in the shelf space allocated to crisps, chocolate and confectionery were observed according to geographical location. Rural/non-metropolitan stores had less shelf space allocated to soft drinks (17·7 m) compared with both urban (22·1 m) and urban-fringe (21·4 m) areas (both P<0·01). The total shelf space for all snack foods and soft drinks combined was similar in urban (56·8 m) and urban-fringe (58·9 m) areas but lower in rural/non-metropolitan areas (52·4 m). Based on the considerably higher shelf space for fruits and vegetables in urban areas, the ratio of shelf space allocated to fruits and vegetables v. snack foods and soft drinks was higher in stores from urban areas (2·2) than in both urban-fringe (1·7; P<0·05) and rural/non-metropolitan stores (1·9; P=0·056). Urban stores had a lower percentage of checkout displays containing either soft drinks or confectionery (37·9 and 1·2 % for soft drinks and confectionery, respectively, v. 52·5 and 8·1 % in urban fringe and 55·4 and 28·6 % in rural/non-metropolitan stores); however, chocolate was more prominent at checkouts in urban and urban-fringe areas (65·0 and 58·7 %, respectively, v. 30·2 % in rural/non-metropolitan stores). Rural/non-metropolitan stores had a far higher percentage of front-of-aisle displays than back-of-aisle displays containing any of soft drinks, crisps, chocolate or confectionery (49·3 v. 25·9 %). The same discrepancy was not seen in urban or urban-fringe stores, which had a more similar percentage of these products at front- and back-of-aisle displays (41·1 v. 46·1 % for urban stores, 42·7 v. 38·5 % for urban-fringe stores).
Table 1 Store characteristics and promotion of healthy and unhealthy food according to geographic location: urban (September 2010–February 2011), urban fringe (May 2012) and rural/non-metropolitan (July 2012–November 2012), Victoria, Australia
* Only values where P<0·1 are shown.
† Adjusted for store size.
Following on from the univariate analyses, the association between each in-store factor and locality was assessed with adjustment for neighbourhood socio-economic position, with the degree of disadvantage being greater in rural/non-metropolitan areas (Table 2). Almost all of the associations seen in univariate analyses were also observed following adjustment for neighbourhood socio-economic position (the only exception being the greater shelf space of soft drinks in urban stores compared with rural/non-metropolitan stores, which was not significant following adjustment for neighbourhood socio-economic position). Independent of geographical area, neighbourhood socio-economic position was significantly associated with the following variables: shelf space of soft drinks, shelf space of total snacks, the ratio of fruit and vegetable to snack shelf space, and the proportion of back-of-aisle displays containing soft drinks or snacks.
Table 2 AssociationFootnote * of both geographic location and neighbourhood socio-economic position with the promotion of healthy and unhealthy products in supermarkets, Victoria, Australia (September 2010–November 2012)
Ref., reference category.
* Model included terms for area-level socio-economic position (Index of Relative Socio-economic Disadvantage), size of store and geographic location (urban, urban-fringe, rural/non-metropolitan). β values and 95 % CI presented in bold are where 95 % CI do not include zero.
† Shelf space adjusted for store size.
Discussion
The placement of discretionary foods such as soft drinks, crisps, chocolate and confectionery was uniformly common at end-of-aisle and checkout displays in each of the urban, urban-fringe and rural/non-metropolitan settings studied. Clear geographic patterning was observed in this sample, with urban stores having a generally healthier food environment compared with both urban-fringe and rural/non-metropolitan stores. Greater shelf space of fruits and vegetables and a lower proportion of both soft drinks and confectionery at checkouts (albeit with more chocolate at checkouts) were found in urban stores. These findings largely remained following adjustment for neighbourhood socio-economic position. Adding to previous findings of neighbourhood socio-economic variation in the within-store food environment of urban stores in Melbourne( Reference Cameron, Thornton and McNaughton 33 ), this work has confirmed that socio-economic variation is also present in the in-store environment of stores from urban, urban-fringe and rural/non-metropolitan areas.
Characteristics of the urban-fringe and rural/non-metropolitan areas
In Victoria, the urban fringe is an area with limited social and community services, fewer employment opportunities, car dependence, long commuting times (urban-fringe stores in the present study were on average almost 40 km from the centre of Melbourne) and increased risk of social isolation( 39 , Reference Andrews 40 ). Many of the rural/non-metropolitan areas surveyed share some of these same characteristics. These negative factors are countered by the appeal of what is often considered by residents to be a fairly safe and healthy natural environment with ample public open space. As is evident from Table 1, the urban fringe of Melbourne is certainly not synonymous with neighbourhood disadvantage, having a similar score on the Index of Relative Socio-economic Disadvantage to the urban areas included in the present study. Although land is generally cheaper in the urban fringe, the majority of residents are employed and buying their own homes, with many families choosing to live in the urban fringe because of the space, affordability and natural environment to be found there( Reference Andrews 40 , Reference Andrews, Rich and Stockdale 41 ). Levels of disadvantage were much higher in the rural/non-metropolitan areas included here, which were on average 180 km from the centre of Melbourne. The definition of ‘rural/non-metropolitan’ in the present study excludes very small towns and remote areas, with populations in these areas not able to support the large supermarkets of the type studied here. It is unlikely that logistics could be considered a barrier to the supply of fresh fruits and vegetables in the rural/non-metropolitan stores studied, with the shelf space being similar to that seen in urban-fringe stores. All of the rural/non-metropolitan stores studied were from large rural/non-metropolitan centres (population >6000) that could support a large supermarket.
Could the supermarket environment be a contributor to higher body weight in the urban fringe and rural/non-metropolitan areas?
Among studies in adults and children from a range of developed countries, most (but not all)( Reference Hodgkin, Hamlin and Ross 42 , Reference Reeder, Chen and Macdonald 43 ) find more obesity in rural compared with urban areas( Reference Itoi, Yamada and Watanabe 9 – Reference Eberhardt and Pamuk 22 ). Several studies have attempted to quantify the link between suburbanisation and obesity( Reference Nejad and Ross 44 ), with a possible empirical basis for this association being lack of time due to long commutes, less recreational facilities and fewer opportunities for active transport( Reference Garden and Jalaludin 25 , Reference James, Troped and Hart 26 , Reference Ewing and Cervero 45 ). Eid et al. and others have argued that selection effects could be responsible for this association, with overweight and obese individuals choosing to live in the urban fringe( Reference Eid, Overman and Puga 46 , Reference Plantinga and Bernell 47 ). Using more advanced modelling methods, recent work suggests (at least in the USA) that although a selection effect may be evident, the association between ‘urban sprawl’ and obesity was apparent( Reference Nejad and Ross 44 ). In a recent systematic review of the environmental factors associated with weight status, urban sprawl was one of only two factors consistently implicated (noting that eleven of the twelve studies were from the USA). The food environment has rarely been implicated in the urban–rural weight gradient, with no difference in either the cost of healthy food or the number of both greengrocers and supermarkets in rural and urban areas of Victoria (at least those with major chain supermarkets)( Reference Palermo, Walker and Hill 48 – Reference Thornton, Crawford and Cleland 50 ). We are not aware of any previous work identifying a more obesogenic in-store supermarket environment in either the urban-fringe or rural and non-metropolitan areas, either in Australia or elsewhere. Although based on a cross-sectional study design that precludes causal attribution, the current paper therefore introduces another potential mechanism that could help to explain the geographic gradient in overweight and obesity.
Why does the supermarket environment vary?
Variation in the demographic profile (and purchasing behaviour) of communities can influence the promotion, placement and product assortment mix provided by retailers( Reference Hawkes 51 ). Retailers commonly argue that what they stock and their marketing and promotion practices are a simple response to consumer demand. While this is partially true, it is also true that in the complex relationship between supermarkets and their customers, retailers also drive demand( Reference Dawson 52 ), with marketing always designed to drive profit. Whether the association is causal or not, there can be no doubt that the supermarket environment observed in the urban-fringe and rural/non-metropolitan stores surveyed here is not promoting the weight loss required in these communities.
Strengths and limitations
Strengths of the present study include the use of a uniform audit tool assessing both healthy and unhealthy features of the within-store supermarket food environment in a large sample of urban, urban-fringe and rural/non-metropolitan supermarkets from the leading Australian supermarket chain. Nevertheless, the results should be considered in the light of the study limitations. As a cross-sectional study, we assessed the supermarket environment at a single point in time, with audits in different areas being undertaken during different seasons (urban, spring/summer; urban fringe, autumn; rural/non-metropolitan, winter/spring) and with a two-year time gap between the first and last audits. Few reports have examined temporal variation in supermarket displays; however, a US study did find that availability of fresh produce (fruits, vegetables, meat, dairy, grains) was generally stable over two weeks and that a single observation is often an accurate reflection of the stores’ usual stocking practices, at least within a season( Reference Zenk, Grigsby-Toussaint and Curry 53 ). Furthermore, shelf space and the presence of soft drinks (usually in fridges) and chocolate or confectionery at checkouts are likely to be stable throughout the year given the logistical constraints of modifying the related infrastructure. Our results for end-of-aisle displays, however, need to be viewed with caution given the variation in these displays both weekly (relating to what is promoted in catalogues) and seasonally. A study of the seasonal variation in end-of-aisle displays may be instructive in this regard. In the urban area, sampling was stratified by neighbourhood socio-economic position, meaning that although the urban stores give a good indication of the range of difference according to neighbourhood socio-economic position, they may not precisely reflect the food environment of all urban stores. The use of different auditors in the urban, urban-fringe and rural/non-metropolitan components of the study could also introduce bias; however, the simple nature of the measurements, the checklist nature of the audit tool and the training undertaken by each auditor should all limit this. Although the foods assessed here are highly prominent within supermarkets and are clear examples of foods that should be eaten daily and those that should be considered discretionary foods, they are not the only foods sold in supermarkets. Variation in the promotion and placement of other healthy and unhealthy foods may not follow the same pattern. Finally, as we assess only the in-store environment and not the impact on purchasing or individual-level health outcomes, we can only speculate about the true impact of the store environment on overweight and obesity prevalence.
Conclusion
In conclusion, these results suggest geographic variation in the shelf space and placement of healthy and discretionary foods in Victorian supermarkets. Since this is the first time that this type of study has been conducted internationally, we await similar studies from other states and countries to determine whether this is a generalizable trend. The lower shelf space of fruits and vegetables, and the greater placement of soft drinks at checkouts in urban-fringe and rural/non-metropolitan stores, parallels the prevalence of overweight and obesity in these areas and works against public health imperatives. Supermarkets could support the health of urban-fringe and rural/non-metropolitan communities with initiatives that increase shelf space of fruits and vegetables and limit the placement of soft drinks at checkouts.
Acknowledgements
Acknowledgements: The author thanks Lukar Thornton for his comments on previous versions of this manuscript and his contribution to the design of this study, as well as Kate Udorovic, Siobahn O’Halloran and Leah Salmon for assistance with data collection, Brian Miller for data management and Jay Wen for assistance with store selection. Financial support: A.J.C. is supported by a DECRA fellowship (DE160100141) from the Australian National Health and Medical Research Council (NHMRC), and is a researcher within an NHMRC Centre for Research Excellence in Obesity Policy and Food Systems (APP1041020). The NHMRC had no role in the design, analysis or writing of this article. Conflict of interest: The author is the academic partner on a supermarket intervention trial that includes the Victorian Health Promotion Foundation (VicHealth) as well as Australian local government and supermarket retail (IGA) collaborators. Authorship: A.J.C. is the sole author of this manuscript. Ethics of human subject participation: The project was assessed by a Human Research Ethics Advisor from the Office of Research Integrity at Deakin University; formal ethical approval was not required since no personal disclosure was involved. Informed consent was obtained from store managers prior to auditing stores.


