


High dietary Na intakes that exceed recommendations are common in children aged 1–6 years in developed countries, with mean reported intake of >1000 mg/d (2·6 g salt equivalent/d)( Reference Brown, Tzoulaki and Candeias 1 ). For example, in Australian children aged 2–3 years, dietary Na intake has been estimated at ~1500 mg/d (3·8 g salt/d)( 2 ) which exceeds the daily Upper Level (UL) of Intake of 1000 mg/d for 1–3-year-olds( 3 ). Excessive dietary Na consumption throughout childhood is associated with high blood pressure( Reference He, Marrero and Macgregor 4 ), which tracks across the lifespan( Reference Chen and Wang 5 – Reference Tirosh, Afek and Rudich 7 ) and is a risk factor for CVD in adulthood( Reference Lauer, Clarke and Mahoney 8 ). Moreover, early-life dietary habits tend to follow a trajectory from childhood and lay the foundations for eating patterns during adulthood( Reference Nicklaus and Remy 9 , Reference Mikkila, Rasanen and Raitakari 10 ). This suggests that highly salted food exposure during childhood may increase the possibility of these dietary patterns continuing into adulthood. It is therefore important to establish healthy eating patterns that are low in salt early in life.
Ultra-processed (ULP) foods are industrially processed, highly palatable, habit forming, characteristically energy dense, high in added sugar, salt and saturated fat, and often contain artificial additives, flavours and colours( Reference Monteiro, Cannon and Levy 11 ). There are growing health concerns about ULP foods as these types of foods have become increasingly dominant in the global food system( Reference Moodie, Stuckler and Monteiro 12 – Reference Moubarac, Martins and Claro 15 ) and diets dominated by ULP foods have contributed to changes in childhood lipid profiles( Reference Rauber, Campagnolo and Hoffman 16 ), increased rates of obesity and weight gain( Reference Mozaffarian, Hao and Rimm 17 , Reference Romaguera, Angquist and Du 18 ) and type 2 diabetes( Reference Malik, Schulze and Hu 19 ) in adults and children.
In Australia, approximately 50 % of children aged 0–5 years attend long day care (LDC) where the majority spends on average 10–19 h/week( 20 ). In these settings, lunch and morning and afternoon snacks and drinks are usually provided( 21 ) and, according to nutritional recommendations, these meals together should contribute half of children’s total daily energy and nutrient requirements( Reference Benjamin Neelon and Briley 21 , 22 ). Hence LDC centres are likely important settings with regard to young children’s nutritional health.
The proportion of foods, beverages and ingredients provided at Australian LDC centres classified as ULP has not been assessed and there is no information on the contribution of ULP to the Na/salt content of foods and dishes provided on a daily basis in LDC. Therefore, the aims of the present study were to: (i) categorize individual foods based on the level of food processing using our NOVA-AUSNUT 2013 classification system( Reference O’Halloran, Lacy and Grimes 23 ); (ii) calculate the proportions of minimally processed (MP), processed culinary ingredients (PCI), processed (P) and ULP among all foods and beverages and meals provided; and (iii) determine the contribution of Na from each of the four levels of food processing.
Methods
Study design
The present study used menus and recipes (which contained all foods, beverages and ingredients) collected over one week (Monday to Friday) as part of our previous cross-sectional study involving the assessment of foods consumed at lunch by pre-school children attending LDC centres within the Geelong area (regional city within the State of Victoria), Australia. Briefly, the study involved the recruitment of 100 children aged 3–4 years attending LDC. LDC centre managers in the region were approached and information about the centre cooking practices was collected over the telephone. Centres were eligible to participate if a cook worked on site, meals were provided to all children and a conventional food system (raw food purchased and transformed into the final product for service) was used. When one centre declined to participate another centre was approached. This continued until a sufficient number of centres was recruited to reach the target number of potentially 3–4-year-old children. Thirteen LDC centres (of a possible forty-two) were approached for study participation and seven agreed (response rate 54 %). Six centres (five privately operated, one local government operated) declined to participate. The reasons cited were: did not have time (n 2) and not interested (n 4). Centre managers provided further information on the use of menu planning guidelines, menu reviews and attendance of a menu planning workshop during a face-to-face meeting with the researcher.
Ethical approval was obtained from the Deakin University Human Research Ethics Committee (ID number: HEAG-H 90/2015).
Long day care food provision
Centre managers and/or cooks (who prepared the dishes on-site mostly from raw ingredients) were responsible for planning two-week menu cycles. All centres voluntarily followed dietary recommendations set out in the Healthy Eating Advisory Service (HEAS) menu planning guidelines from Nutrition Australia (Victorian State branch)( 22 ). According to these guidelines, LDC centres must provide meals that are diverse in tastes, colours, textures and flavours, main meals must not be repeated throughout the two-week menu cycle and key ingredients must not be repeated on the same day of the week (e.g. chicken served every Tuesday). In addition, all centre managers and cooks attended an interactive workshop with Nutrition Australia which provided information on developing menus that met Australia’s National Health and Medical Research Council’s Australian Dietary Guidelines( 24 ) and nutrition requirements for 1–5-year-olds( 22 ).
In keeping with the Australian Dietary Guidelines( 24 ) on salt usage and the consumption of salty foods, the HEAS guidelines for LDC centres also state: the addition of salt during cooking or at the table should be avoided and low/reduced-salt or no-added-salt packaged foods (e.g. sauces, stock or canned fish) should be used during cooking; processed foods such as ham or bacon (which are important contributors to dietary Na intake in children( Reference Brown, Tzoulaki and Candeias 2 )) should be limited to once or twice per week; other processed meats such as sausages, frankfurters, salami, and commercial chicken and fish products (e.g. chicken nuggets or fish fingers) are not recommended; and discretionary food items (e.g. chips and savoury snacks), which are often high in fat, sugar and salt, should also be avoided( 22 , 24 ). For the present analysis, we used menus and recipes for lunch and morning and afternoon snacks that were prepared for all children aged 1–5 years attending LDC.
NOVA classification system and AUSNUT nutrient database
The NOVA-AUSNUT 2011–13 classification system( Reference O’Halloran, Lacy and Grimes 23 ), a combination of the NOVA classification system( Reference Moubarac, Parra and Cannon 25 ) and AUSNUT 2011–13 nutrient database( 26 ), was applied manually to all foods, beverages and ingredients within each menu at the AUSNUT 8-digit food level (Fig. 1).
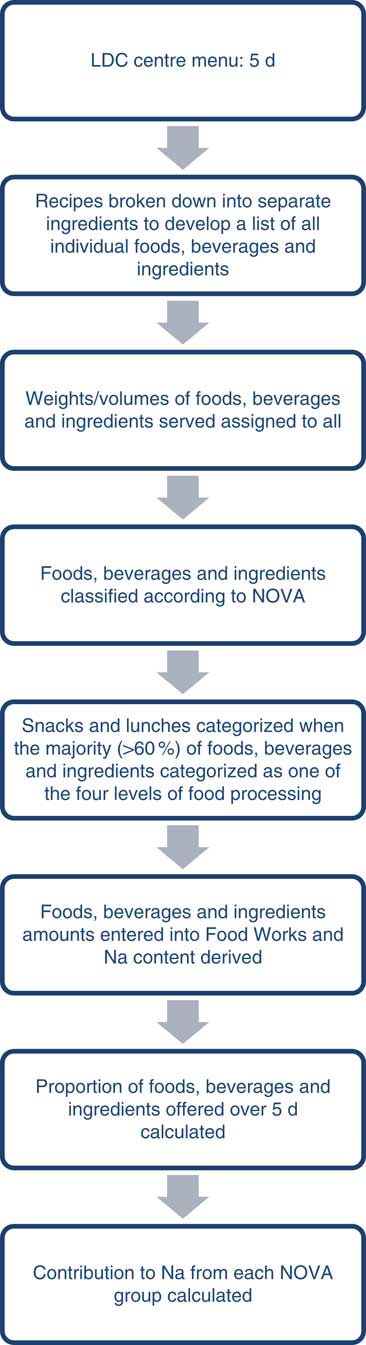
Fig. 1 Process for classifying all foods, beverages and ingredients provided, and for calculating the contribution to sodium over 5 d, at each long day care (LDC) centre
The NOVA system is the most studied food processing classification system and groups foods, beverages and ingredients according to the intention of use and degree of industrial food processing rather than in terms of nutrients and food types( Reference Moubarac, Parra and Cannon 25 ). Criteria and examples of the NOVA system are described in detail in Table 1. The four food processing categories include: (i) minimally processed (MP) foods (e.g. fresh, dry, frozen fruits or vegetables, meat, milk, grains); (ii) processed culinary ingredients (PCI) (e.g. salt, sugar, oil, fat); (iii) processed (P) foods (e.g. cheese, bread, canned fish); and (iv) ultra-processed (ULP) foods (e.g. crisps, instant soups, confectionery)( Reference Monteiro, Cannon and Levy 11 , Reference Moubarac, Parra and Cannon 25 ).
Table 1 The NOVA food processing classification system( Reference Monteiro, Cannon and Levy 11 , Reference Moubarac, Parra and Cannon 25 )
The AUSNUT 2011–13 nutrient database, which was developed by Food Standards Australia and New Zealand to estimate nutrient intakes from the 2011–13 Australian Health Survey, groups foods according to a 2-digit, 3-digit or 5-digit food group( 26 ). The first two numbers refer to the major food group to which a food belongs, based on a key ingredient (e.g. cereals and cereal products). The 3-digit food group falls within the 2-digit food group (e.g. regular bread and bread rolls). The 5-digit food code represents foods which are divided based on nutritional or manufacturing factors, such as whether they contain saturated fat above or below a nominated value, are fortified or are produced in a particular way (e.g. white bread and bread rolls). The 5-digit group then forms the basis of the survey ID (8-digit) assigned to each food, beverage or ingredient (e.g. bread roll from white flour)( 26 ).
The total number of foods, beverages and ingredients provided at all centres over one week (5 d) was calculated. Foods and beverages that appeared in more than one recipe were counted multiple times in the total. Regarding the provision of milk, an average volume of milk per child per morning snack (e.g. 100 ml per forty children=4 litres of milk for Centre 1 for Monday morning snack) was entered into the nutrient analysis software FoodWorks. Foods that were provided for desserts at lunchtime were combined with the lunches (e.g. spaghetti bolognaise and fruit and yoghurt) for analysis.
Sodium analysis
All foods, beverages and ingredients from the one week of recipes were entered into FoodWorks version 8 (Xyris Software, Brisbane Australia). The NOVA-AUSNUT 2011–13 classification system was applied to each food, beverage and ingredient and the Na contribution (per serving) from each processed food group was calculated.
Sodium intake recommendations
The mean total dietary Na provided to children for 1 d was calculated from the standard servings of foods and beverages provided and was compared with the National Health and Medical Research Council’s UL for Na of 1000 mg/d for children aged 1–3 years (e.g. lunch and two snacks to provide 50 % of UL for Na=500 mg Na/d)( 3 ).
Statistical analysis
All foods, beverages and ingredients were entered into a Microsoft® Office Excel 2013 spreadsheet and the proportions of MP, PCI, P and ULP were calculated. Descriptive statistics were used to describe the processed food group contributions to Na. ANOVA was used to assess differences in the mean daily amount of Na between LDC centres and in the mean Na content between the four types of processed foods. Sidak post hoc pairwise comparison was performed as a follow-up comparison test. Analyses were conducted using the statistical software package STATA/SE 13.1. A P value of <0·05 was considered significant.
Results
Centre menu characteristics
The total number of children aged 1–5 years across the seven LDC centres was 442. A total of thirty-five daily menus for 5 d (lunch, n 35; snacks, n 70) and recipes were assessed from the seven centres. Six of the seven centres provided pieces of fresh fruit (e.g. apples, bananas and pears) for morning snack, with one centre providing muffins, pancakes, crackers, sultana bread or ham and cheese rice cakes/biscuits for five mornings during the week. Afternoon snacks across the centres were either cooked from raw ingredients (e.g. scones; cookies; carrot cake) or consisted of processed foods (e.g. crackers and dips/cheese; raisin toast; bread and spreads); only one centre, on one occasion, served fruit for afternoon snack. All lunches provided were cooked mixed dishes (rather than sandwiches) and consisted of a combination of fresh (e.g. vegetables) and manufactured foods/ingredients (e.g. curry paste, stock powder). Desserts were provided as part of lunch and varied across the centres (e.g. fruit; yoghurt; apple pie; custard). At all centres, beverages consisted of full-cream plain/whole milk, which was served at morning snack every day, or water, which was available at all times. One-week menus for each centre are shown in the online supplementary material, Supplemental Table 1.
Sodium contribution from foods, beverages and ingredients
The mean amount of Na provided per child from all meals and snacks assessed from the recipe standard servings across all centres was 633 mg/d (Table 2). Overall, across the seven centres, ULP foods contributed significantly to the mean daily Na amount (Fig. 2).
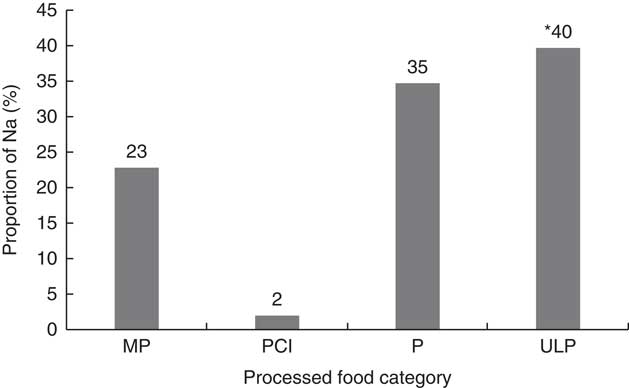
Fig. 2 Contribution of sodium from foods, beverages and ingredients provided to 1–5-year-old children attending seven long day care centres in the Geelong area, Victoria, Australia (August–October 2015), according to the four food processing levels (MP, minimally processed; PCI, processed culinary ingredients; P, processed; ULP, ultra-processed). Significant contribution of ULP to mean daily sodium amount: *P<0·001
Table 2 Proportion (%) of sodium from foods, beverages and ingredients, and the amount of sodium (mg) per child per day, provided to 1–5-year-old children attending seven long day care centres in the Geelong area, Victoria, Australia (August–October 2015), according to the four levels of food processing
MP, minimally processed; PCI, processed culinary ingredient; P, processed; ULP, ultra-processed.
* Percentage of total Na (mg/d).
† Na (mg/d) from individual standard servings of lunch and two snacks (morning and afternoon).
Level of food processing of foods, beverages and ingredients
Of all foods, beverages and ingredients provided at all centres over 5 d, 54 % were MP, 21 % were ULP, 15 % were P and 10 % were PCI. Across all centres the proportions of the four levels of processing and the mean Na served per child per day varied (Table 2). Centre 3 provided the greatest mean daily amount of Na, whereas Centre 6 provided the least (909 v. 468 mg, P<0·001). The difference in the mean daily amount of Na was due to the type of ULP foods provided on more than one day at Centre 3 (e.g. Vegemite™ (yeast extract), processed cheese and mass-manufactured breads/English muffins). Centre 7 provided a greater proportion of MP and the lowest proportion of ULP, which resulted in a low mean daily Na provision.
Level of processing of lunches and snacks
The proportions of foods, beverages and ingredients (within the morning snacks, lunches and afternoon snacks provided), categorized according to the four processed food groups, indicate that all lunches were classified as MP (Table 3). The majority of morning snacks provided were classified as MP (88 %) in contrast to the afternoon snacks where almost half were classified as ULP, with close to a quarter classified as P. Notably, afternoon snacks accounted for close to half of the total Na provided for the day, which was comparable to the proportion of daily Na provided by lunch: 48 v. 43 %.
Table 3 Proportion (%) of snacks and lunches classified according to the four food processing levels and the mean amount of sodium (mg) provided during these meals to 1–5-year-old children attending seven long day care centres in the Geelong area, Victoria, Australia (August–October 2015)
MP, minimally processed; PCI, processed culinary ingredient; P, processed; ULP, ultra-processed.
Discussion
In this sample, the mean daily contribution of Na from all lunches and snacks provided at seven LDC centres was 633 mg, which represents 63 % of the UL of Na intake of 1000 mg/d for 1–3-year-olds( 3 ). Guidelines (HEAS) recommend that the two snacks and lunch served at LDC should provide approximately 50 % of daily nutrient requirements( 22 ). As Australian children have been found to be consuming Na in amounts well in excess of the UL( 2 ), it would seem that an appropriate, achievable target would be to ensure that the Na content of the foods provided on a daily basis at LDC centres does not exceed half the UL for Na, namely 500 mg Na/d( 3 , 22 ). Therefore, although the Na content of the food provided was on average 13 % more than desirable, the Na content of the foods was not excessive, particularly in context of results from the 2011–13 Australian Health Survey where children aged 2–3 years were found to be consuming an average daily intake of ~1500 mg Na/d (one-and-a-half times the UL)( 2 ). Finding a range of lower-salt foods, particularly mid-meal snacks, is challenging even for these centres which are utilizing the HEAS menu planning guidelines( 22 ) and using low-Na versions of different food products including canned vegetables and legumes.
When we assessed the level of processed foods and ingredients we found that overall only a small proportion of foods (21 %) were classified as ULP (e.g. crackers, tortillas, Asian sauces, mass-manufactured bread, processed cheese, Vegemite™). It was also evident that most of the ULP foods, such as crackers and dips and breads/crumpets/English muffins with spreads, were used in afternoon snacks rather than main meals. It is important to note that lunch, the main meal of the day, provided less than half of the daily Na (43 %), whereas afternoon snacks accounted for 48 % of the daily Na food provision. As such, more than 40 % of all afternoon snacks were classified as ULP (e.g. pita and bean salsa dip, muffins with spreads, apple muffins). Importantly these ULP foods made the greatest contribution to the total daily amount of dietary Na (40 %), which is perhaps not surprising given that in developed countries approximately three-quarters of dietary Na comes from salt added during the manufacture of these types of foods( Reference James, Ralph and Sanchez-Castillo 27 ). Findings from two recent cross-sectional studies have shown that ULP foods make a significant contribution to young children’s total dietary Na intake. We previously assessed the contribution from the level of processing to total daily Na intake in a sample of Australian children aged 3·5 years and found that ULP foods contributed 48 % of total daily Na intake compared with P (35 %) and MP (16 %) foods( Reference O’Halloran, Grimes and Lacy 28 ). Similarly, utilizing 2 d of dietary data, Sparrenberger et al. found in 204 Brazilian children aged 2–10 years that ULP foods contributed 49 % of total Na, whereas MP foods contributed only 17 % and PCI 35 %( Reference Sparrenberger, Friedrich and Schiffner 29 ).
ULP foods are industrially formulated and tend to be energy dense, with high levels of added Na and/or sugars, and there is a growing body of epidemiological evidence in adults( Reference Mozaffarian, Hao and Rimm 17 , Reference Romaguera, Angquist and Du 18 ) and children( Reference Rauber, Campagnolo and Hoffman 16 , Reference Tavares, Fonseca and Garcia Rosa 30 ) indicating an association between ULP foods and chronic disease. Cross-sectionally, the consumption of ULP foods has been associated with metabolic syndrome in Brazilian adolescents aged 12–19 years( Reference Tavares, Fonseca and Garcia Rosa 30 ). Furthermore, Rauber et al. colleagues found that ULP food consumption in Brazil at pre-school age (3–4 years) was a predictor of increased lipid concentrations at primary school (7–8 years)( Reference Rauber, Campagnolo and Hoffman 16 ). There is also some evidence in high-income countries that the consumption of ULP foods has displaced the consumption of meals/dishes prepared from MP foods( 31 ).
In our sample of seven LDC centres, across one week, the majority of morning snacks were classified as MP as a variety of fresh fruits and full-fat cow’s milk were served during these times, and as such contributed less than 10 % of the total daily Na provision. There was only one centre that provided ULP foods as morning snacks on three occasions, but most other times morning snacks were MP. More ULP foods (41 %) were provided as afternoon snacks across all centres. Therefore, there is scope for LDC centres to reduce exposure to high-salt foods on these occasions.
All lunches were classified as MP (e.g. lasagne, chicken and vegetable spaghetti, lamb and apricot chickpea curry) which were prepared from a majority (>60 %) of MP ingredients (e.g. fresh vegetables, meats, pasta, rice or couscous) and contributed less than a quarter of the total daily Na provision (23 %). According to the NOVA food processing classification system, which distinguishes freshly prepared dishes from manufactured products, MP foods are natural plant-based foods that do not contain added substances such as salts, fats oils or sugars and are altered by processes such as pasteurization, grinding or filtering which only remove inedible or unwanted parts( Reference Monteiro, Cannon and Levy 11 , Reference Moubarac, Parra and Cannon 25 ). It is the consumption of MP foods, such as fresh fruit and vegetables, throughout childhood that is important as higher intakes may reduce the risk of childhood obesity( Reference Epstein, Paluch and Beecher 32 ), stroke( Reference Ness, Maynard and Frankel 33 ) and cancer later in life( Reference Maynard, Gunnell and Emmett 34 ). It is therefore encouraging that the main meals and morning snacks provided at LDC centres were based primarily on MP foods.
A key factor in keeping the total Na content of the meals low at these centres was the provision of cooked lunches rather than sandwiches, which, in Australia, are often provided in schoolchildren’s home-prepared packed lunches or are available for purchase at school canteens( Reference Sanigorski, Bell and Kremer 35 ). These lunchtime sandwiches are typically composed of processed foods such as bread, cheese and ham( Reference Sanigorski, Bell and Kremer 35 ), which according to the recent Australian Health Survey 2011–13 are key sources of Na in school-aged children, together contributing ~26 % of total daily Na( 2 ). Hence the transition from pre-school to primary school likely represents an important time when children are exposed to more Na-dense foods. It is therefore important to limit this shift from low to high Na-dense foods during this time. Effective strategies are likely to involve education programmes for parents on how to select low-Na food choices as well as food industry-led salt reduction policies to reduce Na in the food supply.
Within our sample, 15 % of the foods, beverages and ingredients were classified as P and contributed 35 % of total Na. The foods that fell into this category tended to be canned goods which were nutritionally rich and were low-Na varieties (e.g. canned tomatoes, fish and legumes). It should be noted that all surveyed centres had voluntarily implemented the policy of choosing these low/reduced-salt or no-added-salt packaged products and limited the use of ham or bacon to once or twice weekly( 24 ) as set out in the HEAS menu planning guidelines( 22 ) (which are informed by the Australian Dietary Guidelines)( 24 ). It is therefore likely that the contribution to Na from P foods would have been greater if the centres within our sample had not followed the HEAS guidelines recommending the provision of low-Na packaged products.
Strengths and limitations
We have used a previously tested NOVA-AUSNUT 2011–13 classification system which allows assessment of all foods, beverages and ingredients according to four levels of processing and the contribution of Na from each level in a sample of Australian pre-school children( Reference O’Halloran, Grimes and Lacy 28 ). Furthermore, the analysis of 5 d of recipes from each centre allowed for the assessment of typical foods, beverages and ingredients provided to children at these settings on a regular basis. However, our analysis provides information only on the provision rather than the consumption of processed foods and beverages at these settings. We did not measure the actual Na content of food served and relied on food composition tables to determine the amounts of Na provided. In addition, our sample was subject to selection bias as all seven LDC centres participated in the workshop provided by Nutrition Australia and adhered to the HEAS menu planning guidelines( 22 ). Thus our findings cannot be generalized to other Australian LDC centres. Nevertheless, these data show the best-case scenario regarding the provision of ULP foods and their contribution to total Na. It would be interesting to assess the Na content of the foods provided in LDC centres that did not follow the guidelines, as they may provide less MP foods and a greater proportion of ULP foods.
Conclusion
We have categorized and assessed foodstuffs provided at Australian LDC centres according to four levels of food processing, determined the contribution of Na from each level of processing and found that all lunches were classified as MP. ULP foods contributed the greatest proportion of Na, despite accounting for only 20 % of foods and beverages provided. The mean amount of Na provided per child per day across all centres represented 63 % of the recommended UL of Na intake for this age group. However, a significant proportion of ULP snack foods were included, which were the major contributor to total daily Na intake. All centres followed the HEAS menu planning guidelines and used low/reduced-salt products which resulted in a relatively low level of use of P foods. A reduction in the use of ULP foods used to prepare afternoon snacks is recommended to help reduce the amount of dietary Na in young children’s diets.
Acknowledgements
Financial support: This research received no specific grant from any funding agency in the public, commercial or not-for-profit sector. Conflict of interest: None. Authorship: S.A.O. was responsible for the study conception, wrote the manuscript and performed the data analysis. C.A.N. was responsible for the accuracy of the data analysis and together with K.E.L., J.W., C.A.G. and K.J.C., provided significant consultation and critically reviewed the manuscript. Each author has seen and approved the content of the submitted manuscript. Ethics of human subject participation: Not applicable.
Supplementary material
To view supplementary material for this article, please visit https://doi.org/10.1017/S136898001700132X


