


The weaning period is an important window of opportunity for growth promotion( Reference Victora, de Onis and Hallal 1 ). Improved breast-feeding and complementary feeding practices may significantly reduce the incidence of growth faltering and other deleterious consequences of childhood undernutrition( Reference Bhutta, Ahmed and Black 2 ). The WHO recommends that breast-feeding status and high diversity in the complementary diet should be used as positive indicators of appropriate feeding in infants aged ≥6 months( 3 ). Much is known about the beneficial effects of breast-feeding and several recommendations exist for prolonging breast-feeding duration( 3 ). Dietary diversity scores (DDS) are widely used in large surveys (such as the Demographic and Healthy Survey) as they facilitate crude assessment of dietary quality, thus foregoing more resource-intensive dietary intake methods. Many studies suggest that DDS are positively associated with nutrient adequacy and infant nutritional status( Reference Moursi, Arimond and Dewey 4 – Reference Steyn, Nel and Nantel 14 ). In light of the operationalization of the DDS in monitoring and evaluation, we believe it is important to understand whether and just how well this WHO-recommended dietary index correlates with diet and ultimately growth.
Although there are many changes in the diet as the infant transitions from breast milk to family foods, most past studies on the diversity of the complementary diet have relied on cross-sectional data. This approach is limited for several reasons. Since infants are changing their consumption of breast milk and weaning foods throughout infancy, the interactive and potentially synergistic effects of breast-feeding and complementary foods must be explored. The impact of complementary foods on infant nutritional status varies with age. The introduction of complementary foods before 6 months may be detrimental( Reference Kramer and Kakuma 15 – Reference Popkin, Adair and Akin 17 ). For example, one systematic review found that exclusive breast-feeding in the first 6 months was associated with reduced diarrhoeal morbidity compared with initiation of complementary foods between 3 and 4 months( Reference Kramer and Kakuma 15 ). However, in older infants breast milk may not be sufficient to support the infants’ nutrient needs and so family foods become a necessary complement to the diet( Reference Brown, Dewey and Allen 18 ). These age interactions make it difficult to adequately explore these nuances in cross-sectional studies. The Cebu (Philippines) Longitudinal Health and Nutrition Survey provides detailed infant feeding and growth data from multiple surveys over a 24-month period( Reference Adair, Hindin and Popkin 19 ). In the present analysis we estimated the association of breast-feeding and dietary diversity with standardized infant length- and weight-for-age (length-for-age Z-score (LAZ) and weight-for-age Z-score (WAZ)) in the weaning period (6 to 24 months). We anticipated that breast-feeding and high dietary diversity would be positive predictors of LAZ and WAZ. We also hypothesized that the association of breast-feeding would be most pronounced in the first 6 months and substantially reduced by 24 months and that the association of high dietary diversity on infant size would increase throughout the weaning period.
Methods
Study population
The Cebu Longitudinal Health and Nutrition Survey (CLHNS) is a study of infant feeding patterns in 3080 live-born singleton infants from Cebu, Philippines( Reference Adair, Hindin and Popkin 19 , Reference Briscoe 20 ). Between 1983 and 1985, data pertaining to infant nutrition, demography, health, anthropometry and socio-economic status were collected at birth (baseline) and then bimonthly until each child was about 24 months old. The study protocol is described in detail elsewhere( Reference Adair, Hindin and Popkin 19 ).
Anthropometry
Trained personnel measured length and weight using standard techniques. LAZ and WAZ based on the WHO growth standards were used as the outcomes( 21 ). The Z-scores were used to account for small age differences at time of measurement, to portray growth patterns in this population relative to a widely accepted growth standard and to quantify effect sizes for exposures of interest.
Dietary exposures
Dietary data were collected using 24 h dietary recalls administered at each bimonthly visit. During interviews, mothers were questioned about all foods or liquids the child consumed in the past 24 h. Nutrient information for complementary foods was derived from food composition tables provided by the Food and Nutrition Research Institute of the Philippines( 22 ). The micronutrients analysed were retinol equivalents, Ca, Fe, niacin, P, riboflavin and thiamin. Energy and macronutrients were also analysed because the main outcome of the study is growth and these are critical contributors to infant size. The breast-feeding variable was a dichotomous indicator (yes/no) of whether the infant was breast-fed in the past 24 h, which is also the same time period of reference for the 24 h dietary recall. This dichotomous variable is also a valid time-varying indicator of current breast-feeding status, as evidenced by its high concordance with other more detailed indicators available from the CLHNS. The DDS was based on the seven food groups recommended by the WHO feeding practices for infants and young children: (i) starches (grains, gruels, cereals, roots, tubers and other staples); (ii) β-carotene-rich fruits and vegetables (plant products containing >60 retinol activity equivalents per 100 g); (iii) other fruits and vegetables; (iv) legumes, seeds and nuts; (v) flesh foods (chicken, fish, beef and other animal flesh foods); (vi) eggs; and (vii) milks( 3 ). Any consumption of 10 g or more of a given food group was awarded 1 point, for a maximum of 7 points. A 10 g threshold was used because a previous study in this cohort found that imposing this cut-off point excluded foods consumed in very small quantities and improved correlations of the DDS with nutrient intake( Reference Daniels, Adair and Popkin 11 ). By this method, infants assigned a DDS of ‘0’ for a given survey may have consumed breast milk alone, or breast milk and <10 g of these complementary food groups, or may have only had <10 g of these complementary food groups. Consumption of any fortified foods was rare (<2 %). The ordinal seven-food-group DDS was used for descriptive statistics on diet composition. However, for the regression analyses, a dichotomized dietary diversity indicator was used (high, ≥4 food groups; or low, <4 food groups), consistent with the recommendations of the WHO( 3 ).
The data derived from the 24 h recall were more detailed than this binary indicator of diet quality. However, we desired a simple indicator and the DDS has been operationalized as a proxy for infant nutrition both in public health practice and research( Reference Moursi, Arimond and Dewey 4 – Reference Steyn, Nel and Nantel 14 ). Furthermore, since few studies have analysed the association of the DDS throughout the weaning period using rigorous longitudinal analyses, we also aimed to fill this gap in the literature. To analyse the joint associations of dietary diversity and breast-feeding, binary indicators were used for each of the four possible complementary feeding patterns (CFP): (i) the referent pattern of no breast-feeding and low dietary diversity; (ii) breast-feeding with low dietary diversity; (iii) no breast-feeding and high dietary diversity; and (iv) the optimal feeding pattern of breast-feeding with high dietary diversity. Energy intake from non-breast milk sources was continuously coded in 4184 kJ (1000 kcal) units to aid the interpretation of estimated β coefficients.
Statistical analyses
To assess how the DDS related to nutrient intake from complementary foods, Pearson correlation coefficients were generated for the ordinal 7-point DDS and nutrients when infants were 12 months old. We wished to stratify by breast-feeding and by 12 months CFP were well established and breast-feeding (n 1611) and non-breast-feeding (n 989) strata were reasonably large. The magnitudes of the correlations did not differ substantially when other surveys were used. A P value of <0·05 was regarded as significant. We also calculated the correlations between the DDS and energy-adjusted nutrients (expressed as the ratio of nutrient to total energy intake from complementary foods). Two-tailed t tests were conducted to assess differences in complementary energy intake between breast-fed and non-breast-fed boys and girls at each survey wave.
We present the patterns of complementary feeding from 0 to 24 months, but since the infant feeding recommendations stipulate that complementary feeding should not begin prior to 6 months, the longitudinal analyses are restricted to the 6–24 month period( 3 ). Regression analyses included infants with complete data for at least one of the ten surveys. Analyses were stratified by sex because sex differences in feeding patterns and anthropometry have been previously reported in this cohort( Reference Popkin, Adair and Akin 17 ). After exclusions for missing data, implausible values, death, migration and attrition, the final sample had 2822 infants (1488 boys with a mean of 8·7 complete observations; 1334 girls with a mean of 8·8 complete surveys). There were no significant differences in the demographic characteristics of the analytical sample used for regression analyses when compared with the original sample of 3080 infants.
The association of CFP with infant size was estimated using sex-stratified fixed-effects longitudinal regression models. These methods accounted for lack of independence due to repeated measures from the same individuals. Fixed-effects models estimate the associations of time-varying covariates( Reference Allison 23 ) (i.e. energy intake, age, CFP and interactions between these variables). We could thus obtain a population mean of the within-infant associations of CFP on infant size. The more commonly used alternative to the fixed-effects longitudinal regression model is the random-effects model which estimates β coefficients for both fixed and time-varying covariates, yielding estimates based on both within-individual and between-individual associations. However, a key assumption of the random-effects model is that the individual observations have error terms that are not correlated with the independent variables. A Hausman test revealed that this assumption was violated in our sample and thus a fixed-effects or within-individual model was more appropriate( 24 ). Estimates were calculated using xtreg with the robust variance estimator in the statistical software package STATA 13.
We investigated three-way and two-way interactions between diet, age and energy intake from complementary foods. These interactions were explored since we hypothesized a priori that the effect of breast-feeding would wane with time, the effect of dietary diversity would increase as the infant grows and, as a consequence, the effect of non-breast-milk energy intake would also be time varying. We then used a Wald test to assess the null hypothesis that the β coefficients of a set of interactions were simultaneously equivalent to zero( 24 ). Product terms were retained provided this null hypothesis was rejected. Ultimately, we estimated WAZ with the following time-varying covariates: CFP, age, non-breast-milk energy intake, CFP×age, CFP×non-breast-milk energy intake, non-breast-milk energy intake×age, and CFP×age×non-breast-milk energy intake. The inclusion of age interactions allowed the effects of CFP and energy intake on WAZ to vary with time. The CFP×energy intake product term also added flexibility to the model, permitting the estimated association of a given CFP with WAZ to vary depending on the amount of energy consumed from complementary foods. Finally, the three-way interaction of CFP, energy intake and age allowed this CFP–energy intake association to vary over time. Similarly, only statistically significant covariates were retained when estimating LAZ, these covariates were: CFP, age, non-breast-milk energy intake, and non-breast-milk energy intake×age.
Predictions and post-estimation tests
The coefficients from the models were used to predict sex-specific LAZ or WAZ for infants with each of the four CFP throughout the weaning period. The mean energy intake values used in these predictions were specific for age, sex and breast-feeding status. Post-estimation Wald tests were conducted to determine whether the combined predicted associations of a given CFP were equivalent to those of a second CFP at each point in time( 24 ).
Sensitivity analyses
Four sensitivity analyses were conducted. First, we stratified by maternal education and socio-economic status and then re-evaluated these associations between CFP and infant size because it is plausible that the DDS–infant size association may be modified by socio-economic status. Second, we wondered whether dietary diversity primarily influenced infant size via increased energy intake and so we re-estimated the association of CFP with infant size using models that excluded non-breast-milk energy intake. Third, we questioned whether a weighted DDS may be a more informative predictor of infant size so we also constructed a weighted DDS using the weights from the World Food Programme’s (WFP) food consumption score. The weighted DDS had a maximum of 19 points and was equal to the sum of points given for consumption of staples (2 points), legumes (3 points), β-carotene-rich (1 point) and other fruits and vegetables (1 point), dairy (4 points), eggs (4 points) and animal flesh foods (4 points)( Reference Wiesmann, Bassett and Benson 25 ). This score was dichotomized as high (≥10) or low (<10). We then re-executed the analyses using the dichotomized, weighted score. Fourth, to explore whether infants’ size at the previous survey contributed to dietary diversity in the current survey (reverse causality), longitudinal regression models were executed using lagged infant size (LAZ and WAZ) as the predictor and the ordinal 7-point DDS as the outcome.
Results
Sample characteristics
At baseline, mothers had a mean age of 26·59 (sd 5·99) years, they were 150·55 (sd 7·53) cm tall and had received 7·52 (sd 3·72) years of education (data not shown). First-born infants accounted for 22·27 % of the sample. Mean birth weight and length of infants was 2·99 (sd 0·44) kg and 49·07 (sd 2·07) cm, respectively, and 11·49 % of the sample weighed <2·5 kg at birth. The sample was about 25 % rural. There were negligible differences in demographic characteristics by sex.
Correlation of dietary diversity score with nutrient intakes at 12 months
The DDS was modestly correlated with nutrient intakes in breast-fed and non-breast-fed infants at 12 months (Table 1). Correlations were attenuated substantially after adjusting for non-breast-milk energy intake: for example, the correlation of the DDS with protein intake in the breast-fed stratum decreased from 0·56 to 0·28 after energy adjustment. Correlations also differed substantially between breast-fed and non-breast-fed infants. For example, the energy-adjusted correlation between carbohydrates and the DDS was only –0·07 in the non-breast-fed group, much lower than the correlation observed in the breast-fed group (adjusted correlation=–0·31).
Table 1 Mean daily nutrient intakesFootnote * from complementary foods at 12 months at each level of the DDS and Pearson correlation coefficients for selected nutrients with the DDS, stratified by breast-feeding status, among Filipino infants, Cebu Longitudinal Health and Nutrition Survey
DDS, dietary diversity score.
* Values are presented as means and standard deviations for selected nutrients.
† Pearson correlation coefficients of the 7-point DDS with nutrient intake.
‡ Correlations were also calculated using energy-adjusted nutrient intake (nutrient intake/energy).
§ P>0·05; all other correlations had P<0·05.
Complementary food group consumption from 0 to 24 months
Trends in complementary food group consumption in breast-fed and non-breast-fed infants are displayed in Fig. 1. Aside from starches, only non-breast milk and animal flesh foods were consumed by more than half of the population at any given survey. Only a small proportion of the sample consumed eggs and other fruits/vegetables. Legumes, fruit and vegetables were consumed by fewer than 30 % of infants at any given survey. Prevalence of animal flesh consumption increased steadily for both strata, but this was generally higher in the non-breast-fed infants (~70 % v. 50 % in breast-fed at 24 months). Absolute prevalence of consumption of eggs and other fruits/vegetables was also higher in non-breast-fed infants.
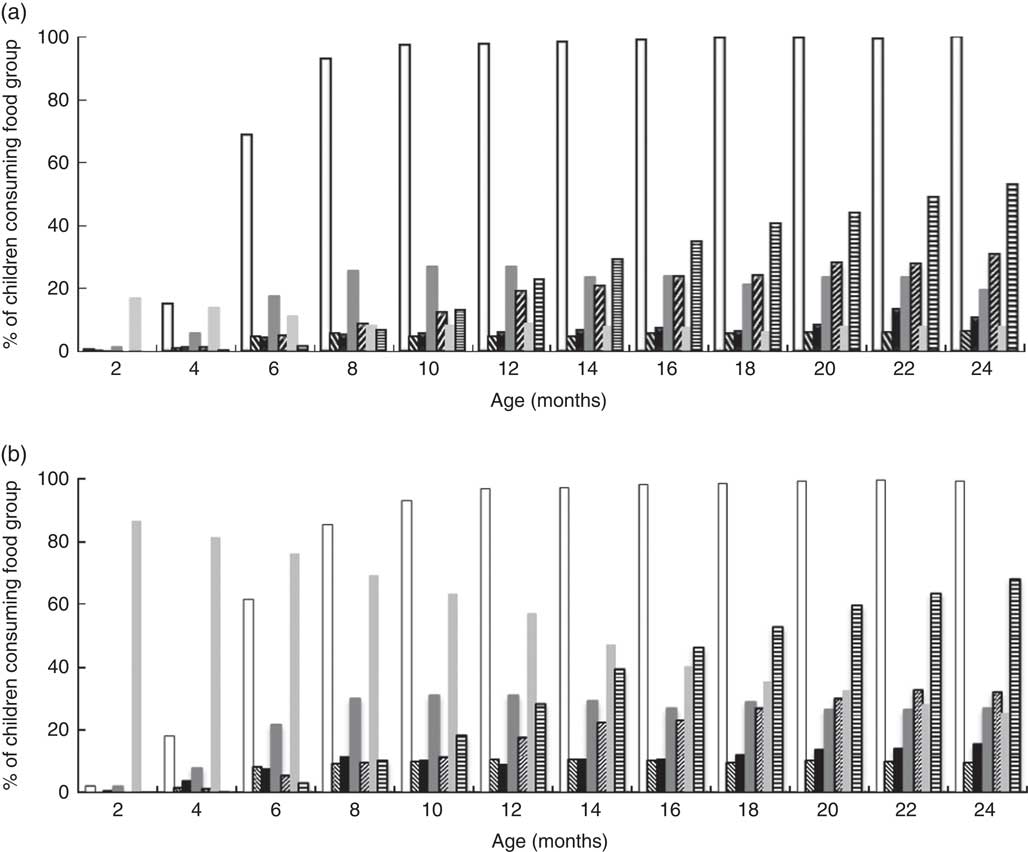
Fig. 1 Percentage of children consuming each food group (![]() , starches;
, starches; ![]() , eggs;
, eggs; ![]() , legumes, seeds and nuts;
, legumes, seeds and nuts; ![]() , other fruits and vegetables;
, other fruits and vegetables; ![]() , β-carotene-rich fruits and vegetables;
, β-carotene-rich fruits and vegetables; ![]() , non-human milks;
, non-human milks; ![]() , animal flesh foods), stratified by breast-feeding status (a, breast-fed; b, non-breast-fed), among Filipino infants aged 0–24 months, Cebu Longitudinal Health and Nutrition Survey. Sample sizes for each survey correspond to those shown in Table 2
, animal flesh foods), stratified by breast-feeding status (a, breast-fed; b, non-breast-fed), among Filipino infants aged 0–24 months, Cebu Longitudinal Health and Nutrition Survey. Sample sizes for each survey correspond to those shown in Table 2
Distribution of the complementary feeding patterns
The prevalence of the non-breast-fed low-DDS (referent) category increased from 23 % at 6 months to 66 % by 24 months (Fig. 2), while the prevalence of the breast-fed low DDS CFP decreased from 75 % at 6 months to 12 % by 24 months. The percentage of non-breast-fed infants with high DDS increased steadily over time. Percentage prevalence of the recommended feeding pattern (breast-feeding with high DDS) did not exceed 5 %.
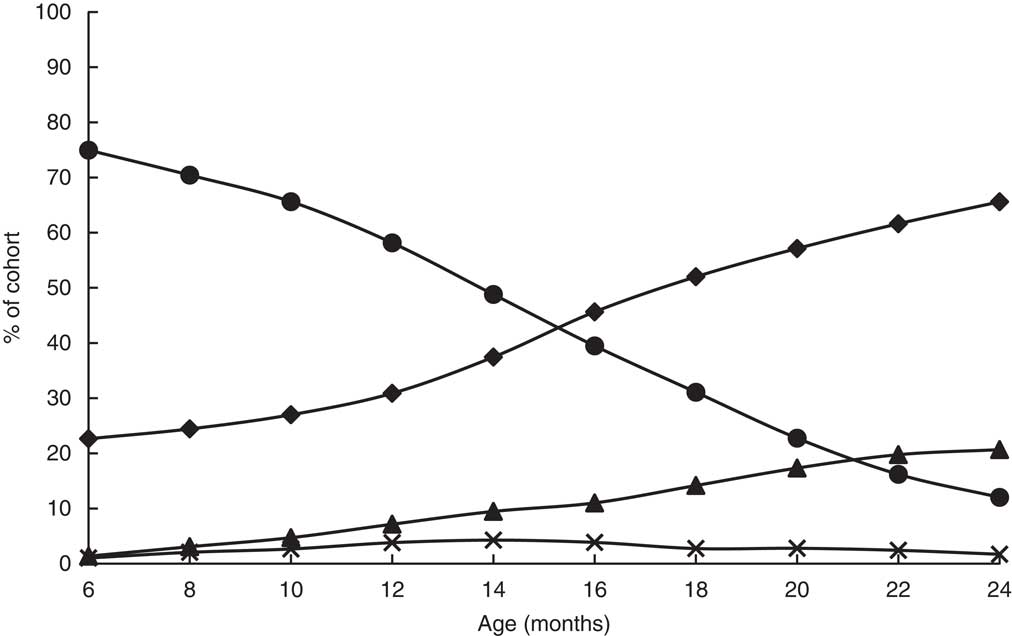
Fig. 2 Prevalence of complementary feeding patterns (![]() , non-breast-fed, low DDS;
, non-breast-fed, low DDS; ![]() , breast-fed, low DDS;
, breast-fed, low DDS; ![]() , non-breast-fed, high DDS;
, non-breast-fed, high DDS; ![]() , breast-fed, high DDS) among Filipino infants (n 2822) aged 6–24 months, Cebu Longitudinal Health and Nutrition Survey (DDS, dietary diversity score)
, breast-fed, high DDS) among Filipino infants (n 2822) aged 6–24 months, Cebu Longitudinal Health and Nutrition Survey (DDS, dietary diversity score)
Energy intake differed by breast-feeding status and sex
In both boys and girls at any given survey wave, breast-fed infants had significantly different quantities of energy from complementary foods when compared with their non-breast-fed peers (Table 2).
Table 2 Mean daily energy intakeFootnote * from complementary foods, stratified by breast-feeding statusFootnote †, among Filipino infants aged 6–24 months, Cebu Longitudinal Health and Nutrition Survey
* Values are presented as means and standard deviations in kilocalories; 1 kcal=4·184 kJ.
† Two-tailed t tests stratified by gender and survey wave revealed that for all survey waves, energy intake from complementary foods was significantly different in non-breast-fed infants compared with their breast-fed counterparts (P<0·0001).
Complementary feeding pattern and length-for-age
Breast-feeding (with high or low DDS) was positively associated with LAZ (Table 3). Energy intake and age were significant predictors of LAZ. There was an inverse association between age and LAZ. With an energy intake × age interaction in the model, the negative coefficient for the main effect of energy intake showed the inverse association of complementary food intake with LAZ at 6 months (baseline). The positive coefficient for the energy intake×age interaction term indicated that as the infants became older, there was a positive association of complementary energy with LAZ.
Table 3 Results of longitudinal regression* of LAZ v. four complementary feeding patterns among Filipino infants aged 6–24 months, Cebu Longitudinal Health and Nutrition Survey
LAZ, length-for-age Z-score; DDS, dietary diversity score; n/a, not applicable.
* Fixed-effects longitudinal regression models were stratified by sex (1488 boys and 1334 girls).
† β represents the coefficient for the estimated change in standardized length-for-age (LAZ).
‡ Age measured in months.
§ Energy intake measured in 4184 kJ (1000 kcal) units, estimated from all foods and liquids consumed excluding breast milk, as reported on 24 h dietary recalls.
When predicted LAZ was calculated using the results from the longitudinal regression, girls had higher Z-scores than boys at all ages. Breast-fed infants had greater predicted LAZ than non-breast-fed infants, regardless of dietary diversity or sex (Fig. 3). For example, at 6 months, boys who were breast-fed with low DDS were 0·25 (95 % CI 0·19, 0·30) sd longer than those in the referent group. The magnitude of this difference in LAZ decreased over time and was 0·16 (95 % CI 0·12, 0·21) sd at 24 months. A similar trend was observed in breast-fed girls with high DDS: the difference between this group and the referent group was 0·20 (95 % CI 0·12, 0·28) at 6 months, but narrowed to 0·10 (95 % CI 0·03, 0·17) sd at 24 months. Infants with the recommended CFP (high DDS and breast-feeding) were not significantly longer than breast-fed infants with low DDS (difference in LAZ=0·03 (95 % CI −0·03, 0·08) in boys and −0·02 (95 % CI −0·08, 0·03) in girls). Finally, non-breast-fed infants with high DDS were not longer than the referent group.
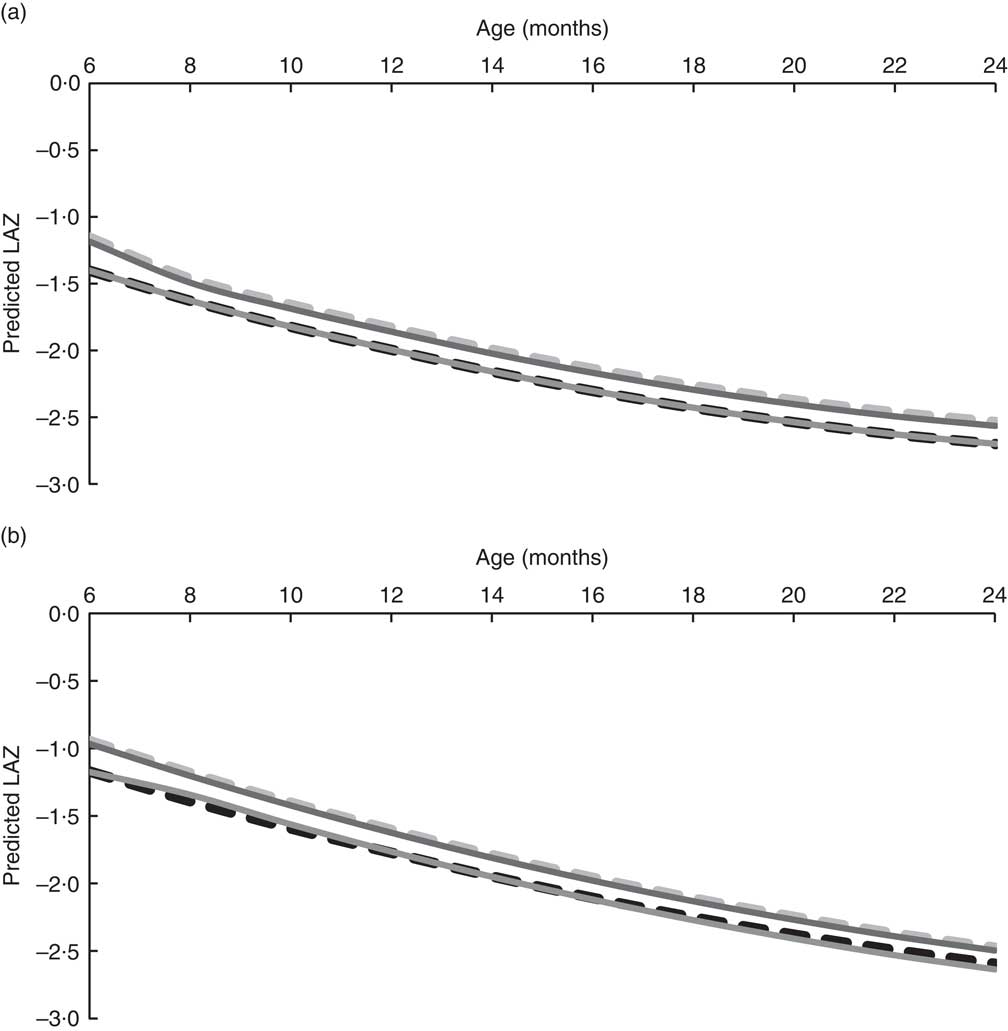
Fig. 3 Predicted LAZ for Filipino boys (a; n 1488) and girls (b, n 1334) aged 6–24 months by complementary feeding pattern (![]() , non-breast-fed, low DDS;
, non-breast-fed, low DDS; ![]() , breast-fed, low DDS;
, breast-fed, low DDS; ![]() , non-breast-fed, high DDS;
, non-breast-fed, high DDS; ![]() , breast-fed, high DDS), Cebu Longitudinal Health and Nutrition Survey. Predicted LAZ was calculated using the coefficients from the longitudinal regression analyses and mean energy intake from complementary foods (LAZ, length-for-age Z-score; DDS, dietary diversity score)
, breast-fed, high DDS), Cebu Longitudinal Health and Nutrition Survey. Predicted LAZ was calculated using the coefficients from the longitudinal regression analyses and mean energy intake from complementary foods (LAZ, length-for-age Z-score; DDS, dietary diversity score)
Complementary feeding pattern and weight-for-age
There were significant two-way and three-way interactions between CFP, age and energy intake (Table 4). Both breast-fed CFP were associated with greater WAZ, relative to the referent group of non-breast-fed infants with low DDS. The β coefficients associated with the non-breast-fed, high DDS CFP were never statistically significant. Age and energy intake were important predictors of WAZ. The coefficients for age were negative in both sexes, consistent with a decline in WAZ with age. As seen in the results for LAZ, energy intake was negatively associated with WAZ at 6 months in both sexes (given by the negative coefficient for main effects of energy intake), but as indicated by the energy intake×age interaction term, energy intake became positively associated with WAZ in older infants.
Table 4 Results of longitudinal regressionFootnote * of WAZ v. four complementary feeding patterns in Cebu infants among Filipino infants aged 6–24 months, Cebu Longitudinal Health and Nutrition Survey
WAZ, weight-for-age Z-score; DDS, dietary diversity score; n/a, not applicable.
* Fixed-effects longitudinal regression models were stratified by sex (1488 boys and 1334 girls).
† β represents the coefficient for the estimated change in standardized weight-for-age (WAZ).
‡ Age measured in months.
§ Energy intake measured in 4184 kJ (1000 kcal) units, estimated from all foods and liquids consumed excluding breast milk, as reported on 24 h dietary recalls.
Generally, girls had larger predicted WAZ than boys in the same age group and CFP (Fig. 4). In both sexes, breast-feeding was associated with a greater WAZ. For example, the post-estimation tests revealed that at 6 months, boys who were breast-fed with low DDS were 0·52 (95 % CI 0·45, 0·59) sd heavier than the referent group (data not shown). The difference in WAZ declined with age and was no longer significant by 20 months (difference in WAZ=0·05 (95 % CI −0·01, 0·10)). A similar trend was seen in breast-fed infants with high DDS: in the girls, the difference in WAZ at 6 months was 0·39 (95 % CI 0·21, 0·57) sd and this was reduced to a difference of 0·06 (95 % CI −0·04, 0·16) by 20 months. The post-estimation tests showed no statistically significant differences between breast-fed groups with high and low DDS. There were also no significant differences between infants with high v. low DDS within the non-breast-fed stratum.
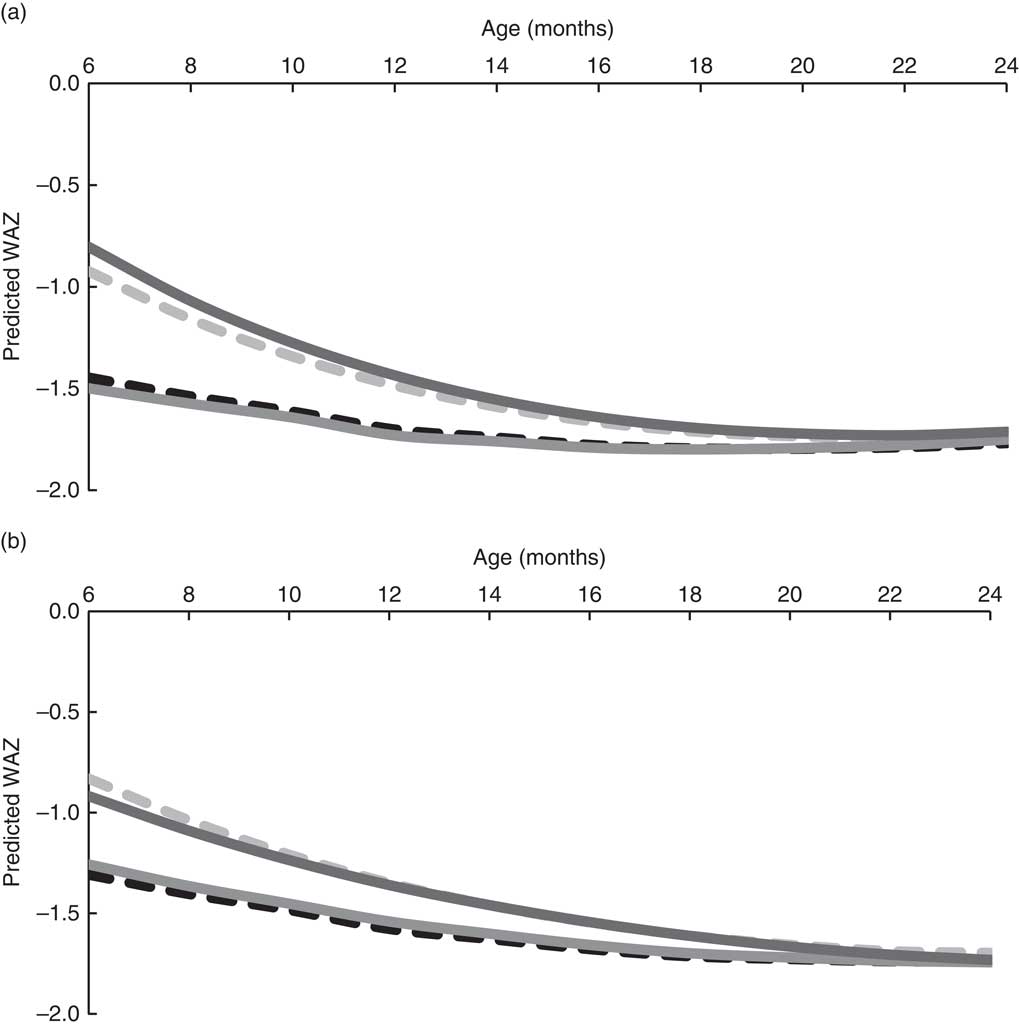
Fig. 4 Predicted WAZ for Filipino boys (a; n 1488) and girls (b, n 1334) aged 6–24 months by complementary feeding pattern (![]() , non-breast-fed, low DDS;
, non-breast-fed, low DDS; ![]() , breast-fed, low DDS;
, breast-fed, low DDS; ![]() , non-breast-fed, high DDS;
, non-breast-fed, high DDS; ![]() , breast-fed, high DDS), Cebu Longitudinal Health and Nutrition Survey. Predicted WAZ was calculated using the coefficients from the longitudinal regression analyses and mean energy intake from complementary foods (WAZ, weight-for-age Z-score; DDS, dietary diversity score)
, breast-fed, high DDS), Cebu Longitudinal Health and Nutrition Survey. Predicted WAZ was calculated using the coefficients from the longitudinal regression analyses and mean energy intake from complementary foods (WAZ, weight-for-age Z-score; DDS, dietary diversity score)
Sensitivity analyses
There was no apparent advantage to having high dietary diversity when analyses were re-executed within strata of socio-economic status or education. Moreover, removing energy intake from the model did not significantly alter inferences pertaining to high DDS. The WFP-weighted CFP did not predict infant LAZ or WAZ. Upon exploring the possibility of reverse causality, we found that a 1 sd gain in infant size increased the ordinal 7-point DDS by <1 point. This indicated that to some extent, infant size did predict the way the infant would be fed at a subsequent survey.
Discussion
We demonstrated that the WHO’s seven-food-group DDS was modestly correlated with nutrient intakes in this cohort of Filipino infants. Using longitudinal regression models to estimate the association of CFP based on scores of dietary diversity and breast-feeding status with LAZ and WAZ, we identified several interactions between age, energy intake and breast-feeding status. Breast-feeding was strongly associated with greater WAZ and LAZ but high dietary diversity conferred no significant advantage in infant size in our analyses.
The correlations between the DDS and nutrient intakes varied across strata of breast-feeding and the DDS was a better predictor of nutrient intake than nutrient density. Both intake and density are important for achieving nutrient adequacy, but nutrient density is particularly critical in infants since they cannot consume large quantities of food. The weak correlations with nutrient density make the score a poor proxy for diet quality in these infants. Associations between DDS and nutrient intake and density have been previously reported( Reference Moursi, Arimond and Dewey 4 , Reference Torheim, Ouattara and Diarra 7 , Reference Ruel 10 – Reference Kennedy, Pedro and Seghieri 12 ). However, we thought it important to display the unreliability of the score as a proxy for diet quality, particularly in light of other important predictors of infant health (i.e. energy intake and breast-feeding status).
We showed here that the DDS was useful for qualitatively describing the population trends in the timing of introduction of different complementary foods. However, although we could use this DDS to track changes in consumption of the seven complementary food groups, consumption of other important food groups may have been missed. For example, vitamin C-rich plant foods or leafy greens were subsumed in the other fruits and vegetables category, so the trends in consumption of these smaller groups could not be seen. For descriptive purposes, such dietary indices may be more informative if more food groups are included.
Our longitudinal analyses revealed interesting sex differences in infant size. Variations in the incidence of stunting and underweight have previously been reported in this and other cohorts based in Cebu( Reference Adair and Guilkey 26 , Reference Ricci and Becker 27 ). A previous study found that male infants in this cohort are fed differently and have higher prevalence of diarrhoea( Reference Adair and Guilkey 26 ). We found that although the relative associations of CFP were similar in both sexes, absolute predicted LAZ and WAZ were noticeably greater in girls. Furthermore, it seems that responsiveness to this ‘optimal’ pattern varied by sex: only males had significant two- and three-way interactions in the breast-fed, high DDS CFP, which suggests that the associations of this CFP with WAZ are modified by age and energy intake to a greater extent in boys. This may be partially explained by the documented sex differences in feeding and morbidity in this cohort.
The findings demonstrated the age-dependent association of complementary food energy with LAZ and WAZ throughout the weaning period. With the age×energy interaction term in the model, the main effect coefficient represents energy intake in 6-month-old infants. The negative main effects coefficient suggested that at this baseline age, high consumption of complementary foods was detrimental for growth. The interaction term shows that this inverse association weakened and became positively predictive of growth as the infants became older. Complementary feeding is inappropriate in younger infants (i.e. infants 6 months of age and younger) as it potentially introduces pathogens that increase diarrhoea risk, thus reducing potential for growth( Reference Kramer and Kakuma 15 , Reference Brown, Dewey and Allen 18 ). Furthermore, an infant with higher intake from complementary foods is likely consuming less breast milk, as we demonstrated in Table 3. Less breast-feeding, particularly at a young age, will result in poorer growth. These results are congruent with a previous study in this cohort that showed a strong increase in probability of diarrhoeal morbidity in mixed-fed infants <8 months of age, relative to exclusively breast-fed peers( Reference Popkin, Adair and Akin 17 ). Altogether, we believe that the adverse effects highlighted by our regression analyses are due to the combined impact of reduced breast milk and increased diarrhoeal morbidity brought on by complementary feeding, both of which potentially limit LAZ and WAZ( Reference Adair, Popkin and VanDerslice 28 ).
Many studies have highlighted positive associations of different scores of dietary diversity with infant LAZ or WAZ in a variety of settings( Reference Onyango, Koski and Tucker 6 , Reference Chua, Zalilah and Chin 8 , Reference Sawadogo, Martin-Prével and Savy 9 , Reference Jones, Ickes and Smith 29 – Reference Alvarado, Zunzunegui and Delisle 31 ) but we found no evidence that high DDS improved infant nutritional status in our study. This null finding was not due to energy adjustment since when we re-estimated LAZ and WAZ without energy intake in the model, the P values for non-breast-fed and high DDS did not achieve statistical significance. Stratification by socio-economic status/maternal education also did not affect our final inference regarding the DDS.
One proposed reason for the null finding is that the WHO’s DDS does not acknowledge the differential contribution of certain food groups to infant nutrition. In contrast, rather than assigning equal weights to each food group, the WFP food consumption score weights food groups differently. For example, the WFP’s score weights consumption of animal flesh foods more heavily than that of plant foods( Reference Wiesmann, Bassett and Benson 25 ). One study based on a cohort of Mozambican adults found that their weighted food score was a better predictor of household energy consumption( Reference Rose, Chotard and Oliveira 32 ). As a sensitivity analyses, we applied the requisite WFP weights to each of the seven food groups in the WHO score. Overall, there still appeared to be no advantage to having high weighted-DDS. However, within non-breast-fed infants, the high weighted-DDS CFP had a small estimated impact on boys’ LAZ that approached statistical significance (β=0·03, P=0·06). The DDS can only crudely approximate food group consumption since it does not include FFQ. Even with the imposed 10 g threshold and WFP weights, the misclassification that is inherent in the DDS might make it less predictive of nutrient intake and ultimately a weak predictor of growth.
It is plausible that previous literature on the association between dietary diversity and infant size was largely influenced by reverse causality. Intriguingly, one study in a Senegalese cohort found associations between their DDS and LAZ but their longitudinal DDS, a cumulative summary of previous and current dietary diversity, showed no association with linear growth( Reference Bork, Cames and Barigou 33 ). We therefore explored whether our finding was potentially due to reverse causality and found evidence that larger infants are fed more diverse diets at subsequent surveys. This is not surprising: feeding decisions may be based on perceptions of how the baby is faring. A mother may decide to alter (or continue) her feeding behaviour to promote growth. This presents a tremendous methodological challenge in the bid to analyse associations between diet quality and infant growth. We have attempted to do this here with the use of sophisticated fixed-effects methodology and our results show that within the context of our cohort, this DDS was a poor predictor of infant size; current breast-feeding status was a much better indicator of growth.
A major strength of our study is the rigorous methodology that we employed to incorporate the interactive impact of dietary exposures throughout the weaning period. By accounting for age×energy intake interactions we could elucidate the negative impact of higher intake of complementary foods in 6-month-old infants. As we hypothesized, the associations of breast-feeding, particularly with WAZ, were greatest at 6 months and decreased over time. In the case of estimating LAZ, the benefits of breast-feeding persisted throughout the entire weaning period.
The fixed-effects models and longitudinal study design facilitated the investigation of causality( Reference Allison 23 , Reference Firebaugh, Warner and Massoglia 34 ). Nearly 80 % of infants had been exposed to at least two CFP and so in some ways the analytical design used here may be likened to that of a case-crossover trial in which the majority of infants experienced more than one ‘treatment’ or CFP. The models allowed infants to serve as their own controls and thus we could isolate the net associations of changing CFP while reducing the obscuring associations of time-constant confounders. To our knowledge, only one other study has utilized longitudinal regression models for testing the joint associations of breast-feeding and the diversity of the complementary diet with infant size( Reference Alvarado, Zunzunegui and Delisle 31 ). The authors used food consumption scores to predict infant size in a small Afro-Columbian cohort of 133 infants( Reference Alvarado, Zunzunegui and Delisle 31 ). They also found that their food consumption score was not significantly associated with linear growth or weight gain( Reference Alvarado, Zunzunegui and Delisle 31 ). We believe that ours is the first study in such a large cohort that has analysed the associations of dietary diversity and breast-feeding with infant growth. Ideally, we would have randomized infants to the four CFP in order to estimate the causal effects of diet on growth but such a study would be unethical and impractical. The fixed-effects method thus allowed us to make excellent use of the longitudinal, observational data and yielded sound inferences regarding the associations of CFP with growth in this population of infants.
There are limitations in our study. First, we did not explicitly estimate the contribution of time-constant confounders (e.g. maternal education) but assumed that they were constant contributors to growth throughout the period. However, we reiterate that the estimation of time-constant confounders was not necessary since we were primarily concerned with the relationship of CFP to growth. Second, because the DDS was only modestly correlated with nutrient density, the null findings may be due to the shortcomings of the DDS used and do not necessarily indicate that dietary diversity does not predict growth. It is plausible that high DDS may confer a benefit in other populations.
Appropriate complementary feeding is critical to infant growth. Breast-feeding was shown to be an excellent predictor of infant nutritional status in this population. Additionally, we found that breast-feeding status and energy intake altered the correlation of the DDS with nutrient intake, and our quantitative analyses indicated no significant contribution of a high dietary diversity to infant size. The DDS has potential for qualitative information on diet composition in infants. Identification of several statistical interactions revealed the importance of longitudinal designs and sound methodology for analysing this dynamic period. Future studies should aim to improve characterizations of the quality of the complementary diet since dietary exposures in this vulnerable weaning period can have far-reaching consequences for morbidity in infancy and beyond( Reference Bhutta, Ahmed and Black 2 , Reference Victora, Adair and Fall 35 , Reference Black, Allen and Bhutta 36 ).
Acknowledgements
Acknowledgements: The authors thank Dr A. Herring, Dr C. Zimmer, F. Dong and E. Tzioumis for their assistance. Financial support: This project was supported by an educational grant from Wyeth Nutrition Innovation Collaboration (grant number 7D6-N-3146291). The Carolina Population Centre (grant number R24 HD050924) provided general support. The funders had no role in the design, analysis or writing of this article. Conflict of interest None. Authorship L.S.A. and M.J.W. conceived and designed the study; L.S.A. provided the databases necessary for the research; M.J.W. performed statistical analysis; M.J.W. and L.S.A. wrote the paper; M.J.W., M.A.M., M.E.B. and L.S.A. contributed to the interpretation of results; M.E.B. and L.S.A. had primary responsibility for the final content; all authors read and approved the final manuscript. Ethics of human subject participation: All procedures involving human subjects were approved by the Institutional Review Board for the Protection of Human Subjects of the University of North Carolina, School of Public Health.


