


Introduction
Sea-ice motion is important for understanding climate processes at the sea-ice-atmosphere-ocean interface. Differential ice motion determines the extent of open water within the ice pack, which in turn greatly influences local sensible and latent heat exchange with the atmosphere, the rate of new ice production, brine production within lite surface layers of the ocean, and ice ridging and thickness distribution. On longer time-scales, sea-ice motion determines the rate that sea ice is advected out of the Arctic Basin through Fram Strait and into the Canadian Archipelago, and is therefore important in sea-ice budget studies of the Arctic Ocean. This is also important in determining the rate of freshening in the North Atlantic and the intensity of thermohaline circulation in the global ocean (Reference Aagaard and CarmackAagaard and Carmack, 1989).
The 85.5 GHz channels on the Special Sensor Microwave Imager (SSM/I) historically have not been used much for estimating large-scale geophysical properties of sea ice (Reference Steffen and CarseySteffen and others, 1992) because of the high attenuation of surface microwave emissions due to atmospheric moisture and liquid water. During winter over the Arctic Basin, atmospheric moisture is typically low and atmospheric attenuation is not a serious problem. As a result, the higher pixel resolution of 85.5 GHz imagery, compared to lower frequency channels, can be used to observe the sea-ice surface. It turns out that at pixel resolutions of 12.5 km, large multi-year ice floes and large leads that form over the Arctic Basin can be resolved. Animation of daily SSM/I imagery over periods of several months to several years has been conducted, and the results reveal a dynamic behavior of the sea-ice pack not previously observed.
To quantify the ice motion seen in the animation, an image-matching technique using maximum cross correlations (MCC) in windowed portions of the two images was used. Several authors developed this method of matching locations between pairs of images: Reference Ninnis, Emery and CollinsNinnis and others (1986) first described an automatic technique using maximum cross correlation between sequential images in windowed portions of AVHRR images; Reference Emery, Fowler, Hawkins and PrellerEmery and others (1991) applied the technique to estimate ice motion in Fram Strait; Reference Filey and RothrockFiley and Rothrock (1987) applied a similar technique to image pairs from a Synthetic Aperture Radar (SAR); and Reference Hirose, Heacock, Lee, Manore, Franklin, Thompson and AhernHirose and others (1991) further refined and automated the technique. This paper is the first attempt to apply the technique to coarse resolution 85.5 GHz SSM/I imagery to obtain motions over the entire Arctic Basin for a contiguous two month period. The accuracy of 85.5 GHz SSM/I-derived ice motions is evaluated by comparing results with Arctic drift buoys.
Data and Methodology
The SSM/I daily average data were obtained on CD-ROM from the National Snow and Ice Data Center (NSIDC, 1991). Each daily image is a mosaic of the 14.1 orbits that occur over the 24 hour period (midnight to midnight GMT). Each orbit has a swath width of 1394 km resulting in considerable overlap over the Arctic Basin during any 24 hour period. Because the satellite orbit is tilted away from the North Pole axis, there is a circular region 280 km in radius where no data is collected. The method of binning different orbital brightness temperatures into the 12.5 km SSM/I grid is described in NSIDC (1996).
For comparison with the buoy data, the analysis carried out in this paper assumes that each 12.5 km pixel in the daily mosaic represents the average brightness temperature over this 24 hour period valid at 1200 h GMT each day. This is generally a sound assumption but for individual cases it creates small timing errors over the Arctic Basin (discussed later). Several years of imagery were animated and a two month period (December 1993 and January 1994) was selected on the basis of strong ice motion in the Arctic Basin and relatively good Arctic buoy coverage. Only horizontal polarized SSM/I imagery was analyzed for ice motion, because it gave a better image contrast than the vertical polarization. A neighbor-substitution algorithm was applied to the original CD-ROM product from NSIDC to correct for occasional missing pixels and poor scan lines. No filtering or removal of cloud was conducted and a land mask was applied to the imagery before ice-motion analysis was carried out on image pairs.
Details of the maximum cross correlation (MCC) technique are described in Reference Ninnis, Emery and CollinsNinnis and others (1986) and Reference Emery, Fowler, Hawkins and PrellerEmery and oothers (1991), and therefore will not be described in this paper. The technique, as developed in this application, is contained in a completely automated software package called Tracker developed by Reference Hirose, Heacock, Lee, Manore, Franklin, Thompson and AhernHirose and others (1991). Tracker software has been applied to a variety of satellite imagery, including ERSI SAR, NOAA AVHRR, and RADARSAT SAR. For application to the SSM/I 85.5 GHz imagery, a 7 × 7 pixel search window for calculating cross correlations was used, and an estimate of ice displacement between images was performed roughly every 6 pixels (75 km). Displacement vectors were checked for consistency with surrounding displacement vectors. The estimated ice displacements were then interpolated to the nearest buoy using quintic interpolation of the three closest estimates, and that interpolation then compared to buoy drift.
The buoy data were obtained from the International Arctic Buoy Program established by the Polar Science Center, University of Washington (Reference Thorndike and ColonyThorndike and Colony, 1980). Figure 1 shows the location of most of the buoys used in the study, with the Argos identification number, and buoy-drift during the two month study period. Problem buoys such as those that became caught in the land-fast ice around the cluster of small islands of Franz Josef Land just north of the Barents Sea, were removed from the study. Strong ice motions were estimated in the vicinity of these islands, which were too small to be resolved in the imagery. Buoys which were caught in the land-fast ice off the islands reported no motion for the two month period. The Argos buoy numbers and their latitude/longitude locations are shown in Table 1. All buoys, except number 1108, are near the small islands of Franz Josef Land. Buoy 1108 was probably in the Beaufort Sea area, and only intermittently reported its location (quite often reporting the same location for several weeks at a time). Buoys 3291, 1874, 1795,1796, 1108 and 1788 were removed from the study. This left <400 validation comparisons with the buoy data, and most of these validations were in the western Arctic Basin (the Beaufort, Markarov and Amundsen basins). There were usually 15–20 buoys unevenly distributed over the Arctic Basin at any one time. There were 25 image pair runs in the two month period, and most were separated by 3 or 4 days except for run 22, which was separated by 2 days and run 2, which was separated by 5 days (Table 2). No pre-selection of the images was conducted to remove the occasional day when orbital coverage of the Arctic Basin was poor.
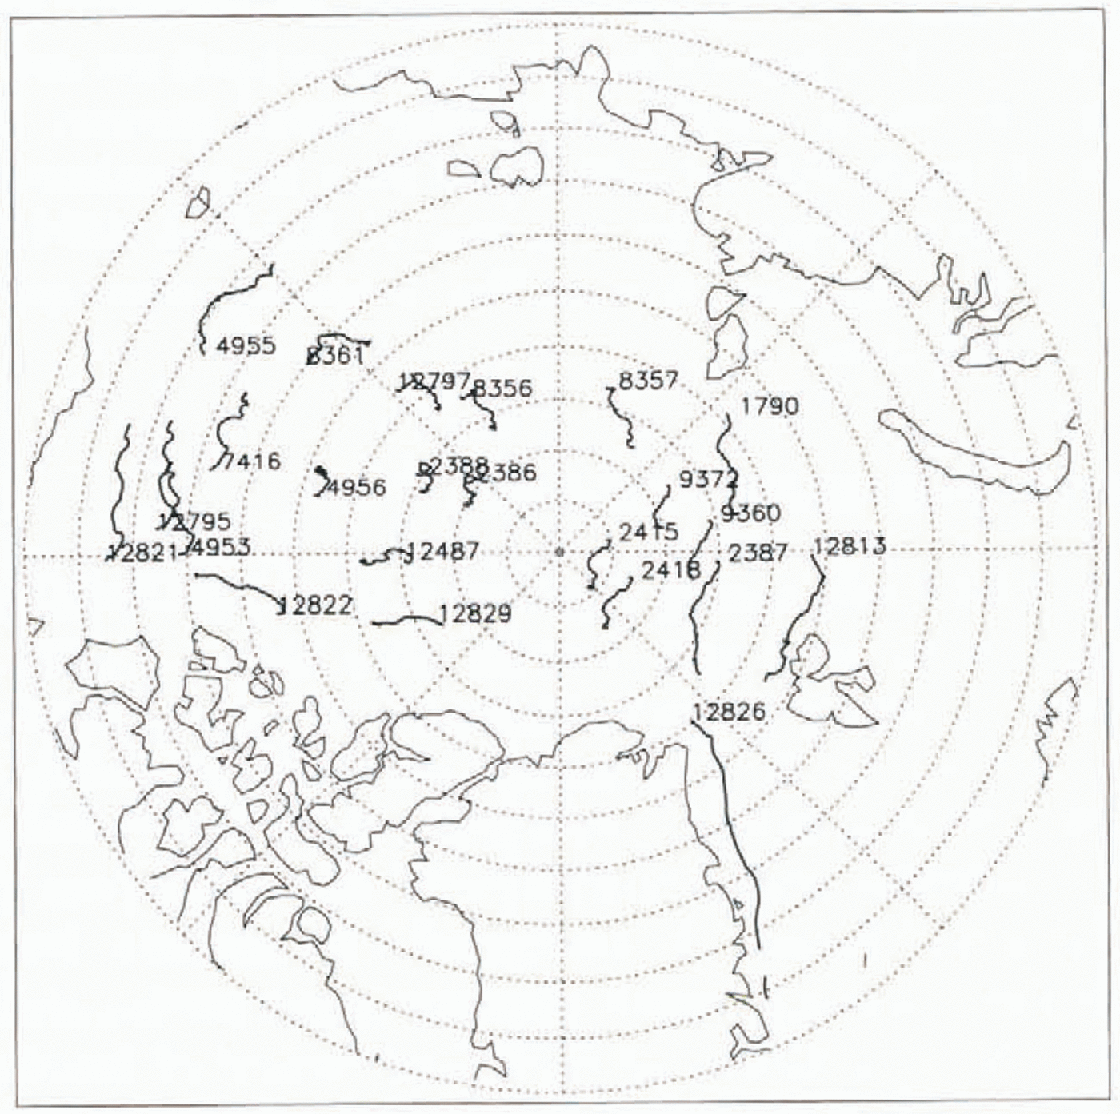
Fig. 1. Observed buoy drift tracks for December 1993 and January 1994.
Table 1. Location of defective buoys or buoys caught in land-fast ice
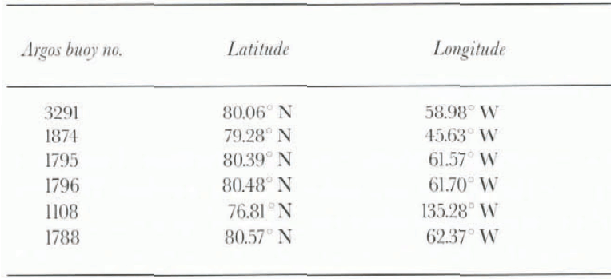
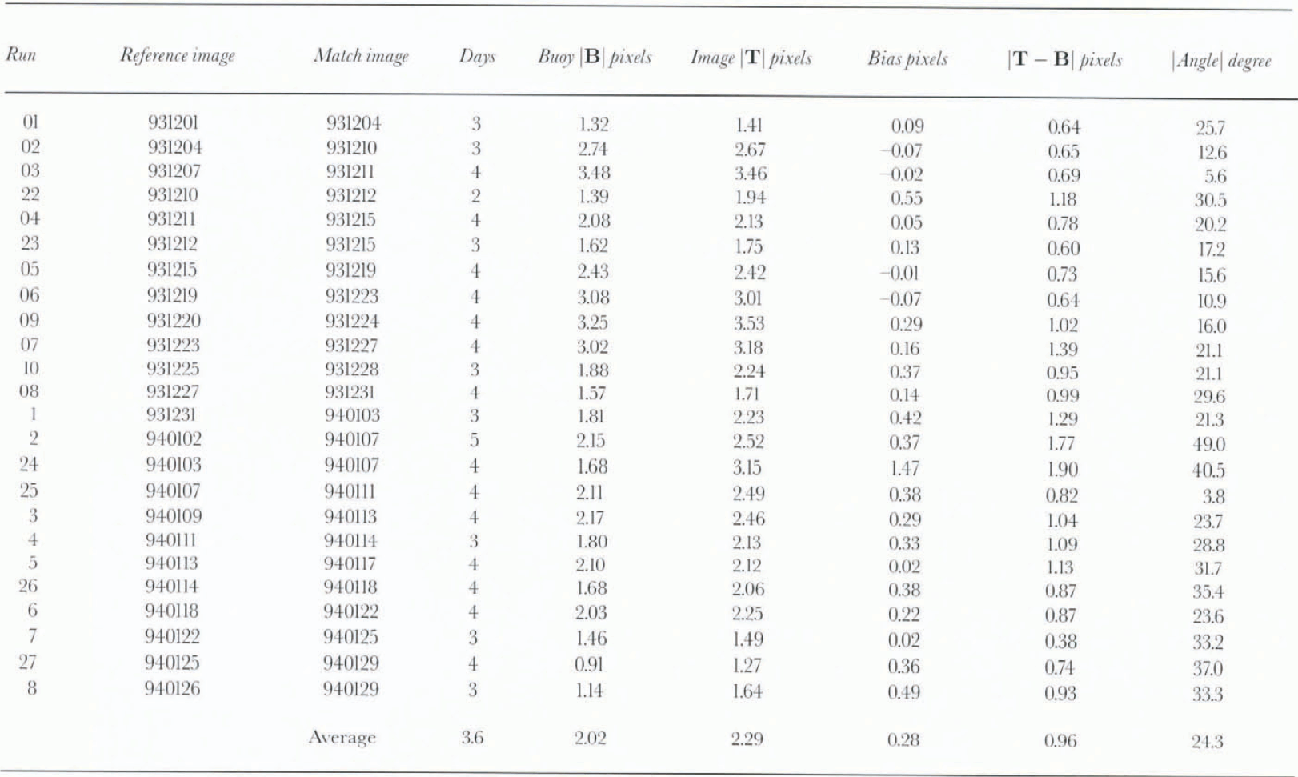
Table 2. Summary statistics comparing image-matching and busy-estimated mean ice motions for the 2 month study period
As outlined by Reference Holt, Rothrock, Kwok and CarseyHolt and others (1992), there are two main sources of error in measuring ice displacement between images A and B: the geographic position error e g of each image pixel and the tracking error e t which is the uncertainty in identifying common ice features in the second image. The tracking error applies to a displacement observed between two images. Including errors, the displacement (s) of an ice feature is:
If e g is assumed uncorrelated between images, and e g and e t are Gaussian with zero mean and std dev. σ g and σ t, the error in s will have zero mean and a variance of:
Geolocation accuracy for the SSM/I is ±8km (NSIDC, 1996) and, estimating the tracking error to be no better than the pixel resolution, we have σ g = 8 km and σ t = 12.5 km, which gives a value of 16.8 km for σ g. The error in velocity is σ s divided by the time interval between the images. In this application the time separation between images is typically 4 days, producing a velocity error estimate of 4.2 km d−1. The error can be improved by increasing the time interval between images. This however would reduce the time resolution, and increase tracking errors by providing more time for surface features to be modified and/or be distorted.
This error estimate ignores timing errors that arise from the assumption that all pixels in the daily images are valid at 1200 h GMT. The first timing error effects the time interval between images. Because there are 14.1 orbits d−1, there is a 0.1 of an orbit advance each day. This will effect the mean time interval between daily images by as much as 0.1/14.1 − 24 h = 0.17 h. This is equal to about a 3% error. Assuming a mean ice velocity of8 km d−1 produces an error estimate of ± 0.24 km d−1.
The second timing error occurs in the representative GMT time for individual pixels around the Arctic Basin. As one moves around the Arctic Basin, individual pixels will be composed of different orbits the average time of which may be as much as 6 hours away from 1200 h GMT. If it is assumed that this is the same for both the reference and the matched image, then the displacements may be valid as much as 6 hours away from 1200 h GMT. To estimate the random error in velocity that this might produce, a knowledge of the autocorrelation function (μ) and natural variance (σN2) of ice motion is required. Reference Thorndike and UntersteinerThorndike (1986) estimates σN2 to be 37 km2 d−2 (50 cm2 S−2) and the autocorrelation function to be 0.9 after 6 hours. This produces an estimated error variance of σ2N2 × (1 − μ) = 37 km2 d−2 × (1−0.9) = 3.7 km2 d 2 or a velocity error of ± 1.9 km d−1. Combining these error estimates produces an overall error of 4.6 km d−1. Comparison with buoy data in the results section will show that actual errors are lower than this estimate, but with a slight bias towards overestimation. (Error in buoy locadons is ±0.3 km, which is negligible).
In addition to these errors, there are errors introduced by the validation procedure resulting from (a) interpolating image estimates of ice displacement to buoy locations and (b) differences in location of the buoy within the start location of a gridcell.
Results
Table 2 shows the run number, the reference and the matched image dates along with error statistics comparing the vector displacement of the buoy (B) and the vector displacement estimated between image pairs (T). The average bias (∣T∣ − ∣B∣) for all the data was 0.28 pixels (3.5 km), which is 14% of the average buoy displacement. The average vector error magnitude was 0.96 pixels (12 km) and the average absolute angle error was 24.3°. Since the average separation between images is 3.6 days for the 25 runs, these pixel errors correspond to a speed bias of 1 km d−1 (1.16 cm s−1) and vector magnitude error in velocity of 3.5 km d−1 (4.0 cm s−1). Figure 2 is a scatter plot of the estimated displacement vs buoy displacements for all 391 comparisons. The correlation coefficient is 0.75 and the x axis intercept is 0.53 of a pixel.
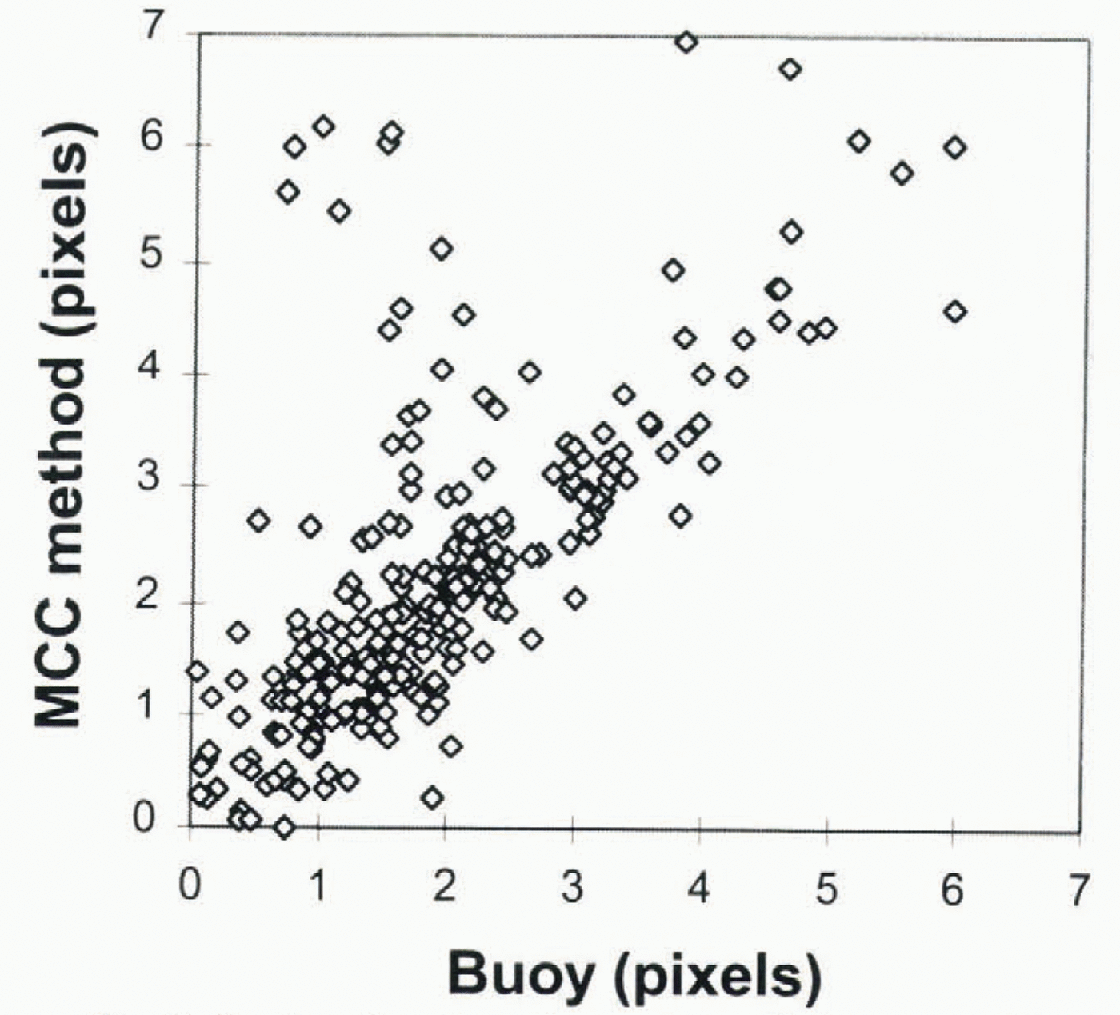
Fig. 2. Scatter plot of tracker vs buoy displacement. 391 comparisons were made.
The tendency for the image-matching technique to over-estimate by 14% when compared to the buoys is likely to be due to the increased probability of incorrect matches occurring at larger, rather than smaller, displacements than those recorded by the buoys. This is because the number of pixels equal to or less than the actual displacement for a given observation is considerably less than the number of pixels greater than the displacement. Therefore the probability of an incorrect match occurring at larger displacements is higher. This type of error is difficult to correct, but the best method has more stringent criteria for consistency. The distribution of angle errors (not shown) is broad with the most extreme angle errors occurring for weak motions when large pixel size leads to coarse angular resolution for small displacements. For example, the angular measurement accuracy for a 1 pixel displacement is 45° compared to a 15° accuracy with a 3 pixel displacement. An examination of specific runs showed that the technique had problems in tracking motion in the Marginal Ice Zone (MIZ), especially in the north Greenland Sea, as found by other studies (Reference Holt, Rothrock, Kwok and CarseyHolt and others, 1992). This is not surprising since the MIZ is a region of large change and deformation over 3−4 day periods, which separate image pairs in this study.
These error statistics are not as good as results obtained with AVHRR imagery, which is to be expected since SSM/I pixel size is more than ten times larger and geolocation accuracy is not as good. For comparison, Reference Emery, Fowler, Hawkins and PrellerEmery and others (1991) obtained a bias of 0.5cms −1 using 1.1km resolution AVHRR imagery, and a standard deviation of 0.9 cm s −1 for a 5 day period. Our study was for a longer two month period and results are verified against buoy data over a large part of the Arctic Basin, rather than just the area of Fram Strait.
Overall, ice motions extracted from SSM/I imagery are good in the majority of comparisons with the buoy data, but occasional overestimation of displacement is a problem. It should be kept in mind that there was no pre-screening of the cases to select the best images for testing the technique. Detailed motion over the Arctic Basin for run 03(image pairs for 7 and 11 December 1993) and run 5 (image pairs for 13 and 17 January 1994) are described below.
7-11 December 1993 Case Study
During mid December 1993, 85.5 GHz SSM/I animation revealed an almost basin-wide shift in the ice pack between the Canadian Arctic islands and the Siberian side of the Arctic Basin. The main cause was a strong southwesterly gradient over the Beaufort and Chukchi Seas, caused by an intensifying cyclone over Alaska, combined with an anticyclone over the North Pole region. By 8 December, the gradient extended across the western half of the Arctic Ocean and remained there for several days. The basin-wide shift in the pack is evident in the ice displacement vectors estimated from SSM/I image pairs for 7 and 11 December shown in Figure 3. The 4 day ice-motion vector displacements from the buoys are in red, and vector displacements using the MCC technique are in yellow. The small square marks the beginning of the displacement vector. The large circular region centred over the North Pole is the data-void region of the sensor (see data and methodology section). In the background is a false-color SSM/I image for 7 December, obtained by combining the vertical polarization channel in blue with the horizontal channel in red and green. This produced a false-color image dominated by blue over open ocean, and various shades of grey over ice-covered parts of the image. Lighter shades of grey indicate younger first-year ice.

Fig. 3. 4 day ice-motion vectors for 7–11 December 1993. The small square marks the beginning of the displacement vector. Buoy motions over the period are showed in red.
The shift in the ice pack covers almost the entire western half of the Arctic Basin. Motion vectors over the eastern half of the Arctic Basin are not present because the matched SSM/I image for 11 December had missing orbital data. The average displacement in the scene is 3.46 pixels (Table 2, run 03). The average buoy displacement in pixels is 3.48 which, over the 4 day period, corresponds to an average ice motion of 10.8 km d −1 (12.5 cms−1) and is the largest motion measured by the buoys during the two month period.
This shift in the ice pack towards the Siberian side of the Arctic exposed a large area of open ocean off Banks and Prince Patrick Islands as wind stresses forced the ice pack offshore. The AVHRR infrared image of the area for 12 December (Fig. 4) shows a very wide lead down the west sides of Banks and Prince Patrick Islands, and in McClure Strait caused by the motion of the pack offshore. These areas refroze rapidly, but remained visible in the SSM/I imagery as young first-year ice (high brightness temperatures) for several months and predisposed the region to rapid melting during the spring breakup.

Fig. 4. AVHRR infrared image of 12 December 1993.
13–17 January 1994 Case Study
During mid January 1994, SSM/I animation indicated that ice motion in the Beaufort Gyre was very strong. Figure 5 shows ice-displacement vectors estimated From SSM/I for the 4 day period 13–17 January 1994 (run 5). The background image is an SSM/I false-color image for 13 January. The strong anticyclonic circulation of the Beaufort Gyre is apparent as well as large ice motion in Fram Strait. The surface map for 15 January 1994, 1200 h GMT (not shown) indicates a very intense anticyclone circulation over the Canada Basin/Beaufort Sea area and a pressure gradient over the north Greenland Sea. The average displacement from the buoys is 2.10 pixels (Table 2), which corresponds to an average motion of 6.5 km d−1. The average motion using image matching is 2.12 pixels at the buoy locations.
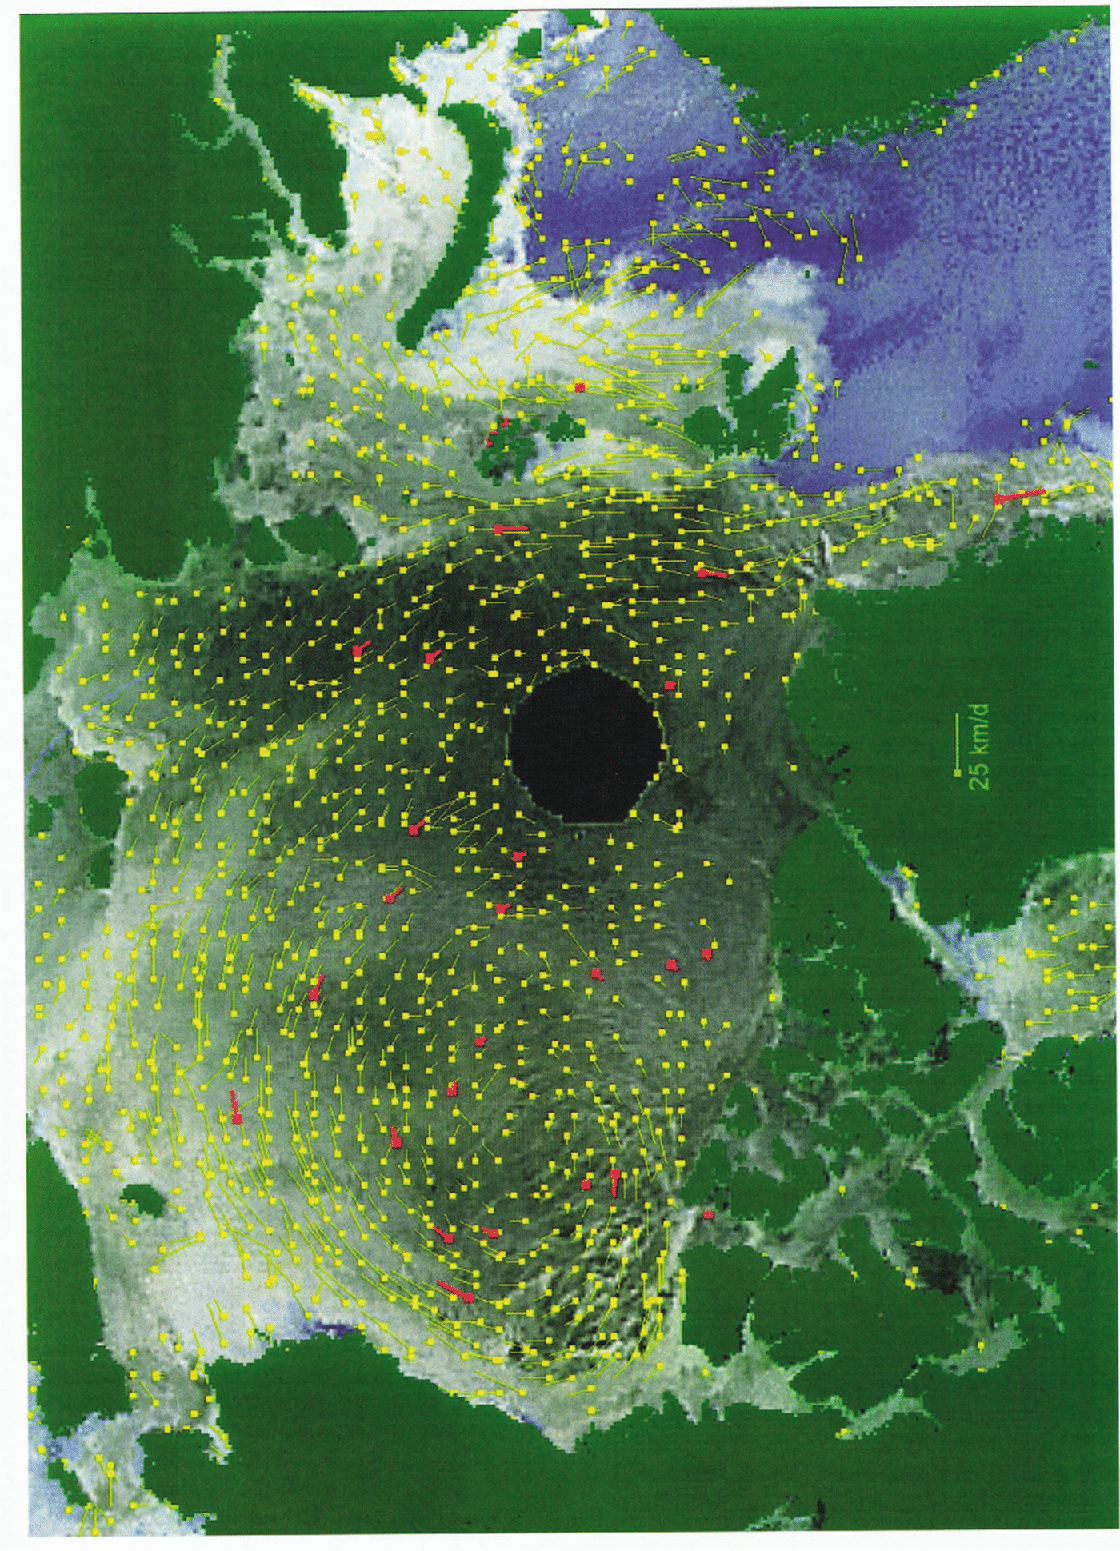
Fig. 5. 4 day ice-motion vetors for 13–17 January 1994. The small sqaure marks the beginning of the displacement vector. Buoy motions over the period are showed in red.
Both these cases indicate that the 4 day motion vectors are consistent with atmospheric pressure patterns and compare well with Arctic buoy motions. The SSM/I data show-considerably more detail in the motion than is possible from sparse buoy coverage over the Arctic Basin.
Conclusions
This paper demonstrates that daily average 85.5 GHz SSM/I imagery provides important information on the dynamic behavior of sea ice, especially sea-ice motion and the identification of extreme ice-motion events. Although surface ice information is coarse and noisy, MCC methods of detecting motion between pairs of images appear to be successful in detecting ice-motion information. As pointed out by Reference Ninnis, Emery and CollinsNinnis and others (1986), MCC is the optimal method for detecting translational motion between noisy images, and this is perhaps the main reason for its success. The daily SSM/I imagery average out random errors in geolocation and timing over the Arctic Basin, which would have to be accounted for in individual swath data. Preliminary results (not discussed in this paper) suggest that using individual swath data with radiometric correction and better geolocation docs not significantly improve the comparison with Arctic buoy data. Attenuation due to atmospheric liquid water restricts use of the 85.5 GHz channels to late fall, winter and early spring.
Comparison statistics were good. However the MCC technique tends to produce a 14% bias in the estimated motions compared to buoy drift This 14% overestimate is likely to be due to increased probability of incorrect matches occurring at larger rather than smaller displacements than those recorded by the buoys. Improved consistency-checking procedures may be able to correct this bias. The technique worked best during periods of strong ice motion within the Arctic Basin but had difficulty in estimating motions in the MIZ, especially in the north Greenland Sea where ice deforms much more rapidly. This is consistent with other studies.
Ice-motion detection using SSM/I 85.5 GHz imagery compliments other types of imagery, such as SAR and AVHRR, in that it can provide large aggregate-scale ice-motion information over time periods of months to years. Except for the summer months, it should be possible to produce a large-scale ice-motion dataset over the Arctic Basin every 4 days from mid 1987 to the present, using the 85.5 GHz SSM/I data. These data would provide much more spatial detail than is Currently available from buoy data, and would be useful in sea-ice budget studies of the Arctic Basin and in sea-ice model validation. The combination of 85.5 with lower frequency SSM/I data to estimate geophysical properties oi sea ice should also be pursued.
Acknowledgements
The authors would like to thank the National Snow and Ice Data Center for providing the processed SSM/I data on CD-ROM and the Polar Science Center, Seattle, Washington for providing the Arctic Buoy data for this study. This work is supported in part by the Canadian Panel on Energy Research and Development.


