


The growing prevalence of childhood obesity over the past decades has become a major public health issue worldwide. Notwithstanding the underlying biology and/or genetic predisposition to obesity, a myriad of environmental factors are associated with the increase of obesity in children. In effect, the pace of technological change has outstripped human evolution and as a consequence, children are ill-equipped to handle the modern food environment, especially in the face of decreasing energy expenditure. Among the factors in the food environment, the contribution of increasing portion size (PS) and energy density (ED: kJ/g), to energy intake (EI) has become the focus of intense investigation.
Food PS have been steadily increasing in parallel with obesity since the 1970s( Reference Young and Nestle 1 ). The trends towards increasing PS are the most apparent and best documented in the USA, where PS of numerous food products, especially those of high ED have increased in the marketplace over the past three decades( Reference Young and Nestle 2 ). More extensive analyses of nationally representative dietary data in the USA have also confirmed this trend, not only for out-of-home eating, but also for in-home consumption by both adults( Reference Nielsen and Popkin 3 – Reference Nielsen and Popkin 5 ) and children( Reference Nielsen and Popkin 5 – Reference Piernas and Popkin 7 ). In comparison, there is a paucity of trend data on PS in Europe. Limited data from Denmark( Reference Matthiessen, Fagt and Biltoft-Jensen 8 ), the Netherlands( Reference Steenhuis, Leeuwis and Vermeer 9 ) and the UK( Reference Wrieden, Gregor and Barton 10 – 12 ) suggest that trends in PS are mirroring those observed in the USA, albeit that PS tend to be larger overall in the USA( Reference Rozin, Kabnick and Pete 13 ). Data from the UK and Ireland show that although the PS of many traditional products have generally remained constant, the range of PS has been extended for many food products, including savoury snacks, bakery products and those sold in fast food establishments( Reference Church 11 , Reference O'Brien, Lyons and McNulty 14 , Reference O'Brien, McNulty and Nugent 15 ).
Large PS, particularly of energy dense foods are highly likely to incite overeating, because they are relatively cheap for food industries to manufacture, and are therefore often seen by consumers as good value for money (e.g. multi- or share-sized packs). Exposure to large serving sizes is now routine and has effectively distorted consumers’ perceptions of what an appropriate serving size is. Moreover, the interchangeable use of the terms ‘PS’ and ‘serving size’ within existing guidance is confusing and can make it difficult for consumers to decide on an appropriate amount of food to consume( Reference Faulkner, Pourshahidi and Wallace 16 ). Throughout the current review, PS is defined as the amount of food intended to be consumed by an individual in a single-eating occasion, as opposed to ‘serving size’, which is the quantity recommended to be consumed in a single-eating occasion (e.g. by a manufacturer on a food label)( 17 ).
The availability of larger food PS of high-energy dense foods is a common characteristic of eating out of the home. Indeed, eating out-of-home is associated with increased EI and fat intakes( Reference O'Dwyer, McCarthy and Burke 18 – Reference Lachat, Nago and Verstraeten 20 ), and is an independent risk factor for obesity( Reference Thompson, Ballew and Resnicow 21 – Reference Burke, McCarthy and O'Neill 23 ). This is of particular concern given the increased frequency of out-of-home eating over time. For example, in 2004 approximately two-thirds of children from the island of Ireland ate out at least once per week, and food expenditure data demonstrate that this has increased in the past decade( 24 – 27 ). Recent research commissioned by safefood (the Food Safety Promotion Board, Ireland) has shown that although many restaurants and cafes have increased the provision of healthier options for children in recent years, there is still room for improvement in terms of the availability of PS offered on children's menus, e.g. by allowing children to order half portions from the main menu( 28 ).
The predisposition to overeat in response to large PS appears to be a ubiquitous phenomenon and occurs irrespective of age (child/adult), current weight status, sex and/or degree of dietary restraint or disinhibited eating behaviour( Reference Ello-Martin, Ledikwe and Rolls 29 – Reference Savage, Fisher and Marini 33 ). In young children food intake has been reported to occur primarily in response to hunger and satiety cues, with early laboratory evidence demonstrating an innate ability of young children to self-regulate their EI( Reference Birch and Deysher 34 – Reference Rolls, Engell and Birch 38 ). This has also more recently been confirmed in the free-living environment( Reference Kral, Stunkard and Berkowitz 39 ). The age, however, at which children become susceptible to over eat in response to large PS remains unclear. There is evidence to suggest that by the age of 1–2 years, children may no longer be immune to the intake-enhancing effects of large PS( Reference McConahy, Smiciklas-Wright and Birch 40 – Reference Fisher 42 ). It should also be remembered that EI is a function of both the PS of a food/beverage, as well as its ED and the frequency of consumption, among other factors( Reference Duffey and Popkin 43 , Reference Duffey and Popkin 44 ). Analyses of cross-sectional population level data in the USA have confirmed that over the past three decades, the observed increase in EI by both children over age 2 years and adults has largely been driven by a combination of increased eating frequency and PS( Reference Piernas and Popkin 6 , Reference Duffey and Popkin 44 , Reference Slining, Mathias and Popkin 45 ).
The purpose of this review is to evaluate the role of PS and ED in influencing and modifying children's EI, and subsequent risk of overweight/obesity.
Portion size
Observational evidence
Although natural hunger-driven eating behaviours are known to regulate the EI of infants and toddlers, environmental cues such as large food PS, have been shown to have the ability to disrupt this innate self-regulation( Reference Rolls, Engell and Birch 38 , Reference Adair 46 – Reference Mrdjenovic and Levitsky 49 ). In infants and young children (aged less than 11 months), Fox et al. (2006)( Reference Fox, Devaney and Reidy 41 ) reported a negative relationship between ED and average PS z-scores, suggesting that as the ED of diet increased, there was a corresponding down-regulation of food intake. In contrast, no such association was shown in toddlers (aged 12–24 months)( Reference Fox, Devaney and Reidy 41 ). Analysis of data from large-scale dietary surveys( Reference McConahy, Smiciklas-Wright and Birch 40 , Reference McConahy, Smiciklas-Wright and Mitchell 50 ) has also identified that large PS across many food groups are positively associated with obesity in young children. In UK adolescents, an increase in the PS of, and EI from snacks was also observed between 1997 and 2005, particularly for all drinks, crisps and savoury snacks and breakfast cereals( Reference Kerr, Rennie and McCaffrey 51 ). Further research has shown that the PS of meals is positively associated with BMI percentiles in boys aged 6–11 years and in children aged 12–19 years( Reference Huang, Howarth and Lin 52 ), and overall PS is consistently positively associated with both EI and body-weight in children( Reference McConahy, Smiciklas-Wright and Birch 40 ). However, these observational data, cannot establish causality.
Intervention studies
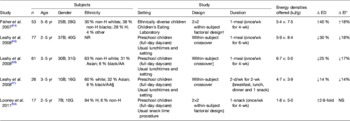
To date nine studies have been conducted in children to assess their responsiveness to increasing PS (Table 1). The majority of these studies have been conducted in the USA, and demonstrate that doubling the PS of a macaroni and cheese entree resulted in a 10–40 % increase in EI( Reference Rolls, Engell and Birch 38 , Reference Fisher 42 , Reference Fisher, Rolls and Birch 53 – Reference Fisher, Arreola and Birch 55 ), whereas a 4-fold increase in entree PS increased the total meal EI by 61 %( Reference Savage, Fisher and Marini 33 ). These observations were first reported in 5-year-old preschool children, but not in 3-year-old children( Reference Rolls, Engell and Birch 38 ), supporting the self-regulation hypothesis in younger children( Reference Adair 46 – Reference Birch and Fisher 48 ). Subsequent studies, however, have demonstrated significant positive effects of larger PS on EI in children even as young as 2 years( Reference Savage, Fisher and Marini 33 , Reference Fisher 42 , Reference Fisher, Rolls and Birch 53 , Reference Fisher, Liu and Birch 54 , Reference Looney and Raynor 56 , Reference Smith, Conroy and Wen 57 ). Moreover, there is evidence to suggest that these effects are sustained for up to 24 h( Reference Fisher, Arreola and Birch 55 ).
Table 1. Studies investigating children's energy intake (EI) response to a change in portion size (PS)

Δ, change; yr, year; B, boys; G, girls; AA, African-American; wk, week; ↑, increase; NS, not significant; H, Hispanics; NR, not reported ↓, decrease.
* Net effect on energy intake (i.e. over total eating occasion/study).
† Study also investigated the effect of self-serve portions on children's energy intake.
‡ Study also investigated the effect of energy density (5·4 and 7·5 kJ/g) on children's energy intake.
§ Study also investigated the effect of energy density (6·7 and 5·0 kJ/g) on children's energy intake.
∥ Study also investigated the effect of energy density (1·8 and 5·0 kJ/g) on children's energy intake.
¶ Study only reported change in food intake (g) which significantly ↓ in 4-yr-old children (179 and 183 v. 256 g), but significantly ↑ in 6-yr-old children (252 v. 325 v. 441 g).
In the only studies investigating the impact of ‘reduced’ PS in children, while no change in EI was observed when the PS of the entree decreased by 25 %( Reference Leahy, Birch and Fisher 58 ), a positive effect on EI was apparent in other studies when age-appropriate PS were assessed( Reference Savage, Fisher and Marini 33 , Reference Smith, Conroy and Wen 57 ). In the study by Smith et al. (2013)( Reference Smith, Conroy and Wen 57 ), it is also noteworthy that, unlike the 6-year-old children, the younger children (4-year olds) did not respond to the larger PS by eating more. In fact, they consumed significantly less food when served the large PS, in comparison with the smaller (reference) PS of the same meal (183 (sd 76) g v. 256 (sd 75) g; P≤0·01)( Reference Smith, Conroy and Wen 57 ).
These short-term studies, although limited in number, provide supportive evidence that from an early age children are susceptible to PS cues. In the short-term children will immediately respond to increasing PS by consuming more, but there is limited evidence to establish whether they will compensate for this at subsequent eating occasions( Reference Fisher, Liu and Birch 54 , Reference Leahy, Birch and Fisher 58 ). Although evidence from adults suggests larger PS result in a sustained increased in EI for up to 11 d( Reference Rolls, Roe and Meengs 59 , Reference Kelly, Wallace and Robson 60 ), no experimental or free-living studies to date have explored the longer-term effects of PS manipulation on the quantity of food consumed in children.
Energy density
Observational evidence
A recent systematic review commissioned by the US Dietary Guidelines Advisory Committee (2010)( 61 ) has concluded that the available evidence consistently supports a positive relationship between ED and body-weight in children and adolescents as well as adults. The evidence for the association in young people was based on four methodologically rigorous longitudinal studies, whose key strengths were: (1) use of objective measures of adiposity (including dual-energy X-ray absorptiometry or doubly-labelled water) rather than reliance on proxy measures such as BMI; (2) mis-reporting of dietary EI was appropriately adjusted for; (3) ED was calculated by recommended methods that excluded all or most beverages, to avoid attenuation of results( Reference Johnson, Mander and Jones 62 – Reference McCaffrey, Rennie and Kerr 65 ). The latter issue is of critical importance in evaluating associations between ED and adiposity( Reference McCaffrey, Rennie and Kerr 65 ). These authors convincingly demonstrated that when the calculation of ED included liquids (i.e. water, energy-free and energy-containing beverages), there was no association between ED and the change in adiposity between baseline and follow-up in their study cohort. In contrast, when the ED was calculated based on solid foods, including milk as a food, the ED of the diet at baseline did positively predict the change in adiposity over time. Furthermore, in this study it was the ED of the total diet rather than any particular part of the dietary pattern (e.g. the ED of snacks) that was associated with the change in adiposity( Reference McCaffrey, Rennie and Kerr 65 ).
Intervention studies
Studies investigating children's responsiveness to changes in ED are shown in Table 2. Although manipulating the ED of a single snack did not significantly affect children's EI at that eating occasion( Reference Looney and Raynor 56 ), reducing the ED of an entree has been shown to reduce children's total EI at that meal( Reference Fisher, Liu and Birch 54 , Reference Leahy, Birch and Fisher 58 , Reference Leahy, Birch and Rolls 66 ). These studies were similar in design to the PS interventions described earlier and the effect of decreasing ED on EI was also of a similar magnitude (17–18 % decrease). Further research has shown that this effect on EI can be sustained when the ED of multiple meals were manipulated over 2 d( Reference Leahy, Birch and Rolls 67 ).
Table 2. Studies investigating children's energy intake (EI) response to a change in energy density (ED)
Δ, change; yr, year; B, boys; G, girls; H, Hispanics; wk, week; ↑, increase; NR, not reported; ↓, decrease; AA, African-American.
* Net effect on energy intake (i.e. over total eating occasion/study).
† Study also investigated the effect of portion size (250 and 500 g) on children's energy intake.
‡ Study also investigated the effect of portion size (300 and 400 g) on children's energy intake.
§ Information only provided for twenty-five out of the twenty-six children.
∥ Study also investigated the effect of portion size (150 and 300 g) on children's energy intake.
Reductions in ED appear to have a positive effect on adiposity in the longer-term, particularly when children and parents are provided with more positively focused messages( Reference Epstein, Paluch and Beecher 68 ). Decreases in BMI z-scores were significantly greater in children advised to ‘increase their intake of healthy foods’ compared to those children advised to ‘reduce intake of high ED foods’ at both 12 (−0·30 v. −0.15 zBMI units; P=0·01) and 24 months (−0·36 v. −0·13 zBMI units; P=0·04)( Reference Epstein, Paluch and Beecher 68 ). From a public health perspective this study has revealed key insights about the importance of using positive messages to communicate dietary messages about weight control.
Strategies to reduce children's energy intake
A number of observational studies have associated increasing PS( Reference McConahy, Smiciklas-Wright and Birch 40 , Reference Huang, Howarth and Lin 52 , Reference Lioret, Volatier and Lafay 69 ) and ED( Reference Mendoza, Drewnowski and Christakis 70 , Reference Vernarelli, Mitchell and Hartman 71 ) with overweight and obesity in children, and not surprisingly have concluded that addressing such environmental factors is essential if children's food and EI is to be modified appropriately. While all studies that have decreased the ED of children's food agree on the positive effect on children's EI( Reference Leahy, Birch and Fisher 58 , Reference Leahy, Birch and Rolls 66 , Reference Leahy, Birch and Rolls 67 ), there is a paucity of data that unequivocally demonstrates the effectiveness of smaller PS.
Additive effects of portion size and energy density on energy intakes
Three studies so far have simultaneously manipulated both the PS and ED of children's food intake( Reference Fisher, Liu and Birch 54 , Reference Looney and Raynor 56 , Reference Leahy, Birch and Fisher 58 ) to investigate their independent and/or additive effects on EI (Tables 1 and 2).
In the study by Leahy et al. (2008)( Reference Leahy, Birch and Fisher 58 ), children's EI at a meal was affected by ED (but not PS). In contrast, Looney & Raynor( Reference Looney and Raynor 56 ) demonstrated an effect of PS (but not ED) on children's EI at a single snacking occasion. Leahy et al.( Reference Leahy, Birch and Fisher 58 ) showed that a decrease in ED of a meal (6·7 v. 5.0 kJ/g) resulted in a 17 % decrease in EI, irrespective of the PS served( Reference Leahy, Birch and Fisher 58 ). Conversely, Looney & Raynor( Reference Looney and Raynor 56 ), showed that an increase in the PS of a snack (150 v. 300 g) resulted in an 18 % increase in EI, irrespective of the ED of the snack provided. These findings suggest that different strategies to reduce children's EI may be required depending on the type of eating occasion. However, in the study by Fisher et al. ( Reference Fisher, Liu and Birch 54 ), PS and ED had both independent and additive effects on children's EI. Overall, an increase in both PS (250 v. 500 g) and ED (5·4 v. 7.5 kJ/g) resulted in a 34 % increased EI at that meal: an effect that was approximately double that reported when the main effects of each factor were analysed individually.
Together this evidence has prompted researchers to investigate novel strategies to reduce ED of children's meals, without compromising on the PS, so that children will compensate by increasing their intake of other foods.
Novel strategies manipulating portion size and/or energy density to modify children's energy intakes
Similar to the findings in studies conducted in adults( Reference Rolls, Roe and Meengs 72 ), offering children a large portion of a low-energy dense first course (e.g. vegetable soup)( Reference Spill, Birch and Roe 73 , Reference Spill, Birch and Roe 74 ) or larger portions of fruit and vegetables with a meal( Reference Kral, Kabay and Roe 75 , Reference Mathias, Rolls and Birch 76 ), were effective strategies in both promoting fruit and vegetable intake and decreasing the ED of children's meals. For example, in the study by Kral et al. ( Reference Kral, Kabay and Roe 75 ) when the PS of the broccoli and carrots side dish was doubled (75 g v. 150 g), children consumed significantly less of the pasta entree. Although the difference in overall EI at the meal was NS, the ED of the foods which children consumed at the meal did significantly decrease with the larger portions of fruit and vegetables (3·97 (sd 0.08) kJ/g v. 3.72 (sd 0.08) kJ/g; P=0·005). Moreover, others have shown that reducing the PS of high ED foods (e.g. French fries) and replacing with apple slices( Reference Wansink and Hanks 77 ) or serving dessert alongside the main meal, as opposed to after( Reference Huss, Laurentz and Fisher 78 ), can attenuate EI irrespective of the PS or choice of main entree. These studies clearly demonstrate the potential to employ more novel strategies for decreasing children's EI, while at the same time not compromising on palatability.
Spill et al. ( Reference Spill, Birch and Roe 79 ) also recently demonstrated that incorporating pureed vegetables into multiple meals, to achieve a 25 % decrease in ED, resulted in a down-regulation of preschool children's EI by 12 % (3–5-year-old boys and girls, n 40). Interestingly this reduction in EI persisted over a full day, and moreover, children did not compensate by consuming greater quantities of the un-manipulated snacks and side dishes offered throughout the day, as might have been hypothesised( Reference Spill, Birch and Roe 79 ).
Overall, these studies demonstrate that simply serving or covertly hiding more fruit and vegetables within children's meals can positively influence children's EI, at the same time as encouraging the consumption of these more healthy foods.
Parental influences
Dietary habits formed in early life are predictive of future eating patterns( Reference Birch 80 ) and evidence suggests the earlier and broader the experience with food, the healthier the child's diet will be( Reference Skinner, Carruth and Bounds 81 ). Given that obese parents are more likely to have an overweight/obese child( Reference Whitaker, Wright and Pepe 82 , Reference Lobstein, Baur and Uauy 83 ), arguably this increased risk of childhood obesity is highly likely to be influenced by the epigenetic interactions within the shared family experience, related to both the food and activity environment( Reference Faith, Scanlon and Birch 84 – Reference McCaffrey, Rennie and Wallace 87 ).
Research has shown that a coercive feeding approach, e.g. encouraging children to ‘clean the plate’, may actually have a counterproductive effect on food intake( Reference Birch, McPheee and Shoba 88 – Reference Wansink, Payne and Werle 91 ). Disruption of children's innate ability to self-regulate their EI and therefore encouraging eating in the absence of hunger has indeed been prospectively linked to an increased risk of becoming overweight, albeit only in girls( Reference Fisher and Birch 92 ). Furthermore, this compensation ability has also been shown to decrease with age, particularly in obesity-prone children (i.e. those born to mothers with a pregnancy BMI >66th percentile)( Reference Kral, Stunkard and Berkowitz 39 ).
Further research has shown that the amount of food parents or caregivers serve their children is directly related to the amount of food served( Reference Mrdjenovic and Levitsky 49 ) and is also predicted by the amount they serve themselves( Reference Johnson, Hughes and Cui 93 ). In a repeated-measures cross-sectional study (145 parents and their preschool children), Johnson et al. (2014)( Reference Johnson, Hughes and Cui 93 ) reported a positive association between the amount of food parents served themselves and the amount of food served to and consumed by their children during three at-home evening meals. These findings add support to studies conducted in the laboratory setting, by showing that in a more natural family environment, children will also respond to larger PS by eating more.
Other environmental cues
Again, similar to findings in studies conducted in adults( Reference Wansink and Cheney 94 – Reference Raynor and Wing 98 ), children's PS can also be influenced by food preferences and visual cues, such as self-served portions and the size of tableware.
The self-service of food or beverages requires some form of conscious effort and thought from an individual about how they are going to serve it, as well as the PS they wish to consume. For example, an individual may be perceptually driven to completely fill a cereal bowl, if they perceive an increased level of hunger at the time( Reference van Ittersum and Wansink 99 ). Analysis of large-scale survey data from 4966 fifth grade US students (aged 10–11 years) showed that children's liking for higher-energy dense foods (e.g. French fries, meats and potato chips) led to a preference for larger-than-recommended portions compared with that for lower-energy dense foods (e.g. vegetables)( Reference Colapinto, Fitzgerald and Taper 100 ). However, the results of experimental studies in this area are equivocal suggesting that self-serving may not provide a ‘one-size-fits-all’ approach to facilitate the avoidance of overeating in response to larger PS( Reference Fisher 42 , Reference Fisher, Rolls and Birch 53 , Reference Savage, Haisfield and Fisher 101 ).
The PS of self-served food is also partly influenced by the size of the plate, bowl or glass used( Reference van Ittersum and Wansink 99 ). Early research in this area suggests that children perceive taller containers to hold more of a food/beverage than shorter, wider containers( Reference Piaget, Inhelder and Szeminska 102 ). Wansink & van Ittersum( Reference Wansink and van Ittersum 103 ) subsequently showed that this visual illusion caused children to pour and consume significantly more energy from fruit and soft drinks when they were given a short, wide glass compared with a taller narrow glass (of the same volume capacity). Similar findings have since been confirmed for foods served using different sizes of spoons( Reference Fisher, Birch and Zhang 104 ) or onto larger adult-sized dinnerware( Reference DiSantis, Birch and Davey 105 , Reference Wansink, van Ittersum and Payne 106 ), with effects reported to be greater in extraverted compared with introverted children( Reference van Ittersum and Wansink 107 ).
Conclusions
Positive effects of increased PS and ED on children's food and EI have been observed in children as young as 2 years, and of particular concern, both these factors have been shown to exert independent but additive effects to promote EI. The overwhelming majority of studies manipulating PS or ED in children, however, have been acute, single-eating occasion studies, with only two studies investigating the impact of PS and/or ED on overall food intake for 24 h. Studies have been conducted in both laboratory and more naturalistic settings, for example in the usual classroom setting, but have tended to focus on similar foods/entree meals.
In general, children tend to eat proportionally more as the PS and/or ED increases, but as most of the evidence is based on children aged 3–6 years, it remains unclear how early young children will begin to overrule their self-regulation of EI when exposed to such environmental triggers. Furthermore, there is a paucity of data in older children and adolescents, particularly conducted across other countries outside of the USA, where the increase in food PS within the marketplace may not be so apparent.
Although a direct causal link between PS and obesity remains to be established, the regular consumption of large PS of energy dense foods do favour obesity-promoting eating behaviours in children. The cumulative evidence relating to strategies to reduce children's EI and outlined in the current review, provides a strong basis for the provision of food PS advice to parents. In addition, such advice should be cognisant of the array of environmental cues consistently reported to inadvertently increase children's food PS, from as young as age 2 years. More emphasis on parental education on PS distortion and appropriate child-sized portions is clearly merited given their role in determining their children's food intake. Current childhood obesity prevention campaigns in the UK( 108 ) and Ireland( 109 ), have highlighted the key importance of offering child-sized portions on appropriately-sized dishware, as well as encouraging lower energy dense snack foods and beverages. More research, however, is required to establish the most feasible and effective intervention and policies to counteract the deleterious impact of PS and ED on children's EI.
Acknowledgements
The authors would like to acknowledge the Irish Section of the Nutrition Society for inviting this symposium presentation.
Financial support
None.
Conflicts of interest
None.
Authorship
L. K. P. reviewed the literature and wrote the manuscript; T. A. M., M. A. K. and M. B. E. L. provided guidance and commented on drafts of the review.


