


Introduction
In many regions affected by avalanches, the most dangerous conditions arise during storms. This is partially due to the structural instability of the newly fallen snow (Reference LaChapelle and ŌuraLaChapelle, 1967). Measurements of the mechanical characteristics of fresh snow pertinent to avalanche formation must be made during and immediately after storms.
Because of their fragility, samples of newly fallen or weakly metamorphosed snow usually are disturbed in transit despite careful handling. The alternative is to test the snow in situ. Although the literature contains many references to in situ testing of metamorphosed snow, reports confined to such measurements of newly fallen snow are scarce. Reference RochRoch (1966) performed systematic in situ tests on alpine snow profiles. His techniques were designed to test snow in various stages of metamorphism; consequently, his fresh-snow measurements did not discriminate among the many possible varieties of newly fallen snow. Reference Keeler and WeeksKeeler and Weeks (1968) explored the consistency of various in situ test schemes. However, like Roch, they were primarily interested in the entire profile of the alpine snowpack. Reference MartinelliMartinelli (in press) measured the properties of freshly deposited snow in the starting zone of several avalanches, and suggested several of the modifications reported in this paper.
Many difficulties are encountered in setting up consistent experiments on fresh snow. An important problem is the structure and property variation in the, Z-direction (Fig. 1) which necessitates sampling the entire profile of newly fallen snow at closely spaced intervals. For most tests, a practical interval is 5 cm. The problem of variation in the X - and ϒ- directions can be minimized by the choice of a suitable study area, free from wind and precipitation anomalies. Because of rapid metamorphism, measurements must be taken at 8 h intervals during the storm period. Finally, the tests must be performable during blizzard conditions, and must cover a strength range of at least two orders of magnitude.
This report summarizes the development of four in situ tests which overcome the above difficulties. The drop-cone penetrometer, the ram penetrometer, and the shear frame are modified versions of devices previously applied to metamorphosed snow. A cantilever test is introduced for measuring tensile strength.

Fig. 1. Reference systems.
Drop-cone Penetrometer
Drop-cone penetrometers have provided self-consistent values for hardness of snow. Reference Takahashi and KudoTakahashi and Kudo (1941) performed drop-cone experiments on snow in the density range of 250 to 420 kg m−3. Their data led to the following relationship:
where U is the energy of impact, m the mass of the drop cone, g the acceleration due to gravity, H the distance of fall (Fig. 1), D the depth of penetration (Fig. 1), and q and p are constants related to the snow structure. They defined hardness of the snow, P, as simply:
where V is the volume of the depression. Reference InahoInaho (1941) applied the drop cone to a variety of snow types. In his experiments, p ranged from 1.6 to 5.2. This showed the limitation of the hardness definition given by Equation (2) which assumes p = 3. Other drop-cone experiments have been reported by Reference BaderBader and others (1951); Reference YosidaYosida (1957); and Reference AnisimovAnisimov and others (1958). Drop-cone hardness of clay has been related to shear strength by Reference HansboHansbo (1957).
At the Alta Avalanche Study Center, a drop-cone penetrometer was developed for testing freshly fallen snow. Its operation (Fig. 2) is as follows: the instrument rests on the snow, supported by its flange in a level position. The cone assembly is held up by the clamp. The operator looks through the observation window, loosens the clamp, gently lowers the cone assembly until it makes contact with the snow, and notes the meter stick reading, Z r. The cone assembly is then lifted to an initial Z 1 reading on the meter stick, released and allowed to fall, penetrate the snow, and come to rest at position Z 2.

Fig. 2. The Alta drop-cone penetrometer.
The distance of fall and depth of penetration are, respectively,

U can be increased by decreasing Z 1 (that is, raising the cone assembly) or by adding weights to the cone assembly.
Previous drop-cone models measured the diameter of the conical impression. This was a time-consuming operation and restricted the experimenters to two or three drops per determination of U. Using the procedure described above, the operator can make quickly 5 to 10 drops for each determination. The aluminum frame provides ample protection from the wind during blizzard conditions.
Provision was made for using 120°, 90°, 60°, and 45° cones. Comparative studies were made and 60° cones, with base diameters 15, 25, and 40 cm, were selected as most suitable. Though 120° and 90° cones gave consistent results, the base diameter of these cones would have to be large to allow for deep slab penetration. The 45° cone was disqualified because of a peculiar inconsistency; certain snow types would fracture around the impact point of this narrow-angle cone.
On a log–log diagram, U is approximately a linear function of D (Fig. 3); in most cases this is an excellent approximation. From the log–log diagram it is possible to determine p and q of Equation (1).
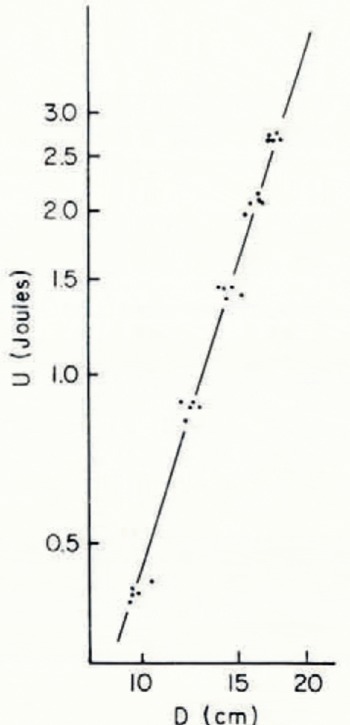
Fig. 3. Impact energy (U) as a linear function of penetration (D) on a log–log diagram; newly fallen snow, density 110 kg m−3 19 March 1967, Alta.
Because penetration is a complex process, it is difficult to uncover intrinsic values of strength or resistive pressure from Equation (1). Reference MellorMellor (1964) summarizes some of the power relationships that have been used, and Reference Kinosita and ŌuraKinosita (1967), making a distinction between brittle and plastic failure, reports power relationships for the force which resists the intrusion of a cone. In newly fallen snow, it is useful to derive power relationships for resistive pressure directly from Equation (1), by lumping all of the mechanisms that resist penetration into a generalized force
Then, from Equation (1)
and
For a 60° cone, an incremental band of area is
The resistive pressure, P, is

Finally, the “hardness number”, P , of a layer is defined as an average of the resistive pressure taken over the thickness of the layer, L,

Clearly, the thicker the layer, the more resistance it offers to conical penetration. For comparison of snow types, all values of P should be based on the same value of L.
Some results of drop cone experiments performed in the spring of 1967 are shown in Table I.
Table I. Drop-cone Penetrometer Experiments, Alta, 1967

Ram Penetrometer
A ram penetrometer for measuring the relative mechanical strength of snow was designed by Haefeli (Reference BaderBader and others, 1939). Each winter this instrument is used in many alpine regions to determine the strength changes of the snow profile in relation to the avalanche hazard. Correlations have been established between this well-known instrument and intrinsic snow properties (Reference Keeler and WeeksKeeler and Weeks, 1968).
The Haefeli penetrometer is too heavy (about 1 kg per section) to be used on newly fallen snow. On a suggestion by M. Martinelli, a light-weight ram was designed at Alta (Fig. 4) and applied to newly fallen snow during the season 1967–68.

Fig. 4. Ram penetrometer. Mass, 0.06kg (not including wood block).
Haefeli (Reference BaderBader and others, 1939) recommended a “ram number” defined by

where R is the weight of the driving hammer, h the height of fall of the driving hammer (Fig. 1), d the depth of penetration (Fig. 1), Q the weight of the penetrometer, not including the hammer, and W1 the ram number.
Equation (7) is based on a coefficient of restitution, η = 1. Haefeli demonstrated that a ram number, W η , could be derived in terms of a general η

He chose Equation (7), however, partially because of its simplicity and partially because he felt η would have a high value owing to a low ratio of strain energy of the penetrometer to total impact energy. This last argument was not clear and Reference WaterhouseWaterhouse (1966) recommended replacing Equation (7) with an equation equivalent to Equation (8).
Based on data compiled by Reference ChellisChellis (1961), a reasonable value of η for the Alta ram is η = 0.5. Then Equation (8) becomes

When the Alta ram is applied to a moderately strong layer of newly fallen snow, h/d may be 10 or larger, and, from Equation (9),

Thus the corrections are important, and Equation (9) should be used when a consistent comparison is desired between the ram and other tests.
Reference Olson and FlaateOlson and Flaate (1967) summarize various formulas that could possibly replace Equation (9) and avoid the use of η. On the other hand, Equation (9) is in convenient form for correcting W 1, the ram number used in most previous studies.
In contrast to metamorphosed snows which typically have ram numbers of the order of 10 to 102 kg (102 to 103 N), the ram numbers of newly fallen snows are of the order of 10−1 to 1 kg (1 to 10 N).
The main advantage of the ram is its ease and speed of use. A 3 m thick layer of newly fallen snow can be tested in about 2 min. Other tests which depend on digging snow pits and slicing out samples are far more time-consuming.
From some preliminary experiments, the Alta ram appears suitable for strength tests at the fracture zone of avalanche slopes during periods of soft slab formation.
Unfortunately, the ram number is related to the complex mechanism of penetration rather than direct shear or tensile strength. Difficulties can be expected when attempts are made to correlate the ram number with intrinsic snow properties despite the careful selection of a relationship such as Equation (9).
Shear Frame
Since the intrinsic properties of newly fallen snow are not easily derived from penetration experiments it is preferable to devise tests which measure directly the properties in question. Such tests will generally require more patience from the observer than the expedient penetration tests. With sufficient experimental data, it may be possible to establish meaningful correlations between various tests; eventually, only the simple and quick tests would be retained.
The Alta shear frame (Fig. 5a) is a modification of’ a shearing apparatus introduced by Roch (de Reference QuervainQuervain, 1950). Since new snow has a wide range of strength, two separate frames are necessary. Both frames have the same dimensions; however, one frame is fabricated from very thin gage aluminum (about 0.75 mm) so that it is easily supported by weak, low-density snow; the second frame is fabricated from thicker gage aluminum (about 1.5 mm) and can be used on stronger snows. A low-range spring scale (0–10 N) is used to pull the light frame; a higher range scale (0–100 N) is used on the heavier frame. The scales are equipped with memory attachments. Readings are taken at 5 cm intervals in the wall of a snow pit.

Fig. 5a. Shear frame suitable for newly fallen snow.
Reference RochRoch (1966) reported consistent measurements with a rate of loading that induced failure between 1 and 2 s after the initial application of the force. This rate is facilitated by a rapid but smooth pull on the spring scale. All of the tests reported in this paper presume brittle-type failure which can be achieved by the rapid application of stress (Reference Kinosita and ŌuraKinosita, 1967).
The shear strength of the snow τ is maximum force F divided by area of frame, which for the Alta unit is
Some typical values of shear strength calculated according to Equation (10) are shown in Table II.
Reference RochRoch (1966) determined the Coulomb-Mohr envelopes of his samples by placing various weights on a glass plate. He was able to verify Haefeli’s prediction (Reference BaderBader and others, 1939) with respect to fresh snow, that a small normal load on the shear frame tends to break the dendritic branches and cause a slight reduction in strength. Roch also observed an increase in strength with an increase in normal loading, but he judged that the increased loading caused the fresh snow to densify by successive failures with a major alteration in the structure of the original test specimen. It is anticipated that Roch’s technique of normal loading can be applied to freshly fallen snow; further investigations are planned.
Table II. Comparison of Shear-Frame Strength τ and Beam Number B For Newly Fallen Snow Alta, 1968

Closely related to the shear frame is the shear vane (Fig. 5b). The moment M applied by the torque wrench at the instant of failure is balanced by the shear strength τ so that


Fig. 5b. Shear vane.
Suggested dimensions for use on newly fallen snow are l 1 = 5 cm and l 2≈10 cm. Because a snow pit is not required for its operation, the shear vane is a faster test than the shear frame. Development of this technique is planned for 1969.
Cantilever Beam
Tensile strength of alpine snow has heretofore been determined by a centrifugal test (Fig. 6) (de Reference QuervainQuervain, 1950), and calculated from


Fig. 6. Centrifugal test.
where σ is the tensile strength, S the cross-sectional area of the cylinder, 2l the length of the cylinder, dm the mass of the infinitesimal disc, r the distance of the disc from the axis of rotation, and v the linear speed of the disc at failure.
This test appears to be reliable and may offer a true indication of the actual tensile strengths of small cylindrical samples. Unfortunately, cylindrical samples of newly fallen snow are not easily collected; an alternative for measuring tensile strength is needed.
The following in situ test has been developed: A snow pit is excavated, according to Fig. 7a. A flat aluminum plate, graduated in centimeters, is inserted into the pit wall (Fig. 7b), and then withdrawn quickly with a downward pressure. These two steps are repeated utilizing a deeper insertion of the plate each time until the cantilever beam fails (Fig. 7c). After removing the 1 or 2 cm of compressed snow which were destroyed by the downward pressure of the plate, the sequence can be repeated for the next 5 cm interval and so on down through the snow profile.

Fig. 7.
-
(a) (top) Excavation of snow it for cantilever beam test.
-
(b) (middle) Insertion of plate into pit wall.
-
(c) (bottom) Failure of the cantilever beam at a length λ
This test must be accompanied by a density profile taken at about 5 cm intervals. For newly fallen snow it is most convenient to collect density samples in cylindrical cans (1000 cm3 in volume or about 5 cm high and 8 cm in radius).
In situ beam tests have been applied to investigate the flexural properties of fresh ice and sea ice (Reference Tabata and ŌuraTabata and others, 1967), but a search of the literature has not revealed any previous application of beam testing to low-density snow and the precise interpretation of snow beam data in terms of tensile strength is an open question.
Z. Yosida (personal communication) has suggested that a reasonable approximation to the tensile strength σ sustained by the top fiber of the beam may be

where M is the moment of the beam, c the distance from the neutral axis to the top fiber and I the second moment of area of the cross-section of the beam.
For a beam of length λ, thickness L, and density p, Equation (13) becomes
Equation (14) is based on the symmetric stress distribution shown in Figure 8a. For other stress distributions, such as the unsymmetric case shown in Figure 8b, σ is still of the order of gρλ 2/L. Following the analogy of the “ram number”, a “beam number” B can be defined as

Fig. 8.
-
(a) (top) Summetric stress distribution of a cantilever beam.
-
(b) (bottom) Unsymmetric case.
Values of B are shown in Table II. It is expected that B can be related to the tensile strength; perhaps as suggested by the above study, simply
where k makes an adjustment appropriate to the stress distribution of the beam.
The foregoing analysis presupposes tensile failure. Observations of the beam fracture patterns (Fig. 9) do not verify that this is necessarily the case. In consideration of the possible role that shear failure plays, it is preferable to assert

Fig. 9. Typical fracture patterns observed in the cantilever beam test.
Three sequential profiles of newly fallen snow are shown in Figure 10. For each layer, the “ram number” is plotted as a solid line and the “beam number” as a dashed line. The first profile, (a), was taken at the beginning of the storm, 17.00 h, 12 February 1968; (b) was taken at 09.00 h, 13 February 1968; and (c) at 16.00 h, 13 February 1968.

Fig. 10. Comparison of ram number (solid line) and beam number (dashed line). Newly fallen snow February 1968, Alta.
In Table II, a comparison of τ and B, indicates that newly fallen snow is considerably stronger in tension than in shear. It is of interest that Reference Keeler and WeeksKeeler and Weeks (1968) shows 10:1 for the ratio of tensile to shear strength while Roch (1965) shows up to 8: 1. These high ratios are not easily reconciled with the standard theory of strength of materials which predicts

Since a simple tensile stress of σ itself produces a shear stress of ![]() on planes at 45° as can be seen from Mohr’s circle construction.
on planes at 45° as can be seen from Mohr’s circle construction.
Reference MartinelliMartinelli (in press) has also obtained relatively high ratios for tensile to shear strength but feels that these ratios reflect the peculiarities of the tests rather than the intrinsic strengths of the snow. In fact, R. Sommerfeld (personal communications) associates the reported high ratios with the stress concentrations that are introduced by vanes in the shear testing devices and the lack of the same in the tensile tests.
The distribution of B with density is shown on a semi-logarithmic diagram (Fig. 11). Further investigations will be needed to determine if the order of magnitude variation in B at all densities is a real variation in tensile strength as opposed to a peculiarity of the cantilever test.

Fig. 11. Beam number B plotted against density on a semi-logarithmic diagram, 1967–68, Alta.
Conclusions
Preliminary studies at Alta have demonstrated that mechanical properties of newly fallen snow can be determined by a variety of simple in situ tests, most of which are well known and are at least self-consistent. These tests can all be performed during the most severe alpine weather. Future experiments are needed to establish the mutual consistency of these tests as well as their relationship to the intrinsic properties of the snow.
Generally speaking, penetration experiments are easy to perform but difficult to interpret. From drop-cone data, the “hardness number” can be calculated as

and corrected “ram numbers” can be obtained from

It may be possible to relate these numbers theoretically or experimentally to shear and tensile strengths.
Shear and tensile experiments, although more difficult to perform, are feasible if the apparatus is made light and large in comparison to the similar apparatus used on metamorphosed snow. Further development of the shear frame tests is needed to determine the Coulomb–Mohr behavior of newly fallen snow.
The cantilever test, despite problems of interpretation, gives an indication of the tensile strength in terms of a “beam number”
The high ratio of tensile to shear strength reported here and in previous studies should receive more attention. It may be possible to either discover the mechanism in the crystal structure which permits this high ratio or alternatively show that peculiarities in the tests are responsible for this unexpected behavior.
When comparisons between these tests are established, the more expedient tests can be conducted at the fracture zone of avalanche paths.
Acknowledgements
The drop-cone and lightweight penetrometer were designed by E. R. LaChapelle. The author gratefully acknowledges his guidance in this study. Many helpful suggestions were made by M. Martinelli, R. Sommerfeld, A. Judson and R. Schmidt of the Rocky Mountain Forest and Range Experiment Station. This study was financed by the Wasatch National Forest, Salt Lake City, Utah, and the Rocky Mountain Forest and Range Experiment Station, Fort Collins, Colorado.


