


It is commonly accepted that food can influence brain functions such as mood and cognition. Stress-related mental disorders such as depressed mood and anxiety are prevalent in modern societies( Reference Hulsken, Martin and Mohajeri 1 ), making a search for a side effect-free ingredient to boost mood and mental activity a necessity. The neurotransmitter serotonin (5-hydroxytryptamine) is implicated in the processing of emotional cues, memory, attention and information processing( Reference Riedel, Sobczak and Schmitt 2 ). A reduced serotonergic neurotransmission may cause changes in emotional processing associated with depression, anxiety and poor stress coping( Reference Robinson, Cools and Crockett 3 , Reference Robinson and Sahakian 4 ), and antidepressant therapies exert their beneficial effects by normalising deficits in central serotonergic transmission( Reference Cowen 5 ). A reduction in serotonin signalling has also been associated with impaired long-term memory, but has been reported to improve focused attention( Reference Booij, Van der Does and Haffmans 6 , Reference Sobczak, Riedel and Booij 7 ). Moreover, increased serotonin release can result in reduced vigilance( Reference Schmitt, Wingen and Ramaekers 8 , Reference Silber and Schmitt 9 ).
There has been long-standing interest in the effects of dietary manipulation of brain serotonin because of its unique nutritional susceptibility; that is, tryptophan (Trp) is an essential amino acid that cannot be synthesised in the body and has to be obtained from the diet. Moreover, the rate-limiting step for serotonin synthesis involves the conversion of Trp to 5-hydroxytryptophan by the enzyme tryptophan hydroxylase, and tryptophan hydroxylase is not fully saturated by substrate under normal conditions, suggesting that increasing brain Trp levels could enhance serotonin synthesis. Trp, however, is transported through the blood–brain barrier by a transport system, which also transports large neutral amino acids (LNAA), especially the branched-chain amino acids leucine, isoleucine and valine, and also phenylalanine and tyrosine. To enter the brain across the blood–brain barrier, Trp has to compete for uptake against LNAA. Therefore, the Trp:LNAA ratio in plasma is typically considered to be the best predictor of the uptake of Trp into the brain. Because Trp is the scarcest amino acid in most dietary proteins, consumption of a protein-rich meal normally reduces this ratio. Conversely, consumption of a high-carbohydrate, low-protein meal will raise the ratio, particularly as the rise in insulin levels leads to the uptake of the competing LNAA in the peripheral tissue( Reference Schmitt, Wingen and Ramaekers 8 , Reference Silber and Schmitt 9 ).
Acute Trp depletion, which results in at least 70 % reduction of plasma Trp in humans( Reference Young 10 , Reference Young, Smith and Pihl 11 ), has been shown to disturb mood and to impair cognition, particularly memory and attention, and emotional information processing, especially in recovered depressive individuals or genetically vulnerable subjects( Reference Schmitt, Wingen and Ramaekers 8 , Reference Silber and Schmitt 9 ). Acute Trp depletion dramatically reduces Trp availability to the brain and thus represents an experimental approach to mimic the mental biases observed in depressed populations, including memory impairment or biases towards negative information( Reference Mathews and MacLeod 12 ) and emotional face recognition( Reference Harmer, Rogers and Tunbridge 13 ); the finding of the latter study disrupted fear recognition in women.
Using oral or intravenous dosing with Trp, attempts have been made to increase Trp entry into the brain to study whether depressive behaviour may be improved by elevating serotonin synthesis. However, these trials were inconclusive because oral supplementation of the free amino acid Trp increases the release of several hormones including growth hormone, cortisol and prolactin, making it virtually impossible to design proper placebo-controlled human studies( Reference Porter, Gallagher and Watson 14 ). To circumvent this difficulty, the strategy of administration of Trp-rich dietary proteins, such as the whey protein α-lactalbumin, was chosen to enhance Trp availability to the brain and enhance serotonin synthesis. To match the total amino acid content, another milk protein, typically casein hydrolysate, is routinely used as the control treatment in human studies. Elevated serotonin function by α-lactalbumin supplementation has been shown to enhance cognition in human subjects as well as to reduce cortisol release in anxious stress-prone participants( Reference Markus, Olivier and de Haan 15 , Reference Markus, Olivier and Panhuysen 16 ). Further research has shown that α-lactalbumin supplementation attenuates deficits in delayed memory for abstract patterns in women suffering from the premenstrual syndrome, in whom memory may be impaired( Reference Evers, Tillie and van der Veen 17 ). In addition, α-lactalbumin improves the memory of recovered depressives and healthy subjects( Reference Booij, Van der Does and Haffmans 6 ), and increases the recognition of emotional faces in healthy young women( Reference Attenburrow, Williams and Odontiadis 18 ).
We have developed LumiVida™, an egg-white protein hydrolysate formulation, that has a favourable ratio of Trp:LNAA and is therefore more potent in raising plasma Trp:LNAA ratios than either α-lactalbumin or Trp alone( Reference Markus, Firk and Gerhardt 19 , Reference Mitchell, Slettenaar and Quadt 20 ). Several randomised control trials have studied the benefits of consumption of this product as a food supplement on cognitive and emotional measures. Acute dosing with high levels has been shown to be effective in improving mood( Reference Markus, Firk and Gerhardt 19 ) and enhancing psychomotor and vigilance performance, even in individuals who are resilient to stress( Reference Markus, Verschoor and Firk 21 ). Also, consumption of this protein hydrolysate significantly increases positive mood in psychological subjects and dampens the cortisol response to acute stress( Reference Firk and Markus 22 ). We further showed by functional MRI in a double-blind, placebo-controlled cross-over study that one serving of this drink improves mood and alters task-specific and resting-state processing in brain regions implicated in mood regulation in healthy young women, including the dorsal caudate nucleus, the medial cingulate gyrus and the ventromedial prefrontal cortex( Reference Kroes, van Wingen and Wittwer 23 ). Finally, our recent data show that acute consumption of LumiVida™ has beneficial effects on emotional processing and prevents the increase in fatigue observed over the test period, conferring resistance to deterioration in mood in healthy subjects( Reference Gibson, Vargas and Hogan 24 ). To determine whether LumiVida™ might remain effective when taken in a more realistic manner, i.e. daily over several weeks, we now supplemented a similar cohort of participants chronically with low-dose LumiVida™ and report herein the effects of this treatment on cognitive and emotional parameters.
Materials and methods
Study design and participants
We assessed the effects of a Trp-rich supplement drink, LumiVida™ (referred to here as the ‘test drink’), on emotional and cognitive functions in a randomised, parallel, double-blind, placebo-controlled, between-subjects chronic treatment. A total of sixty female participants (n 30, age 45–65 years) were randomly allocated, stratified by age, to receive either placebo (control drink: 0·5 g casein hydrolysate twice per d) or the test drink (LumiVida™: 0·5 g twice per d, containing approximately 70 mg Trp in total).
The treatment continued for 19 d (only the morning dose was given on the final test day). The present study was conducted according to the guidelines laid down in the Declaration of Helsinki, and all procedures involving human participants were approved by the University Ethics Committee of the University of Roehampton. Written informed consent was obtained from all the participants. The present study was registered at ClinicalTrials.gov (identifier no. NCT02172859) under a registered trial name ‘Dietary Influence on Serotonin in Cognitive and Emotional Functioning in Women (P2B_UK)’.
Screening, inclusion and exclusion criteria
Physically and mentally healthy women, not receiving medical/pharmacological treatment, free of gastrointestinal complaints, not in pain, not diagnosed with a psychiatric disorder, and with a BMI between 18 and 35 kg/m2, were included in the present study. To establish this, a brief medical history was taken, especially the history of treatment for psychiatric disorders. Furthermore, it was necessary to establish menstrual status before arranging the first (baseline) visit, as any pre-menopausal participants needed to be behaviourally tested in the follicular phase (within 2 weeks of the start of menstrual bleeding). Menstrual status was established by a questionnaire once verbal consent was obtained. In addition, participants were informed that the following restrictions would apply to the screening and the test day: (1) no alcohol consumption on the day before the screening or test days; (2) usual caffeinated drink (if taken) to be drunk before 08.00 hours on the test day, to avoid caffeine-withdrawal effects; (3) no other food or drink except water to be taken from 22.00 hours the previous evening until after testing.
The following exclusion criteria were applied: (1) depression, anxiety and neurological diseases such as migraine, dementia, epilepsy and Parkinson's disease within the last 12 months; (2) history of any psychiatric or neurological illness in the last 2 years; (3) current medication targeting the brain (except mild painkillers) including steroids, e.g. for contraception, hormone replacement therapy, drugs for weight control, stimulants, antihistamines, St John's wort, 5-hydroxy-tryptophan or melatonin; (4) pregnancy; (5) current gastrointestinal complaints; (6) type 1 or type 2 diabetes; (7) current recreational drug use, except alcohol (not allowed in 24 h before testing; >21 units/week on average); (8) current smoker; (9) lack of regular driving over at least 1 year in the last 10 years.
Before the baseline test, participants were sent four brief questionnaires to assess personality characteristics associated with serotonin function: Dutch Personality Inventory – Neuroticism scale (twenty-one items), translated into English by a native Dutch speaker and refined by a native English speaker( Reference Luteijn, Starren and van Dijk 25 ); this questionnaire has been used in previous studies of dietary manipulation of serotonin( Reference Markus, Verschoor and Firk 21 , Reference Markus, Panhuysen and Tuiten 26 ); Depression Anxiety and Stress Scale (twenty-one items, 1-week retrospective( Reference Antony, Bieling and Cox 27 )); Aggression Questionnaire – Short Form( Reference Bryant and Smith 28 ); Barratt Impulsiveness Scale – 15-item Short Form( Reference Spinella 29 ).
On the baseline test day, participants also completed the National Adult Reading Test (NART)( Reference Nelson and Wilson 30 ) that provides a measure of stable verbal intelligence quotient. This involves participants reading aloud a series of fifty irregular words, presented one by one on cards. Participants were scored for the number of errors in pronunciation.
Treatment protocol
The schedule of testing for each test day is presented in Table 1. On the baseline day (day 1), participants arrived at 08.30–08.45 hours, the study was reviewed, consent was obtained, and height and weight were measured. Then, a blood sample was drawn to establish the pre-treatment levels of Trp and LNAA, for comparison with the results following the treatment, and the first testing took place. Subsequently, participants were supplied with thirty-eight supplement drinks (two per d for 19 d), in the form of sachets of citrus-flavoured powder to be dissolved in 150 ml water, and were instructed to start taking the drink on day 3, so that days 1 and 2 provided a pair of baseline sleep and mood diary days before treatment. Diaries were recorded on four pairs of days (same days of the week), one pair being before taking the supplement. Information about time of supplement intake, sleep quality and latency, and bedtime mood was recorded.
Table 1 Study schedules for the baseline and final test days

MAPSS, Mental and Physical Sensations Scale; NART, National Adult Reading Test; SRT, simple reaction time; VRM, verbal recall memory; MTS, Match to Sample Visual Search; RVP, rapid visual processing; AGN, Affective Go/No-Go.
On the baseline day, before cognitive testing, participants completed a series of twenty-eight mental and physical sensation ratings, in response to computer-generated questions, on a scale from 1 = ‘not at all’ to 9 = ‘extremely’. This computer-based Mental and Physical Sensations Scale (MAPSS) was run on E-prime (version 2) and questions were randomly sequenced. This test was repeated 90 min later and once again at the end of all testing.
On the final test day (day 22), participants were asked about their current health, any adverse events and whether they experienced any stress so far. Subsequently, the test schedule followed that of the baseline day (Table 1), except that two blood samples were drawn using a butterfly needle inserted into a vein in the antecubital fossa of the forearm, and the freshly prepared experimental drink was given after the first MAPSS ratings, followed by a 1 h rest before cognitive testing. Just before the first test (reaction time), a buccal cell swab was taken, for later DNA assay (data not shown). The first blood sample was drawn from participants in a seated position 30 min before the initial MAPSS ratings, while the second sample was drawn 90 min after treatment at the time of expected peak changes in plasma Trp and Trp:LNAA levels( Reference Markus, Firk and Gerhardt 19 , Reference Mitchell, Slettenaar and Quadt 20 ) following the completion of the Rotary Pursuit Task but before starting the critical memory tests. This blood sample was taken in order to explore whether the single 0·5 g dose of the test drink was effective in raising Trp:LNAA levels compared with the placebo drink. Blood was collected in a Vacutainer™ Lithium Heparin tube and prepared for amino acid analysis of plasma; the remaining blood was discarded. After the completion of cognitive testing, participants completed a ‘tolerability’ questionnaire to assess any signs of discomfort.
Plasma levels of tryptophan and large neutral amino acids
Blood samples were collected in Vacutainer™ Lithium Heparin tubes and centrifuged at 4000 rpm for 10 min at 4°C. Then, 750 μl plasma supernatant was pipetted into each of two Eppendorf cups. These were prepared with 120 μl of sulfosalicylic acid solution (25 %, w/v) to deproteinise the plasma. The mixture was vortexed for 1 min until evenly milky and then frozen at − 80°C. Subsequently, 40 μl of internal standard (160 mg α-aminoadipic acid in 2 litres of 1·2 mm-HCl) were added to 20 μl plasma and mixed. Thereafter, 50 μl of borate buffer (included in Waters AccQ.Tag kit article no. 186003836), 40 μl of 0·4 m-NaOH and 20 μl of reagent (included in Waters AccQ.Tag kit article no. 186003836) were added, mixed and heated for 10 min at 55°C( Reference Boogers, Plugge and Stokkermans 31 ). Amino acid analysis was conducted with HPLC-UV on a 2–3 mm Bischoff Spherisorb ODS II column( Reference Gibson, Vargas and Hogan 24 ). The plasma Trp:LNAA ratio was calculated by dividing plasma Trp concentration by the sum of the other LNAA concentrations, i.e. valine, isoleucine, leucine, tyrosine and phenylalanine. All amino acid ratios are presented as molar weight ratios.
Test battery details
The employed test battery has been described elsewhere( Reference Gibson, Vargas and Hogan 24 ). We describe here those tests in detail that produce significant results. Performance on the following tests did not show significant treatment effects: Rotary Pursuit Task (model 30014A; Lafayette Instruments); Rapid Visual Information Processing Task (CANTABeclipse; Cambridge Cognition Limited); Verbal Recognition Memory Test (CANTABeclipse; Cambridge Cognition Limited); Driver Hazard Perception Test (Oasis Software Limited). In the interest of space, no further details will be given here; however, information about these tasks is available on request from the authors.
Mental and Physical Sensations Scale
The recommended approach to analysing the twenty-eight measures of the MAPSS was first to reduce the number of measures to a smaller number of latent variables or factors using principal component analysis( Reference Rogers, Hohoff and Heatherley 32 ). The principal component analysis was run on all the measures of the MAPSS, treating each time point as a separate case, in order to generate enough cases (n 240) relative to variables to make principal component analysis reliable( Reference Reise, Ventura and Nuechterlein 33 ). The initial solution, with varimax rotation, produced four components with eigen values >1; observation of the scree plot and factor loadings suggested that this four-factor solution was a good fit, explaining 62·3 % of the total variance.
The first two factors were the dominant components (eigen = 10·7 and 3·7; percentage of variance = 25·3 and 15·3, respectively). For each factor, combined variables were computed by averaging scores from all items that loaded >0·50, thus avoiding any items that had lower loadings on more than one factor.
The first factor consisted of the following eleven items (25·3 % of the variance), in the order of loading: ‘fearful/scared/afraid’; ‘anxious/worried/nervous’; ‘tense/on edge’; ‘uneasy/apprehensive/concerned’; ‘panicky/frantic’; ‘agitated/restless/jumpy’; ‘jittery/shaky’; ‘fidgety/twitchy’; ‘stressed’; ‘heart is pounding/racing’; ‘miserable/depressed/dejected’. This factor was labelled ‘anxiety’ (overall mean 1·47). The second factor consisted of seven items (15·3 % of the variance), in order of loading: ‘relaxed/calm/at ease’; ‘tranquil/peaceful’; ‘mentally alert/attentive/observant’; ‘cheerful/happy/contented’; ‘clear-headed’; ‘able to concentrate/focus’; ‘energetic/active/strong/lively’. This factor was labelled ‘well-being’ (overall mean 6·43). The third factor consisted of five items (14·2 % of the variance): ‘sleepy/drowsy/half awake’; ‘fatigued/exhausted/worn out’; ‘muzzy/dazed/spaced out’; ‘headaches/feel headachy’; ‘strange/weird/not my usual self’. This factor was labelled ‘fatigue’ (overall mean 2·26). The fourth factor consisted of three items (7·4 % of the variance): ‘buzzing/feel stimulated/hyper’; ‘mind is racing’; ‘impulsive/spontaneous’. This factor was labelled ‘high energy’ (overall mean 3·08). The remaining two items, ‘hot/sweaty’ and ‘mouth feels dry’, did not load above 0·50 on any factor. Raw data were transformed (natural log or inverse transformation) to achieve skewness between − 1 and +1, where possible. The effects of treatment and differences between groups were analysed by ANOVA, ANCOVA, paired comparisons and t tests.
Affective Go/No-Go Task for emotional processing bias
This test (CANTABeclipse version 3; Cambridge Cognition Limited) consists of several trial blocks, each of which presents a series of words from two of three different affective categories: positive (e.g. happy); negative (e.g. sad); neutral (e.g. element). Words are displayed one at a time in the centre of the screen: each word is displayed for 300 ms, with an interval of 900 ms between words. The participant is given a target category and is asked to press the response pad only when they see a word matching this category. Outcomes are category-specific reaction times, their differences and accuracy.
The Affective Go/No-Go (AGN) Task assesses information-processing biases for positive and negative emotional stimuli by measuring their effects on behavioural inhibition, and is thought to be sensitive to influences on emotional state. For example, depressed people, or Trp-depleted individuals, may show a bias to stronger processing of (attention to) negative stimuli. The test measures the influence of positive, negative and neutral words on decision-making and response control, by requiring participants to press a key as soon as they see target words of one valence (e.g. positive) but not to press in response to ‘distractor’ words of another valence, e.g. negative or neutral. The target and distractor words are presented in several blocks of trials, alternating between positive, negative or neutral targets. Furthermore, some pairs of trials maintain the same target type (non-shift; easier task), whereas others change the target type (shift; harder task).
Dependent variables in the AGN task include latency to respond to the target word: commission errors (when the key is wrongly pressed in response to a distractor word) and omission errors (when the key is not pressed in response to a target word). Each of these can be separated into shift or non-shift block conditions. Data can also be extracted to separately examine the effects of negative, neutral or positive distractors on negative, neutral or positive target responses. Of the participants, three (two from the test drink group and one from the control drink group) were unable to complete the AGN task, so were excluded from the analyses. Having removed these participants, it was noted that the treatment group difference in neuroticism scores (Dutch Personality Inventory) approached significance (control drink: mean 8·4 (sd 6·3); test drink: mean 11·5 (sd 6·1), P< 0·10). Given the potential sensitivity of this test to trait neuroticism, results were checked for any influence of neuroticism. Where this altered significance, the adjusted results are reported.
Facial Emotional Expression Rating Task
This task assesses subjective perception of positive and negative social stimuli, i.e. facial expressions of six basic emotions, i.e. fear, anger, sadness, happiness, surprise and disgust. The task is run on a personal computer using E-Prime and presents the participants with black and white images of a male face, front on, one face at a time( Reference Ekman and Friesen 34 ). The expressions on the face are arrayed in blends of two emotions varying in ratios of 10, 30, 50, 70 and 90 %. Participants were asked to rate each face for the intensity of one of the emotions, on a nine-point scale from 1 = ‘not at all (emotion)’ to 9 = ‘very (emotion)’. Each emotion is blended separately with two others in this way, thus providing an average rating of perceived emotional intensity over ten faces of varying blends. However, the rated response to the two 50 % blends for each emotion (e.g. fear with sadness and surprise) should provide the most reliable measure of perceptual bias, so these were analysed separately. Each face is visible until the participant chooses a response.
The hypotheses that the test drink reduces sensitivity to negative emotional expressions and increases sensitivity to positive emotional expressions were examined. We compared the means of dependent variables for significant differences between the treatment groups on the test day (day 22), after adjusting for baseline performance (ANCOVA). In addition, for the 50 % blend data, one-sample t tests were used to test mean differences from the scale mid-point of 5, as a measure of accuracy of emotional perception.
For this test, subjective ratings of emotional intensities were the dependent variables. Age and NART errors were not included as covariates because they did not differ by treatment. Including trait neuroticism as a covariate did not alter the findings, so the unadjusted results are presented here. The dependent variables and covariates reported here were not skewed, so raw scores were analysed.
Simple reaction time and sustained attention
The simple reaction time (SRT) test allows the measurement of both overall SRT and sustained attention. This test runs on E-Prime, lasts about 8 min, requiring participants simply to press the space bar as quickly as possible whenever they see an asterisk stimulus appear in the centre of the screen. The stimulus is presented in sixty-four trials, with a block of sixteen trials presenting the stimulus at delays of 1, 2, 3, 4, 7, 9, 12 and 15 s, twice per delay, in random order. The treatment effect on sustained attention was examined by averaging reaction times within four bins over the sixty-four trials (1–16, 17–32, 33–48 and 49–64), and analysing changes in reaction times over bins 2 to 4 (trials 17–64), when reactions tend to slow over time. It is also possible to group reaction times into those with ‘short’ (1–4 s) and ‘long’ (7–15 s) delays; however, preliminary analyses found no differences related to this grouping (F< 1), so results are presented for overall averaged reaction times.
Match to Sample Visual Search task
The MTS task (CANTABeclipse; Cambridge Cognition Limited) is a visual pattern matching test, with a speed/accuracy trade-off. It is a visual search task with response latency dissociated from movement time. Efficient performance on this task requires the ability to search among the targets and ignore the distractor patterns, which have elements in common with the target.
The participant is shown a complex visual pattern in the middle of the screen, and then, after a brief variable delay (1–2 s), a varying number of similar patterns are shown around the edge of the screen. Only one of the boxes matches the pattern in the centre of the screen, and the participant must indicate which it is by touching it. There are a total of eighteen test trials: six trials with two choices; six with four choices; six with eight choices. Reaction time is measured as the time from the pattern choices being revealed to the release of the press-pad on which their finger rests between tests. Movement time is measured as the time between the release of the press-pad and touching of the target pattern. The former is therefore primarily a measure of task processing and decision time, whereas the latter reflects response movement control and speed.
Total correct matches and movement time variables were skewed, and so were transformed. ANCOVA were carried out on those transformed variables, but means are presented for untransformed variables, adjusted for covariates (baseline performance, age and NART errors).
Measurement of sleep and evening mood
Participants were asked to record their sleep quality and latency (morning questions), and bedtime mood and alertness aspects (evening questions) on the baseline day (practice), on 2 d immediately before starting the supplement drinks (days 1 and 2), and on pairs of days during each week of treatment (days 4 and 5, days 11 and 12, and days 18 and 19).
This self-completed printed ‘diary’ comprising twenty-two items, sixteen of which were measured on a 100 mm visual analogue scale, was used to assess various aspects of the night's sleep in comparison to usual sleep including sleep quality and latency (morning questions) and bedtime mood and alertness (evening questions). The diaries were intended to assess the impact of chronic treatment on any difference in sleep in the mean of the final 2 d of assessment during treatment (days 18 and 19) while controlling for baseline sleep using the mean of days 1 and 2 (before treatment), and any change in sleep throughout treatment using the mean of days 4 and 5, as well as days 11 and 12.
To analyse the sleep data, an average score was computed for each item from each pair of days (i.e. days 1 and 2, days 4 and 5, days 11 and 12, and days 18 and 19) to improve reliability of the measures. Several items that compared responses to the participants' ‘usual sleep’ were based on the Leeds Sleep Evaluation Questionnaire, which provides a guide to item combinations as previously analysed using factor analysis( Reference Parrott and Hindmarch 35 ). They were combined into composite measures as follows: the mean score of items relating to the question ‘how would you compare getting to sleep last night compared with your usual sleep?’ (harder v. easier; slower v. quicker; less drowsy v. more drowsy) was computed into ‘getting to sleep’; the mean score of items relating to the question ‘how would you rate the quality of sleep last night compared with your usual sleep?’ (more restless v. more restful and awake more v. awake less) was computed into ‘quality of sleep’; finally, the mean score of items relating to the question ‘how did your awakening compare with your usual pattern of awakening?’ (more difficult v. easier and took longer v. shorter) was computed into ‘awakening from sleep’.
In addition, there were several items that were not referenced to ‘usual sleep’, and these were analysed separately. Evening questions relating to mood and alertness were analysed based on Thayer's energetic arousal( Reference Thayer 36 ) (computed as a mean score of items relating to the question ‘how do you feel right now?’ – tired/fatigued v. energetic and drowsy/sleepy v. alert), tense arousal (stressed/tense v. relaxed/calm) and hedonic tone (down/dejected v. happy).
The effect of the treatment was analysed by comparing the means of the dependent variables for differences between the treatment groups on the final pair of days after adjusting for baseline pair of days (days 1 and 2). This was achieved by using ANCOVA, with baseline pair of days (days 1 and 2) as a covariate. Changes throughout the duration of treatment were assessed using repeated-measures ANCOVA, with each pair of days as the within-subjects factor, treatment group as the between-subjects factor, and baseline pair of days (days 1 and 2) as a covariate.
General approach to data analyses
The study hypotheses were tested using ANCOVA to compare the means of the dependent variables for significant differences between the treatment groups on the final test day (day 22), after adjusting for baseline performance used as a covariate. In addition, for the performance tasks, age was used as a covariate and for the reading-dependent AGN and Verbal Recall Memory tests, NART errors were included as a covariate. Differences between the treatment groups at baseline were tested by independent t tests (or Mann–Whitney tests for non-parametric data). Changes in plasma Trp:LNAA ratios were analysed by two-way repeated-measures ANOVA. One-tailed significance levels are reported where results supported directional hypotheses; otherwise, two-tailed levels are given.
Results
Participant characteristics
In the present study, fifty-nine female participants, aged 45–64 years (mean 53·9 (sd 6·3) years), completed pre- and post-treatment test sessions (placebo n 30 and LumiVida™ n 29). Only one participant who had been allocated to the test drink condition failed to arrive for baseline testing and no replacement was recruited. Neither age (t(57) = 0·44) nor NART errors (t(57) = 0·16) differed by treatment group. BMI ranged from 19·4 to 33·9 kg/m2 (mean 25·1 (sd 3·6) kg/m2). BMI for the test drink group was significantly less than that for the control drink group (t(57) = 2·38, P< 0·05, two-tailed). Nevertheless, inclusion of BMI as a covariate did not alter the effects of treatment on Trp or Trp:LNAA levels, so BMI was not considered further. Moreover, the groups were indistinguishable from each other with respect to the measures of impulsivity, aggression, anxiety/depression and neuroticism. Using partial correlations controlling for body weight, the only trait negatively related to the baseline Trp:LNAA ratio was anxiety (Depression Anxiety and Stress Scale (twenty-one items): partial r(50) − 0·28, P< 0·025, one-tailed). Of the participants, 81 % were non-smokers, the remainder being ex-smokers for at least 1 year. The treatments were well tolerated: the tolerability post-treatment symptom checklist, scored 0 = ‘not at all’ to 4 = ‘very often’, revealed a very low average occurrence of symptoms (control drink: mean 0·25 (sd 0·29) and test drink: mean 0·13 (sd 0·21)), i.e. test drink treatment resulted in slightly fewer symptoms (t(57) = 1·74, P= 0·09, two-tailed), if at all.
Compliance was controlled by asking the participants to record any missed treatment drinks during the treatment period. There was no significant difference between the groups in respect of compliance, and numbers of missed drinks did not correlate with any of the plasma assay outcome variables, nor was it a significant covariate in ANCOVA (either as an ordinal or a dichotomous variable).
Effects of the chronic intervention drinks on plasma tryptophan concentrations and plasma tryptophan:large neutral amino acid ratios
At baseline, blood was not successfully obtained from two participants in the control drink group and two in the test drink group. In addition, on test day 2, the blood sample was not available for three (two new) participants from the control drink group and one from the test drink group. The samples were assayed in duplicate. Intra-assay CV for Trp were less than 4 %, indicating a highly reliable assay. Data distributions were adequately normal for parametric analyses.
Pre- and post-treatment levels of plasma Trp (samples 1 and 2) revealed that the baseline levels (sample 1) did not differ between the treatment groups (one-way ANOVA, group effect: F(1, 53) < 1, variance explained
 $$\eta _{p}^{2} $$
= 0·001, NS).
$$\eta _{p}^{2} $$
= 0·001, NS).
Any change in the levels of Trp over the treatment period was examined by two-way repeated-measures ANOVA, with pre/post-treatment as the repeated-measures factor (samples 1 and 2) and treatment condition as the between-subjects factor. There was no change in the levels of Trp from before to after chronic treatment (pre/post-treatment effect: F(1, 51) = 1·24,
$$\eta _{p}^{2} $$
= 0·024, NS). There was also no significant interaction between pre/post levels and treatment condition (F(1, 51) = 1·30,
$$\eta _{p}^{2} $$
= 0·025, NS), despite a slight increase in mean Trp levels in the test drink group.
The impact of the treatment condition on any short-term change in plasma Trp levels from before to 90 min after a single treatment drink on the final test day was examined using two-way ANCOVA on the second and third Trp samples, with sample 1 Trp levels as the covariate, i.e. testing for the treatment effect adjusted for any influence of baseline levels. Baseline (sample 1) Trp levels were a significant covariate (F(1, 43) = 30·67, P< 0·001,
$$\eta _{p}^{2} $$
= 0·42). Treatment had a significant overall effect on plasma Trp levels (ANCOVA, group effect: F(2, 41) = 3·38, P< 0·05,
$$\eta _{p}^{2} $$
= 0·073). Trp levels did not change significantly from before to after taking the final drink (pre/post-treatment effect: F< 1), irrespective of the treatment condition (interaction effect: F< 1). However, the test drink increased the levels of Trp relative to the control drink on the final test day, adjusted for baseline levels (control drink: overall mean 30·1 (sd 4·2) and test drink: overall mean 32·4 (sd 4·2).
The assessment of plasma Trp:LNAA pre- and post-treatment ratios (samples 1 and 2; Table 2) revealed that the baseline ratio (sample 1) did not differ between the treatment groups (one-way ANOVA, group effect: F(1, 53) = 1·22, variance explained
$$\eta _{p}^{2} $$
= 0·023, NS).
Table 2 Plasma tryptophan:large neutral amino acid ratios for sample 1 (pre-treatment) and sample 2 (post-treatment, pre-test) (Mean values and standard deviations)
Any changes in Trp:LNAA ratios over the treatment period were examined by two-way repeated-measures ANOVA, with pre/post-treatment as the repeated-measures factor (samples 1 and 2) and treatment condition as the between-subjects factor. There was no change in the Trp:LNAA ratio from before to after either treatment (pre/post-treatment effect: F(1, 51) < 1,
$$\eta _{p}^{2} $$
= 0·005, NS). There was also no significant interaction between pre/post levels and treatment condition (F(1, 51) < 1,
$$\eta _{p}^{2} $$
= 0·002, NS; Table 2).
The impact of the treatment condition on short-term changes in plasma Trp:LNAA ratios from before to 90 min after a single treatment drink on the final test day was examined using two-way ANCOVA on the second (i.e. day 22, before treatment) and third (i.e. day 22, 90 min after treatment) plasma samples, with baseline (sample 1) ratio as the covariate, i.e. testing for the treatment effect adjusted for any influence of baseline levels. Baseline ratios were a significant covariate (F(1, 43) = 17·96, P< 0·001,
$$\eta _{p}^{2} $$
= 0·30). The overall effect of the treatment on the Trp:LNAA ratio (unlike on Trp levels) did not reach significance on the final test day, adjusted for baseline levels (control drink: overall mean 0·080 (sd 0·010) and test drink: overall mean 0·084 (sd 0·010); ANCOVA, group effect: F (1, 41) = 1·77, P< 0·10,
$$\eta _{p}^{2} $$
= 0·040). However, there was a significant effect of the treatment on the change in Trp:LNAA ratios from before to after consuming the final drink (treatment × pre/post interaction effect: F(1, 43) = 4·43, P< 0·025,
$$\eta _{p}^{2} $$
= 0·093). The test drink slightly increased the ratio (t(23) = 1·03, NS), whereas the ratio declined after consumption of the control drink (t(23) = 2·42, P< 0·05, two-tailed) (Fig. 1).

Fig. 1 Effects of the chronic supplement drinks on plasma tryptophan:large neutral amino acid (Trp:LNAA) ratios on the final test day. Values are means, with their standard errors represented by vertical bars. * Mean value was significantly different from that of sample 2 (post-treatment, before the final drink) in the control drink treatment (P< 0·05). a,bMean values with unlike letters were significantly different between the treatments for sample 3 (P< 0·025; t(46) = 2·07). –○–, Control drink; –●–, test drink.
Effects of the chronic intervention drinks on Mental and Physical Sensations subscales
The mean ratings of anxiety were generally low ( < 2 on the nine-point scale on average) throughout the study. However, anxiety declined from test day 1 to the final test day, as assessed by the analysis of the first (pre-test) measurements on each day. These measures did not differ between the treatment groups, and there was no interaction between changes over days and treatment.
The raw scores of fatigue were positively skewed and so were Ln-transformed. Fatigue scores were generally low, with means ranging from 1·84 to 2·76. The baseline levels on test day 1 did not differ between the treatment groups, and treatment condition had no effect on fatigue on the final test day.
In contrast to the aforementioned subscales, a significant effect of the treatment was observed for high-energy ratings on the final test day (Fig. 2). High-energy raw scores were well distributed and did not require transformation. The baseline levels (first measurement) did not differ between the treatment groups (one-way ANOVA, group effect: F(1, 57) < 1, variance explained
$$\eta _{p}^{2} $$
= 0·007, NS; Table 3).
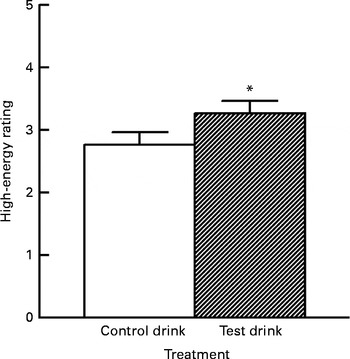
Fig. 2 Effects of the chronic supplement drinks on overall ratings for ‘high energy’ on the final test day (collapsed across the three ratings). Values are means (adjusted for baseline levels), with their standard errors represented by vertical bars. * Mean value was significantly increased compared with the control drink treatment (P< 0·05; one-tailed).
Table 3 Effects of the treatment drinks on high-energy mood state (Mean values and standard deviations)
* Mean values were adjusted for baseline levels using ANCOVA.
Treatment condition had a small but significant effect on energy levels on the final test day, with higher overall energy ratings following the chronic test drink treatment than after the control drink treatment, adjusted for baseline levels (ANCOVA, treatment effect: F(1, 54) = 3·12, P< 0·05, one-tailed,
$$\eta _{p}^{2} $$
= 0·055; Fig. 2). There was no significant change over the three measurement points (F(2, 108) < 1,
$$\eta _{p}^{2} $$
= 0·001, NS). There was also no interaction of treatment condition and measurement point (F(2, 108) < 1,
$$\eta _{p}^{2} $$
= 0·014, NS; see adjusted means in Table 3).
Effects of the chronic intervention drinks on the Affective Go/No-Go Task for emotional processing bias
We tested the hypothesis that the chronic test drink treatment would shift emotional processing bias away from negative towards positive bias, i.e. negative stimuli would become less distracting, or their processing would be inhibited. Means of the dependent variables were compared for significant differences between the treatment groups on test day 2 (day 22), after adjusting for baseline performance. This was achieved using ANCOVA, with day 1 performance as a covariate. In addition, age and, for the reading-dependent AGN Task, errors on the NART (a measure of English verbal IQ) were included as covariates. These latter variables did not differ by treatment group, but could still contribute to variance in performance, which is heavily dependent on the speed of reading and reaction time. Where AGN data were skewed > ± 1, each variable was transformed appropriately, e.g. positive skew reduced by inverse or natural log (Ln) transformation, before analysis.
It was predicted that the treatment would affect response latency such that participants respond faster to positive words with negative and/or neutral distractors if the treatment reduced bias to negative stimuli. Conversely, a slower response to negative target words could suggest an increased bias to positive distractors, or increased processing of negative stimuli, i.e. a reduction in the avoidance of negative stimuli.
First, overall response latencies were tested for any effect of the treatment, irrespective of the stimulus word valence. This comparison revealed no overall effect of the treatment (F(1, 51) = 1·09, NS,
$$\eta _{p}^{2} $$
= 0·021). The impact of the treatment was then examined on trials with positive targets (shift, non-shift, negative or neutral distractors, or both). There were no differences in positive target latencies attributable to treatment condition (all F< 1).
For negative targets, the following treatment effects were observed: for negative target trials, overall, there was evidence that the test drink slowed down the latency to respond to the target word (F(1, 50) = 3·98, P< 0·05, one-tailed,
$$\eta _{p}^{2} $$
= 0·074; Table 4), adjusted for trait neuroticism. This effect was stronger for non-shift trials (F(1, 50) = 6·13, P< 0·01, one-tailed,
$$\eta _{p}^{2} $$
= 0·11; Table 4), and strongest for negative targets v. neutral distractors only (F(1, 50) = 8·42, P< 0·005, one-tailed,
$$\eta _{p}^{2} $$
= 0·14; Fig. 3), whereas response latencies for negative targets v. positive distractors only were not altered by treatment (F< 1).
Table 4 Effects of the treatment drinks on response latencies (ms) to negative target words, with differing distractors (Mean values with their standard errors)
Mean value was significantly different from that of the control drink treatment: * P< 0·05, ** P< 0·01 (one-tailed).
† Mean values were adjusted for baseline performance, age, National Adult Reading Test errors and neuroticism.

Fig. 3 Effect of the chronic supplement drinks on latencies to respond to negative target words (with neutral distractor words only; shift and non-shift trials). Values are means (adjusted for baseline performance, neuroticism, age and National Adult Reading Test errors), with their standard errors represented by vertical bars. * Mean value was significantly increased compared with the control drink treatment (P< 0·02).
Very few commission or omission errors were made. Thus, because of the low numbers of such errors, no difference was found between the treatment groups.
Effects of the chronic intervention drinks on the Facial Emotional Expression Rating Task
The treatment condition significantly altered the rated intensity of the expression of anger in 50 % blended faces, such that the rated intensity of anger was less after the test drink than after the control drink, and the mean rating was more accurate, being closer to the mid-point of 5 (representing 50 % anger) (one-way ANCOVA: F(1, 56) = 6·13, P= 0·016,
$$\eta _{p}^{2} $$
= 0·099; Table 5). For the overall average rating of the expression of anger across all the percentages of blends, there was no effect of the treatment condition (F< 1, NS,
$$\eta _{p}^{2} $$
= 0·012).
Table 5 Effects of the treatment drinks on the ratings of emotional expressions with 50 % blends (Mean values with their standard errors over ten blends)
* Mean value was significantly different from that of the control drink treatment (P< 0·05).
† Mean values were adjusted for baseline performance.
There was a significant effect of the treatment condition on the ratings of overall happiness (F(1, 56) = 4·24, P= 0·044,
$$\eta _{p}^{2} $$
= 0·07): rated perception of happiness was greater after the test drink than after the control drink (Table 6), whereas no significant effect of the treatment condition on happiness ratings was observed for 50 % blended faces (F< 1, NS,
$$\eta _{p}^{2} $$
= 0·007; Table 5).
Table 6 Effects of the treatment drinks on the total ratings of emotional expressions (Mean values with their standard errors over ten blends)
* Mean value was significantly different from that of the control drink treatment (P< 0·05).
† Mean values were adjusted for baseline performance.
There was no effect of the treatment on the expression of sadness, fear or disgust. There was a weak effect of the treatment condition on the ratings of the expression of surprise for 50 % blends (F(1, 56) = 3·46, P< 0·07, two-tailed,
$$\eta _{p}^{2} $$
= 0·06); the rated intensity of surprise tended to be greater after the test drink than after the control drink. For the overall rating of the expression of surprise, there was no effect of the treatment condition (F< 1, NS,
$$\eta _{p}^{2} $$
= 0·01).
Effects of the chronic intervention drinks on sleep and evening mood
Quality of sleep (e.g. ‘How would you rate the quality of sleep last night compared with your usual sleep?’ – composite measure) was marginally altered by the test drink treatment (one-way ANCOVA, condition: F(1, 56) = 2·52, P< 0·06, one-tailed,
$$\eta _{p}^{2} $$
= 0·043). There was a tendency for a better quality of sleep, compared with the usual sleep experienced, at the end of the chronic treatment with the test drink compared with the control drink (Table 7).
Table 7 Effects of the treatment drinks on the quality of sleep and difficulty in getting up throughout the duration of the treatment (100 mm scale) (Mean values with their standard errors)
* Mean values were adjusted for baseline levels.
The quality of sleep at different intervals during the treatment showed a weak interaction between time interval during treatment and condition (F(1·78, 99·66) = 2·40, P< 0·05, one-tailed,
$$\eta _{p}^{2} $$
= 0·041); as sphericity is not assumed, adjustment was made using Greenhouse–Geisser degrees of freedom. These results showed that the quality of sleep tended to improve over the duration of the treatment after the test drink compared with the control drink (Table 7).
Similar to the composite measure, the treatment condition marginally altered the quality of sleep (simple measure: ‘How would you rate the quality of sleep last night?’) (post-treatment, one-way ANCOVA, condition: F(1, 56) = 1·91, P< 0·09, one-tailed,
$$\eta _{p}^{2} $$
= 0·03). There was a tendency for a better quality of sleep experienced after the test drink than after the control drink.
Moreover, ‘difficulty in getting up’ (‘How difficult was it to get up this morning?’ – ‘not at all’ to ‘extremely’) showed a weak interaction between time interval during the treatment and condition (F(2, 112) = 2.96, P< 0·03, one-tailed,
$$\eta _{p}^{2} $$
= 0·05). Self-rated ‘difficulty in getting up’ increased slightly over the duration of the treatment after the test drink, whereas after the control drink treatment, a mid-treatment increase in difficulty then returned to baseline levels (Table 7). However, there was no difference between the treatment conditions for ‘difficulty in getting up’ on the last pair of days (F(1, 56) < 1, NS,
$$\eta _{p}^{2} $$
= 0·004).
The treatment condition marginally altered hedonic tone (‘How do you feel right now’ – ‘down/dejected’ to happy) (post-treatment, one-way ANCOVA, condition: F(1, 56) = 2·29, P< 0·07, one-tailed,
$$\eta _{p}^{2} $$
= 0·04). A tendency for greater self-rated happiness was experienced after the test drink than after the control drink. This was supported by a significant overall greater happiness (hedonic tone) experienced in the test drink group during the chronic treatment, adjusted for baseline levels and unaffected by time (F< 1), compared with the control drink group (F(1, 56) = 4·11, P< 0·05,
$$\eta _{p}^{2} $$
= 0·07; Table 8).
Table 8 Effects of the treatment drinks on overall hedonic tone during the treatment (100 mm scale) (Mean values with their standard errors)
* Mean value was significantly different from that of the control drink treatment (P< 0·05).
† Mean values were adjusted for baseline levels.
The treatment condition marginally altered the number of episodes of waking in the night (‘How many times did you wake restless during the night?’) (one-way ANCOVA: F(1, 56) = 2·21, P< 0·07, one-tailed,
$$\eta _{p}^{2} $$
= 0·04), indicating a tendency for fewer times waking after the test drink than after the control drink.
No further effects of the treatment were observed on the measures of daily performance such as waking early and not getting back to sleep again, feeling refreshed in the morning, feeling of energetic arousal, tense arousal and latency to fall asleep.
Effects of the chronic intervention drinks on cognitive performance
Cognitive variable means were compared between the treatment groups on test day 2 (day 22), after adjusting for baseline performance using ANCOVA, with day 1 (baseline) performance as a covariate. In addition, age and NART errors were included as covariates as appropriate. The latter variables did not differ by treatment group, but could still contribute to variance in performance.
Simple reaction time task
In the SRT task, repeated-measures ANCOVA was used for the measure of sustained attention, i.e. change in reaction times over the last three quartiles of trials during the task period for test day 2, but adjusted for test day 1 reaction times. Data normality was examined and where data were skewed > ± 1, each variable was transformed appropriately, e.g. positive skew reduced by natural log (Ln) or inverse transformation, before analysis.
The treatment condition significantly affected the SRT and sustained attention performance. Preliminary analyses (on the data of each day separately) confirmed that the first block (trials 1–16) may be regarded as a practice trial while participants adjust to the task. In the second block (trials 17–32), participants showed the fastest reactions, and reaction time then lengthened over the remaining blocks, indicating fatigue and failure of sustained attention (one-way repeated-measures ANOVA, effect of trial bins on unadjusted reaction times: day 1 F(2, 114) = 9·60, P< 0·001; day 2 F(2, 114) = 6·55, P< 0·005). The test drink treatment resulted in significantly shorter SRT compared with the control drink treatment on test day 2 (adjusted for baseline levels) (F(1, 51) = 3·74, P< 0·05, one-tailed,
$$\eta _{p}^{2} $$
= 0·068; Fig. 4). The treatment did not significantly affect the change in reaction times over the trials (condition × bin interaction effect: F(2,102) = 1·31, NS,
$$\eta _{p}^{2} $$
= 0·025). However, these results are adjusted for age, NART errors and test day 1 reaction times, and these adjustments removed the significance of the lengthening of reaction times that would indicate a test of sustained attention (trial bin effect: F(2, 104) < 1, NS,
$$\eta _{p}^{2} $$
= 0·011). After removing non-significant covariates in this model, the test drink treatment still resulted in significantly shorter reaction times (F(1, 55) = 4·98, P< 0·02, one-tailed). The unadjusted effect of bin was significant (F(2, 112) = 6·56, P< 0·01,
$$\eta _{p}^{2} $$
= 0·105), with average reactions for bins (blocks) 3 and 4 being slower than that for bin 2 (Bonferroni-adjusted comparisons: P< 0·05 and P< 0·001, respectively).

Fig. 4 Effect of the chronic supplement drinks on changes in simple reaction times over three trial blocks (sustained attention). Values are means (adjusted for baseline performance, age, National Adult Reading Test errors and test day 1 reaction times at each trial block), with their standard errors represented by vertical bars. a,bMean values with unlike letters were significantly different between the treatments (P< 0·05, one-tailed). The decline in reaction time over blocks (sustained attention) was not significantly altered by the test drink treatment, although the reaction times on the final block of trials were shorter after the test drink treatment (F(1, 52) = 3·85). –○–, Control drink; –▲–, test drink.
Match to Sample Visual Search task
In the MTS task, the effects on overall total correct matches were unaffected by the treatment. At each MTS test session, participants performed eighteen trials. The average accuracy was very good, achieving at least seventeen mean correct matches. Therefore, this outcome was unlikely to be sensitive to improved performance, which was reflected in a lack of treatment effect (ANCOVA, group effect: F(1, 54) < 1, NS,
$$\eta _{p}^{2} $$
= 0·007; Table 9).
Table 9 Effects of the treatment drinks on total correct pattern matches, reaction times and movement times (Mean values with their standard errors)
* Mean value was significantly different from that of the control drink treatment (P< 0·05).
† Mean values were adjusted for baseline performance, age and National Adult Reading Test errors.
However, the treatment significantly increased the speed of the overall reaction for correct target choices (first attempt) compared with the control drink treatment (ANCOVA, group effect: F(1, 54) = 3·97, P= 0·025, one-tailed,
$$\eta _{p}^{2} $$
= 0·068; Table 9). Moreover, the test drink treatment resulted in shorter overall movement times for correctly chosen targets, but did not differ significantly from the control drink treatment (ANCOVA, group effect: F(1, 54) < 1, NS,
$$\eta _{p}^{2} $$
= 0·006; Table 9).
The most demanding MTS trials were those with eight possible target choices. These trials are more likely to be sensitive to improvement, so their outcomes were examined separately. Reaction times with eight choices were significantly shorter after the test drink (ANCOVA, group effect: F(1, 54) = 4·88, P< 0·02, one-tailed,
$$\eta _{p}^{2} $$
= 0·083; Fig. 5(A)). The test drink treatment also reduced movement times with eight choices, but this change was a non-significant trend only (ANCOVA, group effect: F(1, 54) = 2·20, P= 0·07, one-tailed,
$$\eta _{p}^{2} $$
= 0·039; Fig. 5(B)).

Fig. 5 Effect of the test drink v. control drink treatment on reaction (A) and movement (B) times in the Match to Sample Visual Search task with eight choices. Values are means (adjusted for baseline performance, age and National Adult Reading Test errors), with their standard errors represented by vertical bars. * Mean value was significantly different from that of the control drink treatment (P< 0·02). Means of raw movement time are presented, although data were Ln-transformed for the analysis.
We also compared the effects of the treatment drinks on reaction and movement times for tasks with eight v. two target choices because the outcome of this comparison assesses the impact of the complexity of additional target choices (eight v. two) on response times. The treatment significantly affected the slowing of reaction times from two to eight choices, with less slowing after the test drink, reflecting shorter reaction times compared with the control drink in the eight-choice task (ANCOVA, group effect: F(1, 54) = 5·34, P< 0·02, one-tailed,
$$\eta _{p}^{2} $$
= 0·090; Table 10).
Table 10 Effects of the treatment drinks on the increase in reaction and movement times for eight v. two target choices (Mean values with their standard errors)

* Mean value was significantly different from that of the control drink treatment (P< 0·02).
† Movement data were transformed for the analysis.
‡ Mean values were adjusted for baseline performance, age and National Adult Reading Test errors.
Similarly, the test drink treatment resulted in less slowing in movement time from two to eight choices, but reached only borderline significance (ANCOVA, group effect: F(1, 54) = 2·44, P= 0·06, one-tailed,
$$\eta _{p}^{2} $$
= 0·043; Table 10). These data were skewed and so were analysed as square-root-transformed data.
We did not observe any significant effects of the treatment on the following cognitive tests, mostly because of the high levels of performance already on the baseline day: Rotary Pursuit Task; Rapid Visual Information Processing Task; Verbal Recognition Memory Task; Driver Hazard Perception test.
Discussion
The results of the present study show that in healthy older women, low-dose LumiVida™ (the Trp-rich test drink) intake resulted in an immediate, temporary significant increase of the Trp:LNAA ratio and in modest, but significant, improvements in specific aspects of mood and cognition.
Participants took two doses of 0·5 g LumiVida™, each containing approximately 35 mg bioavailable Trp, every day for 19 d in the morning and evening between meals. Published data suggest that LumiVida™ is a source of bioavailable Trp and substantially more efficient in raising the Trp:LNAA ratio than α-lactalbumin or pure Trp( Reference Markus, Firk and Gerhardt 19 , Reference Mitchell, Slettenaar and Quadt 20 ). The amount of Trp consumed (0·07 g/d) in the present study is much smaller than that consumed in previous studies that tested LumiVida™( Reference Firk and Markus 22 , Reference Kroes, van Wingen and Wittwer 23 ) or directly assessed the effects of Trp supplementation( Reference Booij, Van der Does and Haffmans 6 , Reference Silber and Schmitt 9 , Reference Harmer, Rogers and Tunbridge 13 , Reference Markus, Firk and Gerhardt 19 ). Despite the small dose of Trp, our data show that intake of a single 0·5 g dose resulted in a temporary and significant rise in the Trp:LNAA ratio compared with the control condition at test day 2. This effect on the Trp:LNAA ratio is in line with previous studies showing an elevation of the Trp:LNAA ratio in human plasma that reached maximum levels approximately 90 min after the intake of LumiVida™( Reference Markus, Firk and Gerhardt 19 , Reference Mitchell, Slettenaar and Quadt 20 ). These results suggest that relative to the control treatment, each drink has the potential to raise Trp entry to the brain and is thus likely to enhance serotonin synthesis and serotonergic function. Nevertheless, we acknowledge that there is no direct evidence for this low-dose regimen showing such effects.
However, we did not observe any accumulative increase in the Trp:LNAA ratio during the 19 d course of the study. Indeed, the Trp:LNAA ratio, measured in the morning before the intake of the supplement drinks, was indistinguishable at baseline and on the test day, confirming the rapid rise in Trp:LNAA levels after supplementation and the normalisation of the levels within 2 h after the intake as described previously( Reference Markus, Firk and Gerhardt 19 , Reference Mitchell, Slettenaar and Quadt 20 ).
A principal component analysis reduced the rated items on the MAPSS to four subscales: ‘anxiety’; ‘well-being’; ‘fatigue’; ‘high energy’ (or stimulation). The MAPSS measures( Reference Rogers, Hohoff and Heatherley 32 ) were taken at baseline, mid-test and post-test on each of the test days. This allows the impact of the chronic treatment to be separated to some extent from the acute effects of the final drink on the second test day. There was an overall effect of the test drink on the ‘high-energy’ measure after the chronic treatment that suggests an arousing or stimulating effect of this low dose of LumiVida™. This measure was composed of items such as ‘buzzing’, ‘feel stimulated’, ‘mind is racing’ and ‘spontaneous’. These sorts of sensations are usually linked to the stimulatory action of sympathomimetic activation, including noradrenaline, adrenaline and caffeine( Reference Rogers, Hohoff and Heatherley 32 , Reference Cadeddu, Ibba and Sadile 37 ). Since the ‘high-energy’ measure included terms related to arousal and alertness, this effect on mood might reflect a slight stimulant effect of the LumiVida™ treatment. Therefore, it is notable that a recent study has reported dose-dependent increases in noradrenaline and dopamine in the rat brain following the administration of the selective serotonin reuptake inhibitor antidepressant drugs, citalopram and fluoxetine( Reference Cadeddu, Ibba and Sadile 37 ). The authors have suggested that these effects must be a consequence of the ability of the drugs to increase synaptic serotonin as they do not have significant affinity for catecholamine transporter sites.
Our findings are most appropriately compared with previous research using healthy participants, as opposed to those with a (family) history of affective disorders. All studies reporting the positive effects on mood after Trp manipulation supplemented substantially higher doses of Trp and thus induced greater changes in the Trp:LNAA ratio( Reference Charney, Heninger and Reinhard 38 ). In contrast, many studies have been unsuccessful in providing evidence for mood improvement by Trp( Reference Merens, Booij and Markus 39 , Reference Scrutton, Carbonnier and Cowen 40 ), and others have demonstrated benefits to mood that depended on social behaviour( Reference Young 10 ). This apparent inconsistency in finding an effect may be caused by varied test parameters across different studies. In that respect, the MAPSS measure used here appears to be particularly sensitive in detecting Trp-induced changes.
Emotional processing and sensitivity were significantly affected by the test drink, suggesting a shift in bias away from negative stimuli as also partially observed after acute treatment in a similar cohort( Reference Gibson, Vargas and Hogan 24 ). A large body of literature has examined the role of serotonin in emotional processing, even though mostly in conditions related to affective disorders such as depression and anxiety( Reference Robinson, Cools and Crockett 3 – Reference Cowen 5 ). Low serotonergic activity is believed to result in bias towards negative stimuli( Reference Cowen 5 , Reference Harmer 41 ). Tests of emotional processing, therefore, compare responses to negative v. positive stimuli such as the speed and accuracy of recognition of pleasant and unpleasant emotional expressions or responses to target and distractor emotional words( Reference Mathews and MacLeod 12 ). The AGN Task found a reliable slowing of responses to negative words, including when the distractor words were only neutral, suggesting a disengagement with (less attention to) such negative emotional stimuli. This contrasts, to some extent, with the stronger sub-chronic pharmacological enhancement of serotonergic neurotransmission in rats, which resulted in the facilitation of positive feedback learning, i.e. increased reward sensitivity( Reference Bari, Theobald and Caprioli 42 ), although our findings are compatible with sub-chronic experimental antidepressant treatment in humans( Reference Harmer, Rogers and Tunbridge 13 ). These findings are broadly consistent with other evidence from studies of Trp supplementation( Reference Silber and Schmitt 9 , Reference Harmer, Rogers and Tunbridge 13 ).
The results for the AGN Task are supported by the findings of the Facial Emotional Expression Rating Task of the blended faces. In the 50 % blended Facial Emotional Expression Rating Task, the rating of anger was significantly less after the test drink, and for overall expression ratings, the test drink treatment significantly increased the ratings of happiness. The marginally increased bias to perceive surprise in the 50 % blends may reflect the fact that for half of these stimuli, surprise was blended with fear, which can be confused with surprise( Reference Ekman and Friesen 34 ), so slightly less sensitivity to fear compared with the control drink group may have resulted in a greater perception of surprise. Taken together, participants seemed to benefit from the supplementation of the test drink supplementation by a positive shift in their perception of emotions – a process thought to be protective against depression( Reference Robinson and Sahakian 4 ). These data agree with the results from published studies that examined Trp loading in healthy individuals. In one study, acute oral Trp dosing has been shown to enhance the recognition of both happy and fearful faces( Reference Attenburrow, Williams and Odontiadis 18 ). In another study, Trp supplementation for 14 d has been shown to increase the recognition of happiness, decrease the recognition of disgust and reduce the attention to negative stimuli, suggesting a shift in bias towards positive stimuli( Reference Murphy, Longhitano and Ayres 43 ). Functional MRI after oral Trp supplementation has shown that Trp affects brain activation associated with an induction of a positive bias in the processing of emotional faces in women( Reference Murphy, Longhitano and Ayres 43 ).
In agreement with this literature, our findings are best interpreted as test drink supplementation increasing serotonergic activity, thus leading to a potential antidepressant-like activity and a shift in emotional processing away from negative bias, and suggest that the test drink improves mood and may confer resistance to depressive episodes. This interpretation is in line with the results of previous studies using higher LumiVida™ doses and fits well with our working hypothesis that an increase in the Trp:LNAA ratio increases brain serotonin levels and functional serotonin activity.
High doses of Trp have been reported to increase melatonin synthesis and induce sedation( Reference Sobczak, Riedel and Booij 7 , Reference Spinweber, Ursin and Hilbert 44 ). Thus, theoretically, Trp loading may also be able to interfere with cognitive or motor performance. We did not, however, expect a sedative effect by the low dose used in the present study. The Rotary Pursuit Task, which is a measure of psychomotor performance, was unaffected by the test drink, clearly suggesting a lack of sedation in the present study. Also, LumiVida™ did not alter the performance on the Driver Hazard Perception test, reflecting the minimal effects on attention. Trp loading may have some adverse effects such as nausea( Reference Scrutton, Carbonnier and Cowen 40 ); however, these effects are likely to occur at much higher doses than the doses that we tested in the present study( Reference Silber and Schmitt 9 ). Moreover, we previously showed that an acute high dose of LumiVida™ (12 g) is well tolerated and improves mood( Reference Markus, Firk and Gerhardt 19 , Reference Kroes, van Wingen and Wittwer 23 ).
Serotonin is central to the regulation of sleep, and high doses of Trp and α-lactalbumin have been shown to improve the measures of quality and the impact of sleep( Reference Silber and Schmitt 9 , Reference Hartmann 45 , Reference Markus, Jonkman and Lammers 46 ). This chronic study of supplementing a low dose of LumiVida™ resulted in a somewhat stimulatory effect during the morning. Therefore, it is not surprising that, despite marginal improvements in the quality of sleep, these may still be meaningful effects. It remains to be seen whether improved sleep might be raising the perceived levels of energy the next morning. Furthermore, participants on the test drink (0·5 g LumiVida™ twice per d) consistently reported feeling happier than those on the control treatment, before going to bed. This may be associated with the positive effects on emotional processing discussed above.
Serotonin and Trp loading have also been implicated in cognitive functions( Reference Silber and Schmitt 9 ). In agreement with this, we found modest beneficial effects on the aspects of executive function: the results from both simple and complex (decision) reaction time tasks showed that the test drink speeded up reactions and decision-making while maintaining accuracy. There was also evidence that, under certain conditions, the treatment may improve sustained attention. Interestingly, this result is compatible with the stimulatory effect on mood ratings reported in three different tests, namely the MAPSS, the AGN Task and the sleep diary. It is also consistent with a recent report demonstrating that serotonergic antidepressants can increase brain noradrenaline levels( Reference Cadeddu, Ibba and Sadile 37 ).
The positive benefits observed here on mood and cognitive function were subtle and, in part, varied from the results of acute treatment( Reference Gibson, Vargas and Hogan 24 ). Pharmacokinetic dose–response data would predict only a slight impact of this low dose on plasma amino acids( Reference Mitchell, Slettenaar and Quadt 20 ). In addition, the observed effects of the chronic treatment could also be due to functional changes in serotonin receptor expression( Reference Sharp and Cowen 47 ). Furthermore, the fact that after acute treatment the lowest dose was most effective( Reference Gibson, Vargas and Hogan 24 ) is in agreement with our data showing that a long-term but low dose supplementation was not only beneficial in the same areas of cognitive functions but also conveyed additional benefits that, even though similar, do not necessarily need to be identical to the benefits observed after acute treatment. For example, the sustaining of well-being and the prevention of fatigue observed after consuming 2 g LumiVida™ during acute testing was not observed after the chronic treatment. One explanation for this apparent discrepancy may lie in the fact that separating test days by 3 weeks in the present chronic study was less demanding on mental resources. Unlike other studies of dietary effects on cognition and mood, participants were permitted to consume their usual caffeinated drink on the morning of testing, so that the negative performance and mood effects of caffeine withdrawal could be avoided( Reference James and Rogers 48 ). The stimulatory effects of caffeinated drinks might have mitigated any beneficial impact on sleep latency and quality, although small beneficial effects of chronic low-dose LumiVida™ on sleep quality, and evening mood, were found. It may be anticipated that greater sleep benefits would arise if dosing was restricted to the evening.
Consistent with accumulating evidence from studies modulating serotonin function( Reference Robinson and Sahakian 4 , Reference Silber and Schmitt 9 , Reference Murphy, Longhitano and Ayres 43 ) and in agreement with our own data after acute treatment, the most reliable effects of the test drink have been on the processing of emotionally relevant stimuli. These effects are in line with the antidepressant function of enhanced serotonin neurotransmission, i.e. a shift in processing bias from negative towards positive stimuli( Reference Bari, Theobald and Caprioli 42 , Reference Sharp and Cowen 47 ).
One limitation of the present study was restriction of participants to middle-aged women, who are more likely to be susceptible to dietary Trp manipulation than men( Reference Silber and Schmitt 9 , Reference Murphy, Longhitano and Ayres 43 ). Also, there was no fasted-only condition, i.e. all comparisons are made to a casein hydrolysate control treatment, which, while matching for energy and protein intake and regularly used as the control, may not be inert on the behaviours considered here. However, the casein hydrolysate control treatment did not affect the Trp:LNAA ratio at any time point; thus, a comparison to a fasted-only condition would have exaggerated the beneficial effects of the test drink due to the nutritional effect of our Trp-rich protein hydrolysate. The present study was not designed to examine whether the observed weak changes in plasma amino acids and the increased release of serotonin are the sole mechanism of action. In theory, this pattern of results could also depend on individual differences in the susceptibility of brain serotonin function to dietary manipulation, although this was not indicated by the personality measures examined here. A possible role of serotonin transporter receptor gene polymorphisms remains to be explored in our cohort.
In summary, these findings allow the conclusion that daily consumption of a low dose of LumiVida™ has modest beneficial effects on emotional processing, hedonic tone and reaction time; promotes feelings of mental energy, particularly during demanding times; and may result in a marginal improvement in sleep quality.
Acknowledgements
The present study was supported by a grant from DSM Nutritional Products Limited, Kaiseraugst, Switzerland.
The present study was funded by a grant from DSM Nutritional Products Limited. The sponsors had no role in the conduct of the experiments, statistical analyses or interpretation of the results.
The authors' contributions are as follows: E. L. G., P. J. R., J. W., M. H. M., A. H. and R. G. contributed to the design conception; K. V. and E. H. were involved in the acquisition of the data; E. L. G., P. J. R. and A. H. performed the analysis and interpreted the data. All authors contributed to the preparation of the manuscript.
K. V. and E. H. were employed on the grant. J. W., R. G. and M. H. M. are employees of DSM. Costs for academic staff time on the project were included in the grant and paid to the Universities of Roehampton and Bristol. No payments were made by DSM directly to the academic staff.


