


Skeletal muscle represents the largest tissue in the body and is subject to constant regeneration at the cellular level(Reference Morley1). Sarcopenia refers to the loss of muscle mass and strength due to ageing. Nutritional replenishment of protein (raw material for muscle mass) and adequate energy intake (source of muscle strength) are indispensable for preventing sarcopenia(Reference Bolster, Jefferson and Kimball2,Reference Denise, Houston and Ding3) . In other words, daily dietary consumption of adequate amounts of nutrients is essential to maintain and increase skeletal muscle.
According to the Dietary Reference Intakes for Japanese (revised in 2015)(4), the estimated average protein requirement among adults is 50 g/d for men and 40 g/d for women. Additionally, the RDA is 60 g/d for men and 50 g/d for women(4). These estimated average protein requirements are based on levels of 0·72 g/kg body weight (BW) per d for adults and 0·85 g/kg BW per d for older individuals (>70 years)(4). The intake of meals triggers protein anabolism in skeletal muscle. This phenomenon is markedly attenuated in older individuals compared with younger adults, which suggests potential anabolic resistance in the former group(Reference Volpi, Mittendorfer and Rasmussen5). Recently, the Korean Geriatric Society and the Korean Nutrition Society recommended that older adults consume at least 1·2 g protein/kg BW per d to delay the progression of muscle wasting. This amount is 31·4 % higher than their previous recommendation (0·91 g/kg BW per d)(Reference Jung, Kim and Kim6). However, while increased protein intake has been shown to induce protein anabolism even in older individuals(Reference Paddon-Jones and Rasmussen7,Reference Mamerow, Mettler and English8) , evidence concerning the effects of total protein intake on skeletal muscle mass among older Japanese is still lacking. In addition, a recent study using the National Health and Nutrition Survey in Japan reported that more than 95 % of participants met recommended levels of protein, but in terms of distribution, most individuals consumed <20 g protein at breakfast. They concluded that intake of protein with each meal (distribution) in the Japanese population might be insufficient to prevent sarcopenia or frailty(Reference Ishikawa-Takata and Takimoto9).
In the present study, we examined the association between total protein intake per day and the prevalence of skeletal muscle mass decline. In addition, we focused on the quantity of protein intake with each meal, since each meal might trigger protein anabolism in skeletal muscle. We examined the association between protein intake with each meal and the prevalence of skeletal muscle mass decline, and also the association between total protein intake and protein intake with each meal, in order to discuss how to achieve sufficient protein intake with the three meals among older community-dwelling Japanese individuals.
Participants and methods
Participants
The present study was based on data collected as part of the National Institute for Longevity Sciences–Longitudinal Study of Aging (NILS-LSA). In the NILS-LSA, the normal ageing process was assessed over time using detailed questionnaires, medical examinations, anthropometric measurements, physical fitness tests and nutritional examinations. Participants in the NILS-LSA included randomly selected age- and sex-stratified individuals from a pool of non-institutionalized residents in the National Center for Geriatrics and Gerontology neighbourhood areas of Obu City and Higashiura Town in Aichi Prefecture. The first wave of the NILS-LSA was conducted from November 1997 to April 2000 and included 2267 participants (1139 men and 1128 women; age range 40–79 years). The details of the NILS-LSA have been reported elsewhere(Reference Shimokata, Ando and Niino10).
The fifth wave of the NILS-LSA was conducted from July 2006 to July 2008 and included 2419 participants (1200 men and 1219 women; age range 40–88 years). In the present study, we defined the fifth wave as the baseline study. Among these participants, 2088 were also included in the follow-up sixth wave of the NILS-LSA, which was conducted from July 2008 to July 2010. The mean interval between baseline and follow-up study for each participant was 2·0 (sd 0·1) years.
Exclusion criteria were as follows: (i) age <60 years at baseline (n 1018); (ii) individuals who did not complete the nutritional assessments, muscle mass assessments or self-reported questionnaires (n 110); and (iii) individuals with low muscle mass (see assessment of muscle mass below) at baseline (n 305).
Data from a total of 655 Japanese individuals (292 men and 363 women) who were between 60 and 87 years of age at the baseline of the NILS-LSA were available for analysis.
Nutritional assessment
Nutritional intake was assessed using a 3 d dietary record at baseline. Most participants completed the records at home and returned them within 1 month(Reference Imai, Sakai and Mori11). The dietary record was completed over three continuous days (two weekdays and one weekend day) and comprised nine sheets (3 meals × 3 d). Among the 655 participants, one completed 2 d dietary records (all others completed the 3 d) and we calculated mean nutritional intake according to those two days.
Within each meal sheet, i.e. the breakfast, lunch and dinner sheet, most participants recorded the time and all foods containing seasonings that they consumed. If the participant consumed snacks including fruits and dairy foods between breakfast and lunch and recorded the contents in the breakfast sheet, nutritional intake from those snacks was included in the intake for breakfast. All participants recorded the entries in chronological order; we did not code the meal time itself, but instead coded the time in the data set into seven categories: (i) from rising to before breakfast; (ii) breakfast; (iii) after breakfast to before lunch; (iv) lunch; (v) after lunch to before dinner; (vi) dinner; and (vii) after dinner to before bed. Breakfast, lunch and dinner were thus defined by the corresponding sheets recorded by the participants, i.e. breakfast contained the foods consumed from rising to before lunch, lunch contained the foods consumed before dinner, and dinner contained the food consumed before bed.
Foods were weighed separately on a scale (1 kg kitchen scales; Sekisui Jushi, Tokyo, Japan) before being cooked or the portion sizes were estimated. The participants used a disposable camera (27 shots; Fuji Film, Tokyo, Japan) to take photos of the meals before and after eating. Dietitians used these photos to complete the missing data and called the participants to resolve any discrepancies or to obtain further information, as necessary. Averages for 3 d food and nutrient intakes (including alcohol intake) were calculated according to the Standard Tables of Food Composition in Japan 2010 and other sources(Reference Imai, Sakai and Mori11,12) . Sex-stratified tertiles of total protein intake and protein intake at each meal were calculated.
Assessment of muscle mass
Appendicular muscle mass was assessed using dual-energy X-ray absorptiometry (QDR-4500; Hologic, Bedford, MA, USA)(Reference Yuki, Ando and Otsuka13,Reference Shimokata, Ando and Yuki14) . Appendicular muscle mass represents the appendicular fat-free mass minus the bone mineral content, and is considered to offer an index of the amount of skeletal muscle mass. Skeletal muscle index is calculated as the appendicular muscle mass in kilograms divided by the square of height in metres. Low skeletal muscle mass was defined using cut-off values for sarcopenia from dual-energy X-ray absorptiometry of <7·0 kg/m2 in men and <5·4 kg/m2 in women based on the criteria of the Asian Working Group for Sarcopenia(Reference Chen, Liu and Woo15).
Among those participants who did not exhibit low skeletal muscle mass at baseline (skeletal muscle index ≥7·0 kg/m2 for men or ≥5·4 kg/m2 for women), skeletal muscle mass decline was defined as a skeletal muscle index of <7·0 kg/m2 for men or <5·4 kg/m2 for women after approximately 2 years.
Other measurements
History of heart disease, hypertension, dyslipidaemia and diabetes (past and current), education (≤9 or ≥10 years of school), annual household income (<3 500 000 Yen or ≥3 500 000 Yen), employment and smoking status (yes/no) were collected using self-reported questionnaires. BMI was calculated as weight in kilograms divided by the square of height in metres. The 24 h physical activity was assessed by the metabolic equivalent of task (MET) score (a multiple of the RMR) obtained from participant interviews conducted by trained interviewers using a semi-quantitative assessment method. This method involved assessment of the level of habitual physical activity during leisure time and at work, as well as the daily number of hours of sleep(Reference Kozakai, Ando and Kim16,Reference Kumahara, Schutz and Ayabe17) . The sleeping metabolic score was defined as 1 MET × h, and if rest (sleeping) were to be maintained for 24 h, 24 h physical activity would be estimated as 24 MET × h/d.
All these measurements were assessed at baseline.
Statistical analysis
All statistical analyses were conducted using the statistical software package SAS version 9.3 and were performed separately by sex.
Multiple logistic regression analysis was performed to estimate the OR and 95 % CI for low skeletal muscle mass according to sex-stratified tertiles of protein intake, either per day or per meal. The lowest tertile was used as a reference. The confounding variables were age (years, continuous), skeletal muscle index at baseline (continuous), education (≤9 or ≥10 years), total physical activity (continuous), current smoking habit (yes or no) and history of heart disease, hypertension, dyslipidaemia and/or diabetes (yes or no).
Differences in proportions and means of baseline characteristics according to sex were assessed using the χ 2 test for categorical variables and the t test for continuous variables. All reported P values are two-sided and P < 0·05 was considered significant.
Results
The baseline characteristics of the participants are shown in Table 1. Mean age and BMI were 68·8 (sd 6·0) years and 24·3 (sd 2·2) kg/m2 for men and 69·8 (sd 6·5) years and 23·5 (sd 2·8) kg/m2 for women, respectively.
Table 1 Baseline characteristics of study participants: older men and women aged 60–87 years who participated in the baseline (2006–2008) and follow-up studies (2008–2010) of the National Institute for Longevity Sciences–Longitudinal Study of Aging (NILS-LSA) in Japan

MET, metabolic equivalent of task.
* P value from the t test for continuous variables or the χ 2 test for categorical variables.
Table 2 shows the intakes of energy, major nutrients and foods per day or from the three daily meals. Among men, mean total energy intake per day was 9500·6 kJ/d; breakfast, lunch and dinner accounted for 27 % (2574·8 kJ), 33 % (3137·6 kJ) and 40 % (3788·2 kJ) of the daily energy intake, respectively. Among women, mean total energy intake per day was 7574·3 kJ/d; breakfast, lunch and dinner accounted for 29 % (2167·3 kJ), 36 % (2700·8 kJ) and 36 % (2706·2 kJ) of daily energy intake, respectively. Likewise, breakfast, lunch and dinner accounted for 26, 31 and 43 % of the daily protein intake in men, and 27, 33 and 40 % of the daily protein intake in women, respectively. In the 3 d records, five men and three women reported an intake of ‘0 kJ’ for at least one meal, since they drank only water at breakfast (n 6), lunch (n 1) or dinner (n 1), but we calculated mean nutrient and food intakes including these results.
Table 2 Energy, major nutrients and food intakes according to one day or from three meals in one day among older men and women aged 60–87 years who participated in the baseline (2006–2008) and follow-up studies (2008–2010) of the National Institute for Longevity Sciences–Longitudinal Study of Aging (NILS-LSA) in Japan
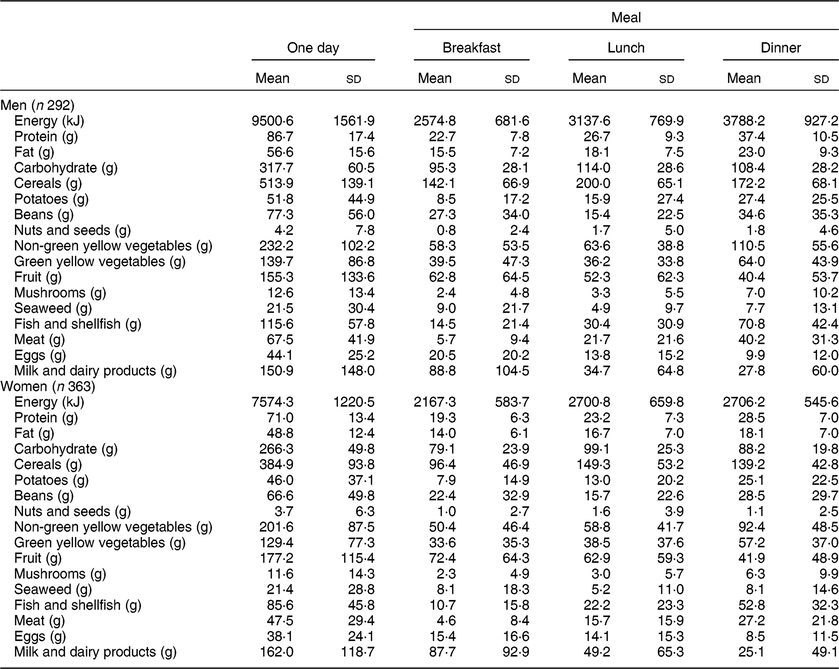
Table 3 shows the OR and 95 % CI for skeletal muscle mass decline according to tertiles of total protein intake per day and for the three daily meals. The skeletal muscle mass decline after approximately 2 years was 7·2 % (= 21/292 × 100) in men and 5·8 % (= 21/363 × 100) in women. Among men, multivariate-adjusted OR for the lowest through highest tertile of protein intake per day were 1·00 (reference), 0·21 (95 % CI 0·05, 0·87) and 0·24 (95 % CI 0·06, 1·06), respectively (P trend = 0·024). Total protein intake per day in women was not associated with skeletal muscle mass decline. With respect to lunch, the multivariate-adjusted OR for the highest tertile of protein intake in men was 0·11 (95 % CI 0·02, 0·61; P = 0·012). Although no significant difference was seen for women, the multivariate-adjusted OR also tended to be low in women (0·29 (95 % CI 0·07, 1·25); P = 0·096).
Table 3 OR (95 % Cl) for muscle mass decline* according to tertile of protein intake per day or for three meals among older men and women aged 60–87 years who participated in the baseline (2006–2008) and follow-up studies (2008–2010) of the National Institute for Longevity Sciences–Longitudinal Study of Aging (NILS-LSA) in Japan

* Adjusted for age (years, continuous), education (≤9, ≥10 years), skeletal muscle index at baseline (continuous), total physical activity (continuous), currently smoking (yes or no), and history of heart disease, hypertension, dyslipidaemia and/or diabetes (yes or no).
Discussion
Among men, medium and high tertiles of daily protein intake (>78·5 g/d) were associated with decreased prevalence of skeletal muscle mass decline as compared with the low tertile. In terms of the relationship between decline in skeletal muscle mass and intake of protein at breakfast, lunch and dinner among men, those in the highest tertile of protein intake at lunch showed a decreased prevalence of skeletal muscle decline. Among women the results were borderline significant, with those in the highest tertile of protein intake at lunch tending to show a decreased prevalence of a decline in muscle mass.
According to the Dietary Reference Intakes for Japanese (revised in 2015)(4), the RDA is 60 g/d for men and 50 g/d for women, based on 0·85 g/kg BW per d for older individuals. A recent guideline for the management of sarcopenia recommended that older Japanese adults consume at least 1·0 g/kg BW per d to prevent sarcopenia(18). However, the evidence level was categorized as low, due to the lack of supporting evidence among Japanese. Among old Japanese women aged ≥65 years, individuals categorized to the third, fourth and fifth quintiles of total protein intake (>69·8 g/d) showed significantly lower OR for frailty than those categorized to the first quintile (P < 0·03 for all)(Reference Kobayashi, Asakura and Suga19). Although that cross-sectional analysis of women focused on frailty, the main result that total protein intake (>69·8 g/d) correlated negatively with frailty was similar to our finding that total protein intake (>78·5 g/d) was negatively associated with declining muscle mass in men.
Conversely, an intake of approximately 25–30 g of high-quality protein at every meal is recommended by the Japanese dietary guidelines for older people(4). Ingesting 25 g of protein at every meal and ingesting 75 g of protein per day may be related to lowered risks of skeletal muscle mass decline and/or frailty among older individuals. In a subgroup analysis in the present study (see online supplementary material, Supplemental Table S1), 17·1 % of men and 6·9 % of women ingested ≥25 g of protein at breakfast, lunch and dinner. Few domestic or overseas studies have evaluated the distribution of protein intake between breakfast, lunch and dinner in order to determine the optimal timing of protein ingestion to enhance protein anabolism. One report recommended an intake of approximately 25–30 g at each meal(Reference Paddon-Jones and Rasmussen7), while another suggested that a uniform intake at each meal is desirable(Reference Mamerow, Mettler and English8). However, some investigations have supported weighting the intake distribution towards the daytime or towards one meal(Reference Bauer, Biolo and Cederholm20–Reference Deutz and Wolfe22). Conclusions regarding the optimal distribution of protein intake between breakfast, lunch and dinner are thus inconsistent. In the present study, total protein intake was positively associated with protein intake in each of the three meals in both men and women (Supplemental Table S2). We therefore could not discuss the ideal distribution in three meals, but consistent protein intake through three meals would be recommended for older Japanese to increase total protein intake per day.
In the present study, a high protein intake at lunch was associated with retention of skeletal muscle mass in men. This association was independent of total protein intake (data not shown; OR for high lunchtime protein intake: 0·08 (95 % CI 0·01, 0·59); P = 0·01). One possible reason for this positive correlation is the variability of lunch meals among Japanese. In our study, breakfast, lunch and dinner accounted for 26, 31 and 43 % of the daily protein intake in men, and 27, 33 and 40 % of the daily protein intake in women, respectively. The total amount of protein depends strongly on dinner protein intake, but the CV for dinner was low in both men (28·1) and women (24·6), respectively (see online supplementary material, Supplemental Table S2 and Supplemental Fig. S1), whereas the CV for breakfast and lunch meals were higher than those for dinner. In particular, the CV in men was highest for lunch (34·8). These results indicate that lunchtime protein intake varies markedly among men, and the difference in protein intake at lunch was associated with risk of muscle mass decline. In fact, men with higher total protein intake at lunch showed higher rates of employment and consumption of meat, eggs and dairy foods (Supplemental Table S3). These social factors and/or food selections might affect protein intake and muscle mass in men.
Another reason was considered to be that compared with exercise in the morning, exercise in the evening exhibited a stronger association with increased secretion of thyroid hormone and growth hormone, which are involved in the development of skeletal muscle(Reference Kagawa, Shibata and Oda23). Lunchtime ingestion of large amounts of protein, calcium and vitamins may therefore help increase muscle weight, as the amino acids used as raw materials for the secretion of these hormones and for muscle are consumed at this time.
In the present study, no significant correlation was observed between the amount of protein consumed and skeletal muscle mass decline in women. One possible reason was the low prevalence of skeletal muscle mass decline after approximately 2 years (7·2 % in men and 5·8 % in women) and equal variability of protein intake (CV of protein intake was almost equal for the three meals; see online supplementary material, Supplemental Table S2). However, the present results do not necessarily mean that protein intake is unrelated to retention of skeletal muscle mass in women.
Some limitations to the present study must be considered. We assessed protein intake using dietary records for three consecutive days (two weekdays and one weekend day) with photographs. Although the 3 d dietary record is one of the best ways to assess individual food intake(Reference Ishikawa-Takata and Takimoto9), avoiding under- or overestimation of dietary intake is difficult(Reference Willett24). We therefore could not clearly define ideal protein intake for the present study. While continuous dietary records might be a limitation in that sense, Japanese usually eat a varied diet and often prefer to avoid the same meal continuously (and so, for example, alternate eating meat dishes and fish dishes for dinner). We therefore consider the continuous record as better for estimating the usual dietary intake among Japanese. In addition, seasonal variability is seen in dietary patterns; however, our survey was conducted almost every day throughout the year and the number of participants was almost equal in all seasons, therefore the impact of seasonal variability seems negligible. Second, we calculated mean protein intake in all participants, even though a small number of them only drank a cup of water (0 kJ) or skipped breakfast (0 kJ), so the mean value would be underestimated compared with that calculated among participants who ate something (>0 kJ) at breakfast. Third, we focused only on the quantity of protein intake and did not examine the quality. Reports from Western countries have suggested that the intake of meat, among the sources of animal protein, is related to retention of skeletal muscle mass(Reference Isanejad, Mursu and Sirola25). However, unlike their Western counterparts, older Japanese individuals characteristically ingest more protein from legumes, fish and eggs than from meat or dairy products(Reference Tieland, Borgonjen-Van den Berg and Van Loon26–28). The intake of amino acids, which are the building blocks of proteins, was not investigated in the present study. The effects of different types of amino acids may also need to be investigated, as branched-chain amino acids in particular are believed to have positive effects on muscle mass.
In the present study, male participants who ingested greater amounts of total daily protein and protein at lunch showed greater retention of skeletal muscle mass. Looking at the target population, mean intake of cereals at lunchtime was high (Table 2), which suggests that many individuals in this population consumed lunches rich in cereals. On the other hand, mean protein intake was higher at dinner for both men and women, but the CV was high for lunch (see online supplementary material, Supplemental Table S2), reflecting a tendency among the target population for greater protein ingestion at dinner and higher variability of protein intake at lunch. The present results therefore indicate that consumption of proteins and a variety of other nutrients at lunch, which tends to not be cereal based, is related to skeletal muscle mass retention. In addition, more than 65 % of men and women consumed <25 g of protein at breakfast (Supplemental Table S1), and older Japanese individuals may thus need to be encouraged to eat more protein at breakfast.
Conclusion
In conclusion, the present study provides some indications that high levels of daily protein intake and protein intake at lunch may help prevent skeletal muscle mass declines among community-dwelling older Japanese men. One of the best ways to increase total daily protein intake and thus prevent muscle mass decline may be to eat protein not only at lunch, but also at breakfast and dinner.
Acknowledgements
Acknowledgements: The authors wish to express their sincere appreciation to the study participants and their colleagues in the NILS-LSA for completing the survey for this study. Financial support: This work was supported in part by grants from the Japanese Ministry of Education, Culture, Sports, Science and Technology (grant numbers 16H03264, 15K00857 and 15K08763) and Research Funding for Longevity Sciences from the National Center for Geriatrics and Gerontology, Japan (grant number 28-40, 29-10). No grant providers played any role in the design, analysis or writing of this article. Conflict of interest: The authors declare no conflict of interest. Authorship: H.S. and F.A. designed the NILS-LSA. R.O., Y.K., T.I., C.T., Y.N., M.T., F.A. and H.S. substantially contributed to the collection of nutritional, anthropometric and medical data. R.O. and H.A. created the original research question. R.O. completed the statistical analysis. All authors interpreted the data. R.O. was a major contributor in writing the manuscript, and the other authors discussed and revised it. All authors approved the final version of the manuscript. Ethics of human subject participation: The study protocol was approved by the Committee of Ethics of Human Research of the National Center for Geriatrics and Gerontology (number 899-3) according to the Declaration of Helsinki ethical guidelines and ethical guidelines for medical and health research involving human subjects in Japan. Written informed consent was obtained from all participants prior to enrolment in each study wave in the NILS-LSA.
Supplementary material
To view supplementary material for this article, please visit https://doi.org/10.1017/S1368980019002921


