Over the past few years, Vietnam has experienced a dramatic economic reform (Doi Moi), including the privatisation of the economy and reduction in poverty. These have also contributed to considerable improvements in the nutritional and health status of many Vietnamese(Reference Thang and Popkin1, 2). There has been a rapid and sustained reduction in the rates of underweight and stunting in children aged < 5 years(Reference Khan and Khoi3). The prevalence of underweight has reduced, with a national average of 1·5 % annually, from 31·9 % in 2001 to 25·2 % in 2005 and 17·5 % in 2010. A similar trend has also been observed for stunting with rates declining from 43·3 % in 2000 to 29·3 % in 2010(4). During the 35th session of the Standing Committee in Nutrition of the UN, Vietnam was recognised by the UNICEF/East Asia and Pacific Regional Office (EAPRO) as one of the few countries in Southeast Asia with reduction in child malnutrition close to the Millennium Development Goals(2).
Despite these striking achievements, Vietnam remains among the thirty-six countries with the highest stunting rates in the world(2, Reference Khan and Khoi3, Reference Khan, Tuyen Le and Ngoc5). In addition, the prevalence of overweight, obesity and nutrition-related chronic diseases has also increased, leading to a new pattern of morbidity and mortality in Vietnam. Overweight and obesity are now estimated to be present in 4·8 % of the children(2).
A similar persisting concern has also been noted for micronutrient deficiencies(Reference Durnin and Womersley6). Due to special national programmes such as the ‘National Nutritional Action Plan, 1996–2000’ and the ‘National Nutritional Strategy, 2001–2010’, focusing on various target populations, designed and implemented over the past decennia, there have been definite improvements with regard to vitamin A deficiency, iodine-deficiency disorders and nutritional anaemia. However, subclinical vitamin A deficiency still exists and varies by region, even with the implementation of ongoing universal and periodical vitamin A supplementation programmes throughout the country. The high prevalence of anaemia suggests that Fe deficiency warrants attention(2).
It is well known that nutrition in childhood years plays an important role in physical and mental development, which, in turn, is related to individuals' and national economic success(Reference Durnin and Womersley6–Reference Martins, Toledo Florêncio and Grillo10). For this reason, four of the seven current national programmes for the period of 2011–20 focus on maternal and child malnutrition, stunting, micronutrient deficiencies, school nutrition and overnutrition in relation to non-communicable chronic disease control(2).
However, there is a lack of coherent data on health and nutritional status in Vietnamese children, especially in school-aged children, and as a result it is difficult to set up school nutrition programmes effectively. The purpose of the present study, therefore, was to gather data on the effects of anthropometry, nutritional intake and food habits, physical activity and blood chemistry on nutritional deficiencies as well as cognitive development in a nationwide representative sample of children aged 0·5–11·9 years. The present study is part of the South East Asian Nutrition Survey (SEANUTS), a multi-centric study simultaneously being carried out in 16 744 children, aged 0·5–12 years, in four countries(Reference Schaafsma, Deurenberg and Calame11).
The SEANUTS will provide current information on food consumption and nutritional status trends. This can be used for identifying vulnerable groups, facilitating the development of focused nutrition and health strategies according to the region.
Materials and methods
The Vietnamese part of the SEANUTS is a cross-sectional study conducted in six provinces (out of sixty-three) in 2011. A multi-stage cluster sampling, stratified by geographical location, sex and age, was carried out to recruit children aged 0·5–11·9 years into the study. Data collection was done in three regions of Vietnam, namely North, Central and South. The sample size for the present study was estimated based on the 35 % prevalence of anaemia in children aged >5 years in Vietnam, obtained from the National Survey on Micronutrients(12). A sample size of 724 children per region was calculated to get a precision of 95·0 % with a design effect of 2·0. Anticipating an estimated 20 % rate of non-responsiveness, at least 874 children per region were required. The required sample size for the survey, therefore, was 2622. Consequently, children were recruited from six districts and fifteen towns within the randomly selected six provinces.
Inclusion criteria comprised apparently healthy Vietnamese boys and girls, aged 6 months to 11·9 years, not physically handicapped and without obvious genetic disorders. Children who were ill or were absent on the day of measurements were excluded from the study.
The study was conducted according to the guidelines laid down in the Declaration of Helsinki, and all procedures were approved by the Medical Ethical Committee of the National Institute of Nutrition, Hanoi. Written informed consent was obtained from all the parents or carers of children and verbal assent was obtained from each child before data collection. The study is registered in the Netherlands Trial Registry as NTR2462.
Data collection
All study procedures were standardised before use. Trained study personnel, under expert supervision, administered the test procedures including the administration of structured questionnaires, anthropometric measurements and blood withdrawal. Sociodemographic information for the subjects was obtained from parents or carers using interviewer-administered questionnaires.
Anthropometric assessments
Height was recorded to the nearest 0·1 cm using a calibrated wall-mounted stadiometer (Holtain Limited) in children aged >2 years and with a horizontal measuring board for children aged < 2 years. Weight was measured to the nearest 100 g using a calibrated A&D UC 321 (A&D Limited). Mid-upper arm circumference was measured to the nearest 0·1 cm using a flexible tape. Skinfold thickness to the nearest 0·2 mm was recorded at four sites (tricipital, bicipital, subscapular and suprailiac)(Reference Durnin and Womersley6) using Holtain calipers (Holtain Limited). All measurements were carried out in duplicate and the mean was calculated. If the difference between two measurements was more than 10 %, a third measurement was taken and the median was used. Children were measured in light clothing and without shoes.
The anthropometric status of the children was determined based on the WHO growth standards for those aged 0–5 years(13) and the WHO growth reference for those aged 5–19 years(13, Reference Onis de, Onyango and Borghi14). Weight-for-age z-scores (WAZ), height-for-age z-scores (HAZ) and BMI-for-age z-scores (BAZ) were determined using the software Anthro version 3.1.0 (WHO) for children aged 5 years and less and AnthroPlus version 1.0.3 (WHO) for children aged >5 years. The cut-off value for stunting and thinness was − 2 sd. For overweight and obesity, the cut-off value of 2 sd was used for children aged < 5 years and those of 1 and 2 sd were used for children aged >5 years(13, Reference Onis de, Onyango and Borghi14).
Dietary assessments
Dietary intake was assessed using a 24 h recall questionnaire using standard food measures during the interview to facilitate recall of portion size. For children aged < 8 years, the recall was completed by their mothers or other carers. Children aged 8 years and above faced the recall interview by themselves. Nutrient composition of the diet was estimated using the Nutrisoft program developed by the National Institute of Nutrition, using the Vietnamese food composition table. The nutrient intake values were then compared with the Vietnamese(Reference Khan and Hoan15) and FAO/WHO RDA(16).
Biochemical assessments
Of the total subjects, 20 % of the infants and children were sampled for blood. In children aged < 6 years, approximately 10 μl of blood were collected through finger prick for Hb estimation using HemoCue (HemoCueHb201+, HemoCue AB). Approximately 5 ml of venous blood were drawn in children aged 6 years and above by trained phlebotomists. The collected blood samples were kept in a standard storage box with ice packs and transported to the laboratories of Protective Medical Centers of the localities within 4–5 h after collection. At the Protective Medical Centers, Hb concentration was measured from whole blood using a blood counter (Siemens, ADVIA 2120). The blood counter was controlled each day for accuracy by a certified QC for 10 % of the samples running on duplicates. Whole blood was centrifuged at 3000 g for 10 min at room temperature. The supernatant plasma was aliquoted into 500 μl pre-labelled Eppendorf tubes and was subsequently kept frozen at − 20°C until transported (on dry ice) to the laboratory of the National Institute of Nutrition. Serum samples were stored at − 70°C until analysis. Serum samples were analysed for ferritin, C-reactive protein (CRP), α-1 glycoprotein (AGP), retinol and 25-hydroxyvitamin D concentrations.
Serum ferritin concentration was measured by ELISA using commercial kits that included reference samples (Ramco Lab, Inc.). The concentrations of CRP and AGP, used as markers of inflammation and infection, were measured by ELISA using commercial kits (Immunology Consultants Laboratory, Inc.) with quality controls obtained from Bio-Rad Laboratories (Liquicheck Immunology Control, Bio-Rad Laboratories). Serum retinol concentration was determined by reverse-phase HPLC (LC-10 ADVP, Shimadzu). Serum 25-hydroxyvitamin D concentration was determined by HPLC (Alliance, Waters Corporation) according to the method described by Turpeinen et al. (Reference Turpeinen, Hohenthal and Stenman17) with quality controls obtained from Immundiagnostik AG. The within-assay CV for serum ferritin, transferrin, retinol, 25-hydroxyvitamin D, CRP and AGP ranged from 2·5 to 5·2 %, and between-assay variability was < 10 % for all the variables.
Anaemia was defined as Hb concentrations < 115 g/l for children aged 5–11 years (with High sensitivity CRP concentration < 5 mg/l and AGP concentration < 1 g/l) and < 110 g/l for those aged 0·5–4·9 years(18). Serum ferritin concentrations < 12 mg/l for children aged < 5 years and < 15 mg/l for those aged >5 years were used to identify children with depleted Fe stores(18) in the absence of signs of inflammation (CRP concentration < 10 g/l)(Reference Thurnham, McCabe and Haldar19). Serum retinol concentration < 0·70 μmol/l was used as a cut-off to define vitamin A deficiency(Reference Pee de and Dary20). The prevalence of vitamin D deficiency was determined based on circulating 25-hydroxyvitamin D concentration < 50 nmol/l(Reference Mithal, Wahl and Bonjour21, Reference Greer22).
Statistical analyses
Statistical analyses were carried out using SPSS version 11.0.1 (IBM Corporation). All analyses were performed on weighted data. Descriptive statistics are presented as weighted population means with standard errors or percentages for prevalence. The children were clustered into three age groups, namely 0·5–1·9, 2·0–4·9 and 5·0–11·9 years (except for blood biochemistry). For biochemical parameters, age clustering into 0·5–1·9, 2·0–5·9 and 6·0–11·9 years was done based on the blood sampling technique. Differences between the variables in different strata (age, area of residence and sex) were tested for significance using ANCOVA, after adjusting for age. The χ2 statistics were used to test for differences in prevalence data across strata. The level of significance was set at P< 0·05.
Results
Table 1 presents the number of children in the three age strata by sex and area of residence. A total of 2872 children participated in the study, representing an estimated population of 19 769 314 children aged 0·5–11·9 years residing in Vietnam. Approximately 50 % of the recruited children were boys and resided in urban areas.
Table 1 Number of children participating in the study by age group, sex and area of residence*

* Estimated population size based on the census data from the Vietnam Bureau of Statistics, Hanoi 2009.
The anthropometric characteristics of the children by age group are given in Table 2. In the age groups 2·0–4·9 and 5·0–11·9 years, the values of all the anthropometric parameters were significantly higher for urban children than for rural children (P< 0·05). In the youngest age group (0·5–1·9 years), urban children, irrespective of sex, had significantly greater heights than their rural counterparts (P< 0·05); a greater weight was observed only in urban girls. A comparison between the sexes showed that rural boys aged 0·5–1·9 years and urban boys aged 5·0–11·9 years had values of all the anthropometric parameters (except skinfolds and height, respectively) significantly higher than those in their female counterparts (Table 2).
Table 2 Anthropometric parameters by age group, sex and area of residence (Mean values with their standard errors)

MUAC, mid-upper arm circumference.
* Mean values were significantly different from those of girls after correction for age differences (P< 0·05).
† Mean values were significantly different from those of rural areas after correction for age.
‡ Skinfolds: sum of tricipital, bicipital, subscapular and suprailiac skinfolds (P< 0·05).
On average, irrespective of sex or area of residence, Vietnamese children had negative mean WAZ, HAZ and BAZ (Table 3), with some exceptions. Positive scores for WAZ and BAZ were obtained for urban children in the age group 2·0–4·9 years and urban boys aged 5·0–11·9 years. Additionally, rural boys aged 0·5–1·9 years had positive BAZ. Urban children in the age groups 2·0–4·9 and 5·0–11·9 years had significantly higher WAZ, HAZ and BAZ than their rural counterparts (P< 0·05). In children aged 0·5–1·9 years, a significant difference was observed only for HAZ of boys residing in urban areas v. those residing in rural areas (P< 0·05). Overall, the difference in z-scores between the sexes did not reach statistical significance, except for BAZ in urban children aged 5·0–11·9 years. As can be seen in Fig. 1, the distribution of BAZ in children aged 0·5–11·9 years, in general, shifted to both the left and right of the score region in comparison with the WHO reference curve.
Table 3 z-Scores by age group, sex and area of residence (Mean values with their standard errors)

WAZ, weight-for-age z-score; HAZ, height-for-age z-score; BAZ, BMI-for-age z-score.
* Mean value was significantly different from that of girls after correction for age differences (P< 0·05).
† Mean values were significantly different from those of rural areas after correction for age.
Fig. 1 BMI-for-age z-score superimposed on the BMI reference curve for (a) children aged < 5 years and (b) children aged >5 years. Urban and rural data are combined. ![]() , Boys;
, Boys; ![]() , girls;
, girls; ![]() , WHO reference(13, Reference Onis de, Onyango and Borghi14).
, WHO reference(13, Reference Onis de, Onyango and Borghi14).
Approximately 29 % of the total children in urban areas were either overweight or obese (Table 4). Among the three age groups, in urban children, the prevalence of overweight and obesity was the highest in the age group 5·0–11·9 years. In this age group, the percentage of obese urban boys was significantly higher than that of obese urban girls (P< 0·05). In contrast, the overall prevalences of overweight and obesity were 4 and 1·6 %, respectively, in rural areas. Stunting and underweight were observed to be bigger problems in rural areas (Table 4). A significantly higher prevalence of both stunting and underweight was observed in rural children in the age groups 2·0–4·9 and 5·0–11·9 years than in their urban counterparts. The prevalence of thinness was also higher in rural areas (except in the age group 0·5–1·9 years) and, particularly, at higher ages.
Table 4 Prevalence (%) of undernutrition and overnutrition by age group, sex and area of residence‡

* Values were significantly different from those of girls after correction for age differences (P< 0·05).
† Values were significantly different from those of rural areas after correction for age.
‡ Stunting: height-for-age z-score ≤ –2 sd; underweight: weight-for-age z-score ≤ –2 sd; thinness: BMI-for-age z-score ≤ –2 sd; overweight: ≥ 1 sd and obese: >2 sd in children aged >5 years; overweight: >2 sd and obese: >3 sd in children aged < 5 years (P< 0·05).
The mean blood values did not differ between the sexes and areas of residence, except for higher Hb levels in urban children aged 0·5–1·9 years and ferritin levels in rural children aged 6·0–11·9 years (Table 5). Overall, a higher prevalence of anaemia was observed in rural children aged 0·5–1·9 and 2·0–5·9 years, albeit not statistically significant, than in their urban counterparts (54·3 v. 25·9 % and 23·4 v. 12·7 %, respectively). In children aged 6·0–11·9 years, more than 45 % of the children, irrespective of residence or sex, had vitamin D deficiency. The prevalence of anaemia and deficiencies of Fe and vitamins A and D is summarised in Table 6.
Table 5 Some biochemical parameters by age group, sex and area of residence (Mean values with their standard errors)

* Mean value was significantly different from that of girls after correction for age differences (P< 0·05).
† Mean values were significantly different from those of rural areas after correction for age.
Table 6 Prevalence (%) of anaemia and iron, vitamin A and vitamin D deficiencies by age group, sex and area of residence*†

* Anaemia was defined as Hb concentrations < 110 g/l if age < 4·9 years and < 115 g/l if age >5 years(18); values for 6–11-year-old children are corrected for infection.
† Vitamin A deficiency was defined as serum retinol concentration < 0·70 μmol/l(Reference Pee de and Dary20); vitamin D deficiency was defined as 25-hydroxyvitamin D concentration < 50 nmol/l(Reference Mithal, Wahl and Bonjour21, Reference Greer22).
‡ Significant at P< 0·05 urban girls compared rural girls.
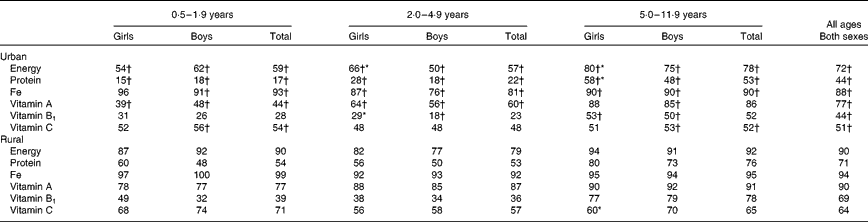
The macronutrient intakes, as expected, were higher in the older age groups (Table 7). The mean energy and macronutrient intakes were significantly higher for boys than for girls in the age groups 2·0–4·9 (only urban) and 5·0–11·9 (both urban and rural) years. The percentage of energy from protein, carbohydrate and fat also differed between the two areas of residence, but not between the sexes. Urban children also had higher intakes of Fe, vitamin A, vitamin B1 (except in the age group 0·5–1·9 years) and vitamin C (except in the age group 2·0–4·9 years) than rural children (Table 8). Comparison of nutrient intakes with the Vietnamese RDA showed that more than 70 % of the children, irrespective of the urban or rural area, did not meet the requirements for protein, energy or above-mentioned micronutrients (Table 9). Similar results were observed when nutrient intakes were compared with the FAO/WHO recommendations (results not shown).
Table 7 Intake of energy and macronutrients in the various age groups by sex and area of residence (Mean values with their standard errors)
* Mean values were significantly different from those of girls after correction for age differences (P< 0·05).
† Mean values were significantly different from those of rural areas after correction for age.
Table 8 Intake of selected micronutrients in the various age groups by sex and area of residence (Mean values with their standard errors)
* Mean values were significantly different from those of girls after correction for age differences (P< 0·05).
† Mean values were significantly different from those of rural areas after correction for age.
Table 9 Percentage of children in the various age groups below the local dietary requirements for energy and a selection of nutrients by sex and area of residence
* Values were significantly different from those of girls after correction for age differences (P< 0·05).
† Values were significantly different from those of rural areas after correction for age (P< 0·05).
Discussion
The SEANUTS aims to give an overview of the current nutritional and health status of children aged 0·5–11·9 years residing in both urban and rural areas of Vietnam. The available data show that malnutrition is still clearly a concern at all ages in Vietnam. Nearly 14 % of children aged < 5 years are stunted, 8·6 % underweight, 4·4 % thin and 6·5 % overweight/obese. The SEANUTS also brings to our notice the dual burden of malnutrition in school-aged children. Undernutrition was more common in rural areas, whereas overnutrition was mainly an urban phenomenon.
The last two nationally representative surveys in Vietnam, Multiple Indicator Cluster Survey 2011(23) and National Nutrition Survey (NNS) 2009–10(4), have reported a prevalence of 22–29 % for stunting and of 11 % for underweight among children aged < 5 years. Large disparities were observed between urban and rural areas(4, 23). SEANUTS measurements support these results and confirm that undernutrition in Vietnam is still a concern of moderate-to-severe public health significance. Additionally, the SEANUTS reveals that among the school-aged children, 15·6 % were stunted and 22·2 % were underweight. To our knowledge, this is the first study to present such data on the nutritional status of school-aged children in Vietnam. The age pattern shows that a lower percentage of children aged 0·5–1·9 years are underweight or thin in comparison with older children. This pattern is expected and may be related to the age at which many children are weaned and exposed to external contamination by food, water and environment. Earlier findings(Reference Hop, Gross and Giay24, 25) have suggested that Vietnamese children at birth are generally within the normal boundaries of international standards(13, Reference Onis de, Onyango and Borghi14), but that they gradually grow into a less desirable nutritional state, as shown in the present study, attributable to inadequate traditional dietary food intake patterns following an adverse supplementary feeding(23, Reference Khoi, Hop and Hoa26–Reference Khanh, Khoi and Mai28).
As with other developing countries, overweight due to inappropriate diet is one of the concerns of Vietnam's strategy against malnutrition. In Multiple Indicator Cluster Survey 2011, the prevalence of overweight was 4·4 %. The NNS 2009–10 report has shown that nationally close to 7 % of urban children aged < 5 years and about 35 % aged from 5 to 11 years are overweight/obese, while among rural children, these values are about 4 and 10 %, respectively. The results from the present study are not much different, with the exception of a higher prevalence of overweight/obesity in children aged >5 years in urban areas. The much wider covered geographical area and a higher number of participants in the National Health Survey could be one of the reasons. A recent study by Trang et al. (Reference Trang, Hong and Dibley29) in Ho Chi Minh City (Saigon) in southern Vietnam has found a comparable (to that of the present study) prevalence of overweight and obesity in older children and adolescents. Furthermore, a high prevalence of overweight and obesity has been reported in other studies as well(Reference Ha Do, Feskens and Deurenberg30, Reference Hong, Dibley and Sibbritt31).
Upon further analysis of the relationship of BMI-for-age and length/height-for-age z-scores, we found that nearly 5 % of the overweight/obese children in SEANUTS were also stunted. It is, therefore, plausible that their classification could, at least partly, be due to their relatively short height for age and not their excess body weight. When comparing available data on height over the last decennia, it is obvious that height in the population is increasing. This secular trend was reported in the NNS(4) for the period 1985–2010 for children of different ages, but other and older publications are available. Fig. 2 shows the secular increase in height for 6- and 9-year-old children over a period of more than 100 years. From 1875(Reference Huard and Bigot32) until 2011(4), the mean height increased about 20 cm. Although this is encouraging in the battle against stunting, it can be predicted that it will take some 10–15 years more, assuming the same secular growth acceleration, before the 9-year-old Vietnamese children catch up with the WHO standards(33).

Fig. 2 Secular changes in the height of 6-year-old (□) and 9-year-old (![]() ) children in Vietnam over the past century. Values are means.
) children in Vietnam over the past century. Values are means.
Since the early 1990 s, Vietnam has experienced a dramatic shift in the distribution of child nutritional status coinciding with a period of economic boom. The growth and development in the Vietnamese economy have also resulted in the implementation of economic reform, nutrition policy initiatives and health sector changes(Reference Khan and Khoi3). Currently, there are targeted programmes for addressing child malnutrition among National Target Projects on social diseases and dangerous endemics, with an average funding of 100 billion Vietnamese Dong (VND) per year (almost 5 million USD). The majority of these initiatives and efforts are aimed at children aged < 5 years, in line with the recommendations of the UN agencies. Evidence-based science clearly states that the most cost-effective interventions with long-term potential are those targeting early child development(Reference Grantham-McGregor34). However, as has been observed with the SEANUTS, the nutritional status of school-aged children is also at risk. It has been well documented that both undernutrition and overnutrition during school years can have detrimental effects and long-term consequences such as impaired intellectual achievement and school performance(Reference Best, Neufingerl and van Geel35), reduction in adult body size, reduced work capacity and higher risk of non-communicable disorders(Reference Grantham-McGregor34).
Shortage or excess of macronutrients and micronutrients is known to have a negative impact on energy and healthy development. The SEANUTS shows that Fe deficiency and anaemia persist at levels of mild-to-moderate public health significance. The prevalence of anaemia in the present study is in agreement with the data from the National Health Survey(4), which has also reported a decline in prevalence with age from about 40 % at an age < 2 years to about 14 % at ages 4–5 years. Although, overall, there has been a decline in the prevalence of anaemia(4, Reference Laillou, Pham and Tran36), data from the SEANUTS and other studies suggest that supplementation programmes for Fe, unlike those for vitamin A, have not been very successful(Reference Khoi37). A high prevalence of anaemia has been reported in many studies carried out in Vietnam(Reference Laillou, Pham and Tran36, Reference Van Nhien, Khan and Ninh38, Reference Khan, Huan and Nhien39). However, it has to be realised that part of anaemia might have a physiological reason (in case of infections) and Fe deficiency per se may not be the causal factor. A 2–5 % lower prevalence of anaemia was also observed in the present study when inflammation markers (high-sensitivity CRP concentration >5 mg/l and AGP concentration >1 g/l) were taken into consideration. For the younger age groups ( < 5 years), this correction could not be made since the concentrations of inflammation markers were not determined due to logistic reasons.
The prevalence of vitamin A deficiency in the present study was relatively low at 7–10 %, with no differences being observed between boys and girls and no differences between urban and rural children. According to the NNS 2009–11 report, vitamin A deficiency is prevalent at about 14 % and Van Nhien et al. (Reference Van Nhien, Khan and Ninh38) reported a prevalence of 11 %. A point to note is that both these reports are for children aged < 5 years, highlighting the success of vitamin A supplementation in Vietnam in the first few years of life(Reference Khan, Huan and Nhien39). To our knowledge, published data on the nationwide prevalence of vitamin A deficiency in school children are not available. Results from the SEANUTS suggest that efforts to prevent vitamin A deficiency have to be maintained and should be focused on children aged >5 years. Given the age group and available evidence on low/no efficacy of vitamin A supplementation after 6 months of age(Reference Laillou, Pham and Tran36), alternative strategies such as food fortification or food diversification should be considered.
It was striking to observe that vitamin D deficiency was present in nearly half of the school-aged children. This high prevalence can be explained by traditional clothing, air pollution and limited outdoor activity, particularly in the urban population. A previous study in Vietnam in primary school children has found that the time spent indoors by children living in urban areas was significantly higher than that spent by children living in rural areas(40), which might explain the slightly higher values in urban children. Vitamin D status of South East Asian populations has received relatively less attention when compared with that of South Asian populations(Reference Mithal, Wahl and Bonjour21). Limited data have reported a high prevalence of vitamin D deficiency in adult Vietnamese(Reference Ho-Pham, Nguyen and Lai41) and also in those from other countries including tropical countries with a high level of sun exposure(Reference Bener, Al-Ali and Hoffmann42, Reference Khor, Chee and Shariff43), albeit using a higher cut-off value of 75 nmol/l. The data of the Vietnamese SEANUTS are comparable with those of the SEANUTS carried out in other countries, e.g. Malaysia(44), where, however, differences between the sexes have been found and could be explained by religious/cultural differences in body coverage by clothing between boys and girls. These results point towards the need for more studies with larger sample sizes to make conclusive recommendations.
According to the reported energy and protein intakes, nearly 70 % of the children did not consume in accordance with the Vietnamese RDA(Reference Khan and Hoan15) for these nutrients. Similar results were observed for micronutrient intakes. However, these alone cannot explain the prevalence of anaemia and vitamin A deficiency. Factors such as infection, composition of the diet (animal sources or plant sources with lesser bioavailability), vitamin C intake, dietary fibre intake and onset of puberty that determine for a large part the Fe status(45) also have an important contributing role. The Vietnamese diet, high in carbohydrate with large amounts of rice as staple food, but low in animal fat, animal protein and fruits and vegetables, carries the risk for micronutrient deficiencies such as Fe and vitamin A(46). In the present study, the prevalence of anaemia in girls with a sufficient Fe intake according to the Vietnamese RDA(Reference Khan and Hoan15) was not lower. This can possibly be explained by a low vitamin C intake, an accelerated growth and an increased Fe demand due to the onset of puberty. It is known that the onset of puberty is earlier in urban girls than in rural girls(33), and this may explain the difference in Fe status (i.e. serum ferritin levels) between urban and rural girls observed in the present study. Further in-depth analyses of the food consumption data and food habits in relation to biochemical parameters are, however, needed to make interpretations.
The strengths of the present cross-sectional study are the availability of anthropometric, biochemical and nutrient intake data for more than 2800 children from three geographical regions of Vietnam, and children were representative of the total population aged 0·5–11·9 years (by residence and sex) in the country based on weight factor adjustment. A limitation is the inclusion of only three geographical regions in the study design and relatively small numbers in some subgroups, because of which some relatively large (mean) differences are not statistically significant.
In conclusion, the Vietnamese SEANUTS provides the much-needed valuable information on the nutritional status of school-aged children (5·0–11·9 years) and validates the findings of the NNS 2009–11 and Multiple Indicator Cluster Survey 2011 for children aged < 5 years. The survey clearly highlights that strategies for improving the nutritional status of Vietnamese children must focus on both the spectra of malnutrition and micronutrient deficiencies, particularly vitamin D insufficiency. Targeted interventions and programmes for school-aged children are also warranted.
By 2030, Vietnam aims to reduce child malnutrition below the level of public health significance and increase awareness about proper nutrition and lifestyle for the prevention of nutrition-related chronic diseases. In order to achieve these goals, multi-sector cooperation towards nutrition advocacy, surveillance and food-based nutrition interventions are some of the approaches being considered. Information from the SEANUTS can be one such source of evidence-based information that can be used for policy development, planning and development of nutrition programmes.
Acknowledgements
The authors thank the staff of the Department of Occupational and School Nutrition, the Department of Nutrition Surveillance and Policy and the Department of Community Nutrition, who participated in the data collection as members of the field team of the Vietnamese SEANUTS. They are also grateful to Dr Nguyen Thi Quynh Nga (Dutch Lady Vietnam) and Dr Panam Parikh (FrieslandCampina) for their support in the logistics of the project. The study was funded by FrieslandCampina.
B. K. L. N., P. D. and H. L. T. designed and supervised the study. V. A. N. D., N. T. T. and I. K. ensured the quality of the data and made a substantial contribution to the local implementation of the study. C. N. H. and T. T. D. assisted in the analysis and interpretation of the data. All authors critically reviewed the manuscript, had access to all data at all times and had primary responsibility for the final content of the manuscript. None of the authors or the research institutes has a conflict of interest. The results of the study will be used by FrieslandCampina, but it had no influence on the outcome of the study. FrieslandCampina provided funding for the SEANUTS, but it was not involved in the recruitment of the participants, cognitive performance testing and the final set of the results.
This paper was published as part of a supplement to the British Journal of Nutrition, the publication of which was supported by an unrestricted educational grant from Royal FrieslandCampina. The papers included in this supplement were invited by the Guest Editor and have undergone the standard journal formal review process. They may be cited. The Guest Editor appointed to this supplement is Dr Panam Parikh. The Guest Editor declares no conflict of interest.