


1 Introduction
Social scientists have expended significant resources to hand-code political text data. For example, the Comparative Agendas Project and the Manifesto Project have coded many documents across a variety of politically relevant categories (Budge et al. Reference Budge, Klingemann, Volkens, Bara and Tanenbaum2001; Jones and Baumgartner Reference Jones and Baumgartner2005). Scholars have used this hand-coded data to measure quantities of interest in studies on party competition, legislative politics, and political stability, among others (e.g., Böhmelt et al. Reference Böhmelt, Ezrow, Lehrer and Ward2016; Tavits and Letki Reference Tavits and Letki2009; Tsebelis Reference Tsebelis1999). Meanwhile, an increasing number of studies are using a hand-coded subsample of text data to automatically code unlabeled documents using supervised-learning techniques (Grimmer and Stewart Reference Grimmer and Stewart2013). These studies train and test supervised-learning models on certain types of text documents, such as tweets or legislative texts, to classify unlabeled text documents of the same type to the same categories (e.g., Anastasopoulos and Bertelli Reference Anastasopoulos and Bertelli2020; Barberá et al. Reference Barberá, Boydstun, Linn, McMahon and Nagler2021; Hopkins and King Reference Hopkins and King2010; Workman Reference Workman2015). We call this approach within-domain supervised learning.
In this paper, we study and assess the use of supervised-learning approaches to cross-domain topic classification of political texts. In this approach, the supervised-learning models are trained and tested based on a certain type of text document to classify texts belonging to a different type of text document. Compared with within-domain classification, cross-domain classification significantly reduces the data collection costs, because researchers can use existing training data. In contrast to unsupervised-learning approaches, such as latent Dirichlet allocation (LDA), we can validate our model using well-established metrics (Hastie, Tibshirani, and Friedman Reference Hastie, Tibshirani and Friedman2009; Wilkerson and Casas Reference Wilkerson and Casas2017).
We use existing hand-annotated party platforms from the manifesto corpus as a source corpus to categorize the topics of parliamentary speeches. Manifestos and parliamentary speeches are related to each other, because both types of documents focus on the policy priorities of parties or party members. However, they also have multiple differences. While manifestos detail parties’ electoral programs, speeches are statements of individual parliamentarians held after parliamentary elections (e.g., König, Marbach, and Osnabrügge Reference König, Marbach and Osnabrügge2013; Laver, Benoit, and Garry Reference Laver, Benoit and Garry2003; Proksch and Slapin Reference Proksch and Slapin2014). Cross-domain analysis could be used in future research to compare priorities expressed in party manifestos, speeches, coalition agreements, legislative texts, and social media data.
Methodologically, we start by training a machine classifier to learn topics from the annotated party platforms in the manifesto corpus. The manifesto corpus is one of the largest and most widely used hand-annotated corpora of political documents (e.g., Mikhaylov, Laver, and Benoit Reference Mikhaylov, Laver and Benoit2012; Slapin and Proksch Reference Slapin and Proksch2008; Zirn et al. Reference Zirn, Glavaš, Nanni, Eichorst and Stuckenschmidt2016). It includes over 115,000 English-language statements labeled according to 44 narrow topics and 8 broad topics.
After training the topic predictor using machine learning, we use it to classify topics in a corpus of parliamentary speech transcripts from the New Zealand Parliament. This target corpus encompasses the universe of parliamentary speeches for the period from 1987 to 2002. We calculate both the most likely topic and the entire distribution of topic probabilities for each speech.
To validate that the topic prediction works in the new domain, we compare predictions to those made by an expert coder for 4,165 parliamentary speeches. The coder received training from the Manifesto Project and coded speeches based on manifesto categories following the project’s guidelines. We find that the accuracy is similar to the expected accuracy inherent in human coder misclassification. We assess the replicability of our findings by asking three additional coders to code a subset of the speeches. For additional robustness, we show that the topic predictions have similar accuracy in speeches by U.S. Congressmen.
We propose two tools for diagnosing cross-domain classification without annotating the target corpus. First, we establish that the within-domain accuracy by topic is a strong predictor of cross-domain accuracy. Second, we introduce a diagnostic metric, feature congruence, which captures the semantic equivalence of a classified topic in the source corpus and the target corpus. Higher feature congruence predicts greater cross-domain accuracy for a given topic. Together, these diagnostic steps identify which topics can or cannot be reliably classified in a target domain, before expensive additional hand-annotation is undertaken.
Finally, we illustrate two applications of cross-domain supervised learning. First, we study the consequences of New Zealand’s 1993 electoral reform, which changed the system from first-past-the-post to mixed-member proportional representation (Vowles et al. Reference Vowles, Aimer, Karp, Banducci, Miller and Sullivan2002). We find that the reform significantly increased attention toward the issue of political authority, which includes discussions about political stability and party competence. In the second application, we study whether the gender of New Zealand parliamentarians is related to their debate participation on certain topics. We find that women speak more about welfare, whereas men talk more about external relations (Bäck and Debus Reference Bäck and Debus2019).
Our paper adds to the literature by demonstrating and assessing the opportunities to use supervised learning for cross-domain text classification in a setting that is relevant for applied political scientists. Recent work uses machine-learning models to analyze text across domains, but focuses on settings in which the source and target corpora differ more substantially. Burscher, Vliegenthart, and De Vreese (Reference Burscher, Vliegenthart and De Vreese2015) assess the cross-domain classification of Dutch-language news articles and parliamentary questions using issue categories from the Comparative Agendas Project. Yan et al. (Reference Yan, Sanmay, Lavoie, Li and Sinclair2019) use data on U.S. Congress speeches and media platforms to predict partisanship across domains. These studies find that cross-domain classification does not work well in their respective contexts.
Next, we present a toolkit that can be used to assess and validate the cross-domain classification of topics. In addition to inspecting within- and cross-domain classification accuracy metrics, we review their performance by topic and propose two tools for diagnosing cross-domain classification. Our tools can help conserve scarce empirical resources by helping researchers focus on analyzing topics that can be reliably measured in a target domain. Finally, we share our code, trained models, and hand-annotated data, which researchers can use to assess alternative methods for cross-domain classification.
2 Background: Topic Classification in Political Science
In political science, there are three main approaches to categorizing individual documents (Grimmer and Stewart Reference Grimmer and Stewart2013)—lexicon-based pattern matching, unsupervised topic models, and supervised-learning classifiers. This section discusses the pros and cons of these methods, as well as those of supervised learning for cross-domain classification.
Building upon Quinn et al. (Reference Quinn, Monroe, Colaresi, Crespin and Radev2010), Table 1 summarizes the main approaches along five design factors. First, design efficiency assesses the amount of time an expert researcher would spend designing a classification system. Second, annotation efficiency denotes the time needed to annotate documents. Third, specificity refers to how much the system can be targeted toward answering specific questions or exploring particular features in the data. Fourth, interpretability summarizes how straightforward it is to interpret the resulting topic classifications. Finally, validatability refers to the feasibility of validating topics—that is, checking whether the classifier is correctly grouping topics.
Table 1. Summary of design factors for topic classification methods.

Notes: Overview of the pros and cons of the main methods for topic classification in political science. The columns list the methods, whereas the rows list the design factors underlying the choice of method.
The dictionary- or lexicon-based approach works by searching for particular textual patterns in the text to assign topics. Researchers can create their own dictionaries by identifying words related to the topic of interest. For example, previous work identifies a lists of words related to “women” to detect documents on issues or topics that are important for women (e.g., Pearson and Dancey Reference Pearson and Dancey2011). Alternatively, researchers can use existing generic dictionaries, such as the Linguistic Inquiry and Word Count dictionary (Pennebaker et al. Reference Pennebaker, Booth, Boyd and Francis2015).
Custom dictionaries entail significant up-front costs for the researcher to build the tags dictionary, but after that, the annotation costs are zero. They have high specificity in the sense that they give the researcher full control over the dimensions of text they would like to target. For instance, if one is interested in women’s issues, one can search for that topic. The method is also highly interpretable, because the tags already contain expert knowledge and can be easily inspected.
Generic dictionaries (like custom dictionaries) have the advantages of negligible annotation costs and high interpretability. One can easily read the full list of terms to see what is going on. The advantage of generic dictionaries is the much lower up-front design time, as previous researchers have already produced and validated them. The trade-off is a significant loss in specificity, as one can only measure the dimensions of text that are available in the dictionaries.
The major downsides of both custom and generic dictionaries involve their highly constrained representation of language and limited validatability. The lexicon tags are unavoidably subjective, overinclusive, and underinclusive. For example, politicians use the word “women” in many contexts that are unrelated to the substantive representation of women’s issues. Some documents will have tags from multiple categories, and many documents will have no tags. There is no easy way to deal with these cases. One cannot tell how well the labels work without investing significantly in labeling the documents, which defeats the purpose of using dictionaries (the low annotation costs; see also Barberá et al. Reference Barberá, Boydstun, Linn, McMahon and Nagler2021).
The next major approach to text classification is topic modeling, such as LDA (Blei, Ng, and Jordan Reference Blei, Ng and Jordan2003), the expressed agenda model (Grimmer Reference Grimmer2010), the dynamic topic model (Quinn et al. Reference Quinn, Monroe, Colaresi, Crespin and Radev2010), or the structural topic model (Roberts et al. Reference Roberts, Stewart, Tingley and Airoldi2013). These algorithms provide a form of interpretable dimension reduction in which documents are transformed from high-dimensional counts over words to low-dimensional shares over topics. Topic models are a powerful tool, because they often produce intuitive, interpretable topics without any labeled training data (Catalinac Reference Catalinac2016; Greene and Cross Reference Greene and Cross2017; Lucas et al. Reference Lucas, Nielsen, Roberts, Stewart, Storer and Tingley2015).
The major advantage of topic models, as mentioned above, is that they do not require any labeled training data to classify documents into categories. Moreover, the design costs are very low, as, for example, in LDA, the only major design choice is how many topics, and most other steps are automated. In turn, there are zero annotation costs, as a trained topic model can instantly produce a set of topic probabilities for any given document. It allows documents to have multiple topics, and properly deals with all documents.
However, unsupervised topic models have limitations (Denny and Spirling Reference Denny and Spirling2018; Wilkerson and Casas Reference Wilkerson and Casas2017). The topics are learned directly from the data, so specificity is low and the topics may or may not represent the language dimensions in which the researcher is interested. In particular, unsupervised topic models do not work on multilingual corpora, because the learned topics will not match up across languages.Footnote 1 Interpreting topics requires additional work after estimating the model, and the produced topics can be sensitive to perturbations in the data, such as the steps taken in text preprocessing, featurization, and the number of topics chosen (Denny and Spirling Reference Denny and Spirling2018). This sensitivity is problematic, because there are no unified diagnostics for validating topic models (e.g., Grimmer and Stewart Reference Grimmer and Stewart2013; Roberts, Stewart, and Tingley Reference Roberts, Stewart, Tingley and Alvarez2016).
A third approach to classifying text is supervised learning, where researchers randomly sample some of the documents and hand-annotate the topics to create a labeled training dataset (e.g., Barberá et al. Reference Barberá, Boydstun, Linn, McMahon and Nagler2021; Drutman and Hopkins Reference Drutman and Hopkins2013; Workman Reference Workman2015). With a set of labeled documents in hand, one can use machine learning to encode the relationships between text features and topics. The trained machine-learning model can then automatically classify the topics in unlabeled data. Most political science studies use supervised learning for within-domain classification.
Supervised learning has several major advantages. First, like custom dictionaries, the system can be highly targeted toward classifying any dimension of the text that the researcher is interested in (high specificity). This semantic targeting includes the capacity to produce labeled corpora in multiple languages. Second, the topics are highly interpretable, because one can read the codebook provided to annotators. One can also look at example documents for each category. Third, and perhaps most importantly, supervised-learning classifiers can be rigorously validated (Denny and Spirling Reference Denny and Spirling2018). The standard machine-learning approach involves dividing the annotated data into a training set and a test set and assessing how well the classifier works in held-out test data (e.g., Hastie et al. Reference Hastie, Tibshirani and Friedman2009; Peterson and Spirling Reference Peterson and Spirling2018). The classification accuracy metrics in the test set provide a good estimate of how well the classifier will work in the unlabeled documents.
The supervised-learning approach has two general shortcomings related to costs. First, the researcher must design a set of topics and build detailed documentation and codebooks for annotators. Second, the annotators must spend a significant amount of time being trained, performing the annotations, and comparing their results with those of other annotators. Recent innovations have emerged to reduce these costs, such as active learning and the use of crowdsourcing for hand-annotation (Benoit et al. Reference Benoit, Conway, Lauderdale, Laver and Mikhaylov2016; Miller, Linder, and Mebane Reference Miller, Linder and Mebane2020). Still, for most applications, within-domain supervised learning requires a large investment of time and money to hand-code enough documents to make a classifier useful.
We focus on supervised learning for cross-domain classification, in which a text classifier is built in one domain (the source corpus) and applied in another domain (the target corpus). Although recent papers have explored the usefulness of cross-domain supervised learning (Burscher et al. Reference Burscher, Vliegenthart and De Vreese2015; Yan et al. Reference Yan, Sanmay, Lavoie, Li and Sinclair2019), there is very little evidence on its relative performance.
Analogous to the move from custom dictionaries to generic dictionaries, the cross-domain approach inherits some of the benefits of supervised learning for within-domain classification. For instance, cross-domain supervised learning exhibits higher levels of interpretability than unsupervised topic modeling. The classifier is interpretable in the same way as in within-domain supervised learning, as one can read the annotation codebooks and examine sample documents (but this time in the target corpus). Unlike dictionary methods and unsupervised topic modeling, cross-domain supervised learning can be validated using well-established metrics, such as classification accuracy (Géron Reference Géron2017; Hastie et al. Reference Hastie, Tibshirani and Friedman2009). More specifically, the classifier can be validated by annotating a sample of documents in the target corpus to compute cross-domain test-set accuracy metrics.
The main advantage of cross-domain classification over within-domain classification is that researchers can draw on existing labeled corpora as training data. This reduces the design costs to zero, since the researcher borrows the complete schema and codebooks of the original system. The annotation costs are largely eliminated, as the previous annotations are used to train the classifier. That said, some annotations are needed in supervised learning for cross-domain classification (as reflected in Table 1) to validate, rather than build, the classifier.
A disadvantage of cross-domain supervised learning, which is again analogous to the shift from custom to generic dictionaries, is a loss of specificity relative to within-domain classification. The set of questions and policies that one can analyze with supervised learning for cross-domain classification depends on the availability of existing labeled datasets. As the availability of training data expands, including consistent multilingual corpora, this disadvantage should become less relevant.
3 Cross-Domain Classification
This section outlines the implementation of a supervised-learning approach for cross-domain classification of political texts. We trained a classifier using an annotated source corpus and applied it to an unlabeled target corpus. First, we prepared the source corpus and the target corpus for machine learning. Second, we trained a machine-learning model based on the source corpus. Third, we predicted the topics of the texts of the target corpus. Finally, we annotated the target corpus and evaluated the model’s performance.
3.1 Source Corpus: Manifesto Project Party Platforms
Our source corpus consists of party platforms annotated by the Manifesto Project. We accessed the English-language manifesto statements from the following countries: Australia, Canada, Ireland, New Zealand, the United Kingdom, and the United States (Krause et al. Reference Krause, Lehmann, Lewandowski, Matthieß, Merz and Regel2018). Using manifesto statements from all of these countries increases our training sample size, which is important for machine classification tasks. The dataset has
 $N_S=115,410$
rows of annotated policy statements, where S indicates the “source” corpus.
$N_S=115,410$
rows of annotated policy statements, where S indicates the “source” corpus.
Each statement includes a hand-annotated topic code. The statement “and reduce global warming emissions” refers, for example, to the environment (category 501), whereas the statement “We can’t afford another dose of Labour” relates to political authority (category 305). The Manifesto Project usually has one trained coder for each country. Section A.1 in the Online Appendix shows an example statement for each topic.
We preprocessed the topic codes k following two specifications. The 44-topic specification (
 $K=44$
) takes into account all topics and merges categories that focus on the same topic but in a different direction (positive/negative), because we are interested in the topic rather than then sentiment of the text. For example, we combined the categories “per607 Multiculturalism: Positive” and “per608 Multiculturalism: Negative” to create one “Multiculturalism” topic. This procedure generates a sample of 44 categories.
$K=44$
) takes into account all topics and merges categories that focus on the same topic but in a different direction (positive/negative), because we are interested in the topic rather than then sentiment of the text. For example, we combined the categories “per607 Multiculturalism: Positive” and “per608 Multiculturalism: Negative” to create one “Multiculturalism” topic. This procedure generates a sample of 44 categories.
For the eight-topic specification (
 $K=8$
), we merged all categories into eight major topics following the Manifesto codebook (Budge et al. Reference Budge, Klingemann, Volkens, Bara and Tanenbaum2001)—external relations, freedom and democracy, political system, economy, welfare and quality of life, fabric of society, social groups, and no topic. This specification merged multiple similar categories, which facilitates the interpretation of the results. Section A.1 in the Online Appendix contains additional information about the corpus and this process.
$K=8$
), we merged all categories into eight major topics following the Manifesto codebook (Budge et al. Reference Budge, Klingemann, Volkens, Bara and Tanenbaum2001)—external relations, freedom and democracy, political system, economy, welfare and quality of life, fabric of society, social groups, and no topic. This specification merged multiple similar categories, which facilitates the interpretation of the results. Section A.1 in the Online Appendix contains additional information about the corpus and this process.
3.2 Corpus Pre-Processing
Before training the machine-learning model, we took standard preprocessing steps to transform the text data into a document-term matrix. First, we removed uninformative features—stopwords, punctuation, and capitalization. We then took the leftover words and constructed N-grams (phrases) up to length three—words, bigrams, and trigrams. We dropped N-grams that appeared in fewer than 10 documents, as they contain little predictive information. We also dropped those that appeared in more than 40% of the documents, as these are likely specific to manifestos and not distinctive to specific topics. Finally, we computed term-frequency/inverse-document-frequency weights for each N-gram, treating each manifesto statement as a document. The resulting document-term matrix has
 $M=19,734$
columns, with each column is indexed by j.Footnote
2
$M=19,734$
columns, with each column is indexed by j.Footnote
2
3.3 Machine Classifier Training
The next step was to train a machine-learning model based on the document-term matrix of the source corpus. A range of machine-learning classifiers could be used for cross-domain classification. We employed the regularized multinomial logistic regression model, a widely used multiclass prediction model (Géron Reference Géron2017; Hastie et al. Reference Hastie, Tibshirani and Friedman2009). We trained separate models for the 8-topic and 44-topic labels.
We used the standard approach to machine classification. First, we split the data into a 75% training and 25% held-out test set. Second, we learned hyperparameters (the regularization penalty and class weighting) by conducting a threefold cross-validation grid search in the training set. This procedure determined that the best parameters were an inverse of the regularization strength equal to two and no weighting of the categories (for both 44-topic and 8-topic models).Footnote 3
We experimented with other machine-learning algorithms, including a random forest, gradient boosting, and a neural net. These models performed similarly in classifying manifesto statements to topics. For example, Section B.5 in the Online Appendix reports similar results for gradient boosting. However, these models have more hyperparameters to tune and take much longer to train. Thus, we decided to use the regularized multinomial logistic regression model for this analysis.
3.4 Target Corpus: New Zealand Parliamentary Speeches
Our target corpus consists of speeches delivered by members of the New Zealand Parliament from 1987 to 2002. We chose this target corpus for three reasons. First, New Zealand’s Parliament uses the English language, which facilitates analysis, because the manifesto corpus includes a large number of hand-annotated English statements. Second, the trained classifier is applicable to text data from other English-language parliaments, such as the U.S. Congress and U.K. Parliament. Third and finally, this period in New Zealand is empirically interesting because of an electoral reform in 1993, which we examine to assess the usefulness of cross-domain supervised learning.
We extracted the speech data from the Hansard, which is the official record of the New Zealand Parliament. We removed speeches given by the speaker of parliament and his/her deputy. Next, we removed short oral contributions from “government member(s)” and “opposition member(s)” without further information on the name of the speakers. We also dropped speeches with fewer than 40 characters excluding numbers (Peterson and Spirling Reference Peterson and Spirling2018) and Maori-language speeches for which an official translation was not provided. The final dataset contains
 $N_T=290,456$
documents, where T indicates the target corpus. Section A.2 in the Online Appendix provides additional information on the data.
$N_T=290,456$
documents, where T indicates the target corpus. Section A.2 in the Online Appendix provides additional information on the data.
3.5 Predicting Topics in Target Corpus
The text classifier described in Section 3.3 can be applied to any snippet of text. The prediction pipeline takes a string of text and outputs a probability distribution over topic categories. In this application, we first used the vocabulary and the document frequencies from the source corpus in the preprocessing step. These were applied to vectorize each parliamentary speech, producing N-gram frequencies for speech i. These frequencies are the features used to compute the model predictions.
Second, we took the logistic regression classifiers for the 44-topic and 8-topic specifications, trained them on the full 100% sample of manifesto statements, and applied them to the feature vectors for each parliamentary speech. The model outputs a set of predicted probabilities across topic classes based on the logistic regression coefficients learned in the source corpus. Summary tabulations of the speech topics by year and in total are reported in Section B.3 in the Online Appendix.
The predicted probabilities sum to one and can be interpreted as the shares of a document that is allocated to each topic. Alternatively, one can take the highest-probability topic and mark a speech as having only that topic. The choice between a single-topic or multiple-topic representation will depend on the downstream empirical task.
3.6 Annotation of Target Corpus Validation Set
To validate the cross-domain predictions, we arranged for the hand coding of a sample of documents in the target corpus. We follow previous work that has used human judgment to validate the statistical analysis of political documents (Lowe and Benoit Reference Lowe and Benoit2013). We hired the manifesto coder for New Zealand, who was trained by the Manifesto Project and has coded the manifestos from New Zealand for the Manifesto Project.
The coder annotated a random sample of 4,165 parliamentary speeches in one manifesto category. We only gave the coder the text of the speech and no metadata, such as the date or speaker. We asked the coder to code based on the Manifesto Project. We annotated topics by speech, as our downstream empirical analysis is at the speech level, which allowed us to obtain much more data than sentence-level annotations. This approach is in line with Barberá et al. (Reference Barberá, Boydstun, Linn, McMahon and Nagler2021, 28–29), who find that breaking larger text units into sentences does not improve classification performance. The annotations took a total of 52.5 hours.
We hired three additional coders to assess inter-coder reliability within the New Zealand target corpus (Mikhaylov et al. Reference Mikhaylov, Laver and Benoit2012). Like the main coder, these coders also received training from the Manifesto Project in English-language platforms; we asked them to code according to the Manifesto Project methodology. The coders were not experts on New Zealand politics, however. We drew a random sample of 250 speeches from the 4,165 speeches annotated by the first coder. Each of the three secondary coders annotated the same subsample of 250 speeches, which gave us four annotations in total.
Finally, to assess the method’s potential broader generalization, we also hand-annotated a corpus of congressional speeches from the United States. We hired the Manifesto Project coder for the United States and asked him to code a random sample of 150 speeches from the House of Representatives. The sample was drawn from all speeches contained in the Congressional Record for the period from August 1987 to July 2002. All five coders assigned each speech to one manifesto category.
3.7 Model Performance Evaluation
We followed standard machine-learning approaches to evaluate the performance of our machine classifier. For the within-domain performance, we assessed the predictive performance in a 25% held-out test sample. For the cross-domain performance, we compared the machine predictions to the new annotations provided by the human coder. We also examined performance by class, because researchers are likely to be interested in particular topics for any given empirical application. In the Online Appendix, we use bootstrapping to assess the robustness of the metrics to sampling variation.
We report a variety of metrics to evaluate and understand model performance. First, we report the simple (top-1) accuracy. This is the proportion of predicted topics (i.e., the topic with the highest predicted probability) in the test set that are also the “true” topic as selected by human annotation. Note that simple accuracy is equal to the model’s micro-weighted aggregate precision, recall, and F1 score. As the manifesto corpus includes multiple similar categories (e.g., economic goals and economic growth), we do not only report how often the true topic is correctly ranked first, as well as more broadly how often it is highly ranked and within the top few topics by predicted probability. We therefore calculated the top-3 (and top-5) accuracy—the proportion of observations for which the true class (from the hand-annotations) is within the top three (or five) categories as ranked by their predicted probability defined by the machine classifier.
Simple accuracy sums across test samples, such that categories with more documents in the test sample are weighted higher in the metrics. Therefore, inaccurate predictions in the less frequent categories could be missed. To provide a more rounded aggregate report, we computed the balanced accuracy, which is the (unweighted) average recall (fraction of true-class documents correctly identified) across output categories. Finally, we report the macroweighted F1 score, which is the (unweighted) average of the F1 scores (harmonic mean of precision and recall) across all categories.
4 Classification Results
This section reports the results on the performance of our classifier. We show that it works in-domain, in that it can reliably reproduce the hand-coded topic labels in the manifesto corpus. We also assess its performance in the domain of New Zealand parliamentary speeches.
4.1 Aggregate Performance
The classification results are summarized in Table 2. Columns 1 and 2 report the results for the within-domain (source–source) predictions (manifesto-trained model applied to manifesto test corpus), whereas columns 3 and 4 report the results for the cross-domain (source–target) predictions (manifesto-trained model applied to the corpus of newly annotated New Zealand parliamentary speeches). Within each test corpus, we report metrics for 44 narrow topics (columns 1 and 3) and 8 broad topics (columns 2 and 4).
Table 2 Overview of classifier performance in test set.
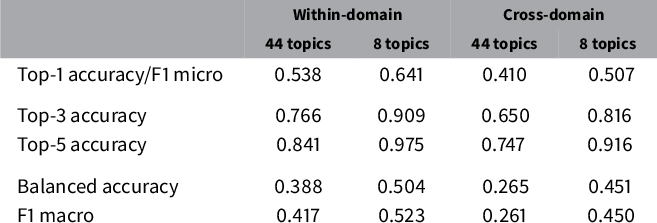
Notes: Within-domain denotes the performance of a classifier trained on manifesto statements and evaluated on (held-out) manifesto statements. Cross-domain describes the performance of a classifier trained on manifesto statements and evaluated on parliamentary speeches. 44 topics and 8 topics refer to the models with the narrow and broad output classes. Top-1, top-3, and top-5 accuracies, balanced accuracy, and F1 macro are the performance metrics.
Column 1 reports the 44-topic within-domain specification. It shows that the trained model predicts the correct category label 53.8% of the time. As expected, this is worse than the training-sample prediction (71% accurate), as the model somewhat overfits the training data. As there are 44 topic labels to be assigned, choosing randomly would be correct about 2% of the time. Choosing the top category would be correct 13% of the time.
The within-domain efficacy of the classifier is further demonstrated in the top-3 accuracy (76.6%) and the top-5 accuracy (84.1%). These metrics show that even when the true class is not picked as having the highest probability, it is usually highly ranked. So, if one is using predicted probabilities in an empirical analysis, one can have some confidence that they contain information about textual variation in policy dimensions.
To qualify these statements, we also report balanced accuracy (0.388) and macroweighted F1 (0.417). These worse numbers reflect that, perhaps unsurprisingly, the less frequent categories are more likely to be misclassified. Hence, empirical analyses of less frequent topics should be undertaken with caution.
We obtained better performance in the eight-topic within-domain prediction (column 2) due to the smaller number of classes that the machine needs to assign. The test-sample accuracy is 64.1%, closer to the in-sample accuracy of 76% and significantly better than guessing randomly (12.5% accuracy) or guessing the top category (31% accuracy). The top-3 accuracy (91%) is similarly encouraging. As before, the balanced accuracy (0.504) and F1 score (0.523) indicate lower performance for the less frequent classes.
Next, we consider the cross-domain results (columns 3 and 4). Examining the results on the 44 topics, we find an overall top-1 accuracy of 0.410. This is significantly better than guessing at random (an accuracy of 2%) or guessing the most common hand-annotated class (an accuracy of 19%). Perhaps unsurprisingly, the accuracy is lower than the in-domain accuracy (54%). The top-3 accuracy (0.650) and top-5 accuracy (0.747) are even more encouraging.
At the bottom of the table, the metrics for the eight-topic specification are also relatively encouraging. The overall top-1 performance is 51%, which is not much less than the within-domain accuracy of 0.641. It is much better than guessing randomly (0.125) or the most common class (0.256). The top-3 and top-5 accuracies are 0.816 and 0.916. This increase in accuracy compared to the 44-topic specification is similar to the increase we achieved using within-domain supervised learning.
Section B.11 in the Online Appendix uses a bootstrapping procedure to assess the sampling variation in the within-domain metrics. We produce a distribution of the metrics from models trained on resampled subsets of the manifesto corpus. We find that the mean and median accuracy across the samples are identical to the baseline accuracy (to two decimal places), with a standard deviation 0.003 (relative to a mean accuracy of 0.539 for 44 topics and 0.645 for 8 topics). Thus, the metrics are not sensitive to training-set sampling variation.
To contextualize these results, we compare them to the performance of human manifesto coders reported by Mikhaylov et al. (Reference Mikhaylov, Laver and Benoit2012). The authors compare the Manifesto Project’s master coding of 179 quasi-sentences to human coding. The quasi-sentences come from a manifesto from the United Kingdom and New Zealand. They find significant human coder error in the manifesto data: they aggregate all manifesto statements into three categories and report accuracies between 0.59 and 0.70. Unsurprisingly, coders’ accuracy without aggregating into three broad categories is lower. Our within-domain and cross-domain classification accuracies are quite good in comparison.
4.2 Performance by Topic
For most empirical applications, one would be interested in analyzing variation in particular topics. Therefore, it is important to assess the variation in predictive performance across topics. To illustrate this type of evaluation, we report topic-level metrics. Further details on this issue can be found in Sections B.1 and B.2 in the Online Appendix.
First, we build confusion matrices using the eight-topic specification for the within-domain (Table 3a) and cross-domain (Table 3b) predictions. In Table 3, rows index true categories, whereas columns index predicted categories. In Table 3a, a document is a test-set manifesto statement; in Table 3b, a document is a hand-annotated New Zealand parliamentary speech. The numbers in the cells capture how often the model classifies a document from the row class to the column class. The color (ranging from white to yellow to green) reflects the relative within-row frequency; darker colors indicate that the cell has more weight than other cells in the row. A good classifier will result in a confusion matrix with the highest counts on the diagonal.
Table 3 Classifier performance with eight topics: confusion matrices.
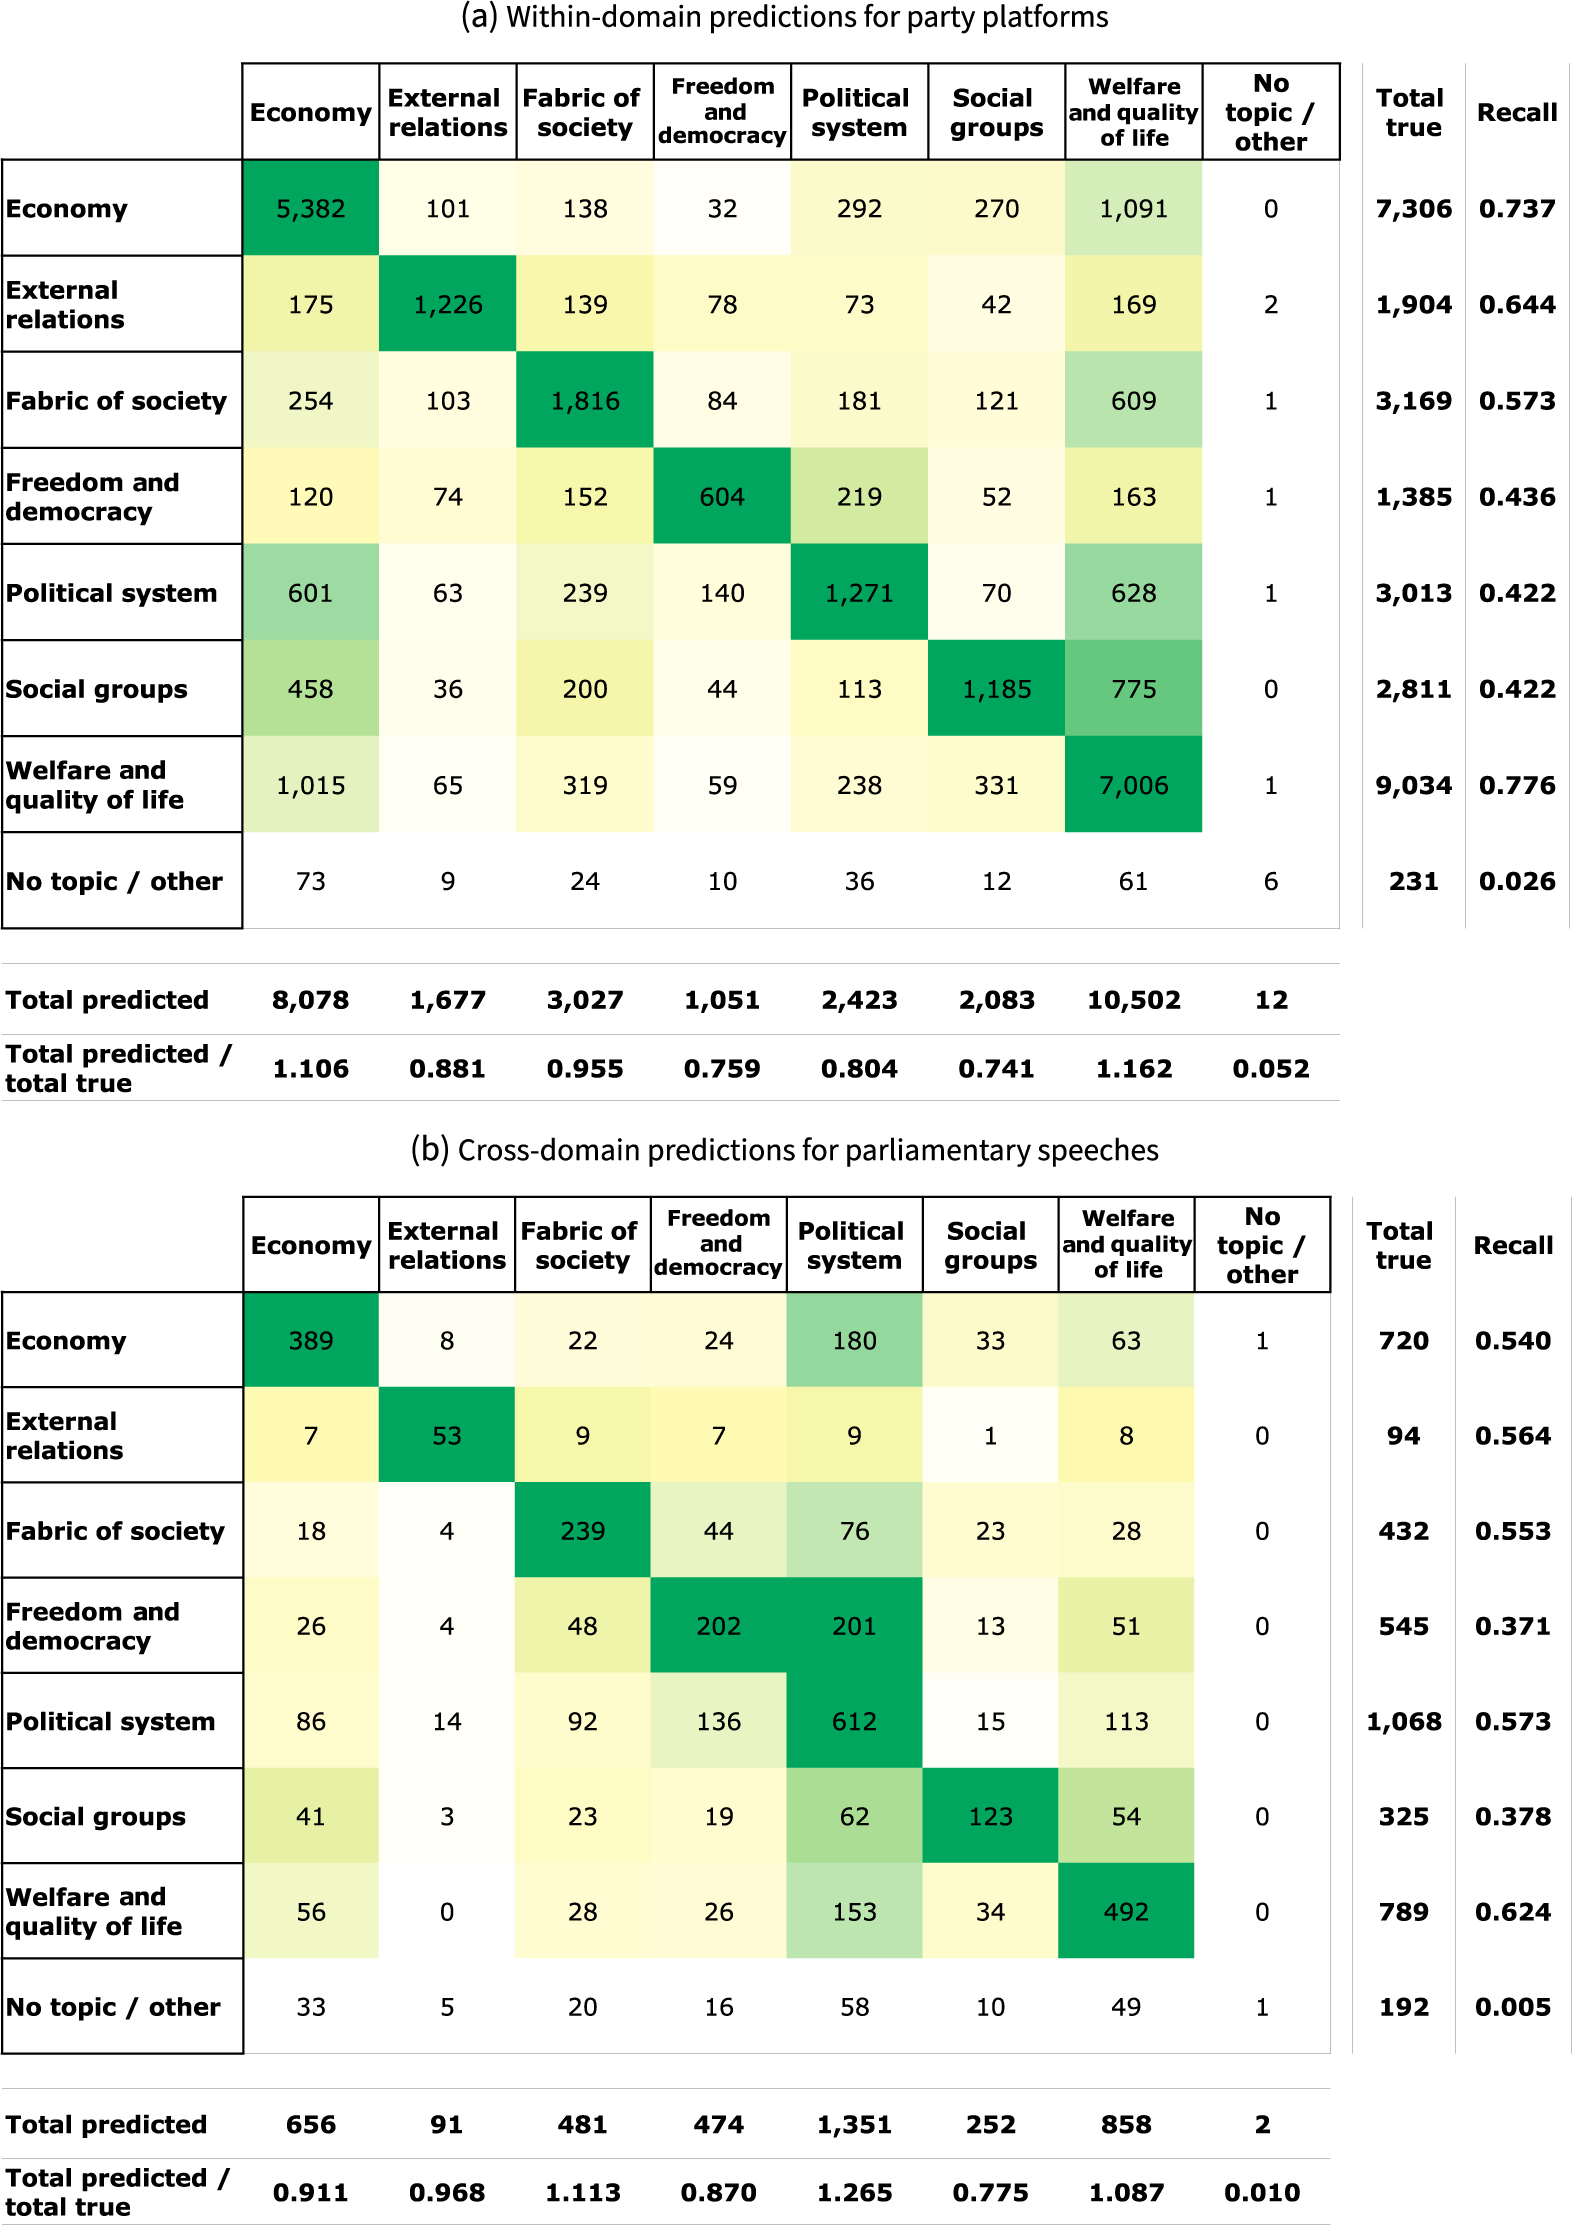
Notes: Table 3a refers to a model trained on manifesto statements; the predictions are from held-out manifesto statements. Table 3b refers to the same model, but the predictions are from newly annotated parliamentary speeches. The numbers in the cells represent the count of the number of row-class instances classified to the column class. The colors reflect the relative within-row frequency; darker green indicates higher counts. The rightmost column reports recall for the class. The bottom row gives the ratio of the number of predictions to the number of true instances in the class.
For example, the first row of Table 3a shows that for the topic economy, the within-domain model correctly classifies 5,382 of 7,306 manifesto statements; 1,091 economy statements are incorrectly classified as welfare and quality of life, whereas 833 are incorrectly assigned to one of the other five categories (besides no topic). These numbers correspond to a topic-specific recall (top-1 accuracy) of 0.737, reported in the right-most column. The economy column reports the counts for each true topic that is (mis)classified as economy. For example, 1,015 welfare documents and 601 political system documents are misclassified as economy. This is perhaps not too surprising given the potential semantic overlaps in discussions of these topics.
At the bottom of the column (and that of each topic), we report the ratio of total predicted count to total true count, which tells us how well the model replicates the distribution of topics. A value of 1 would mean that the distribution is the same; less than 1 indicates that the predictions are underrepresentative for this topic; greater than 1 means the predictions are overrepresentative for this topic. For the topic of economy, a predicted-to-true ratio of 1.106 means the predicted frequency of this topic is reasonably similar to the true frequency in the held-out test set.
As a whole, Table 3a shows that the within-domain model effectively replicates the annotated classes (besides the infrequent “other topic” class). The true category is selected most often across all topics. The minimum recall is a decent 0.422 (social groups), going all the way up to 0.776 (welfare and quality of life). The most common misclassifications are somewhat intuitive. For example, many statements are classified into the welfare category, which could reflect that it is the most numerous category and is somewhat broad in its definition. Looking at the bottom row, meanwhile, we can see that overall, the distribution of topics is replicated quite well. Economy and welfare are slightly overrepresented, whereas the other categories (especially social groups) are somewhat underrepresented.
Next, we consider the cross-domain eight-topic confusion matrix in Table 3b. The format of this matrix is the same as in Table 3a, except that the predictions are made in the target corpus (New Zealand Parliament speeches) and comparisons are made to our new human annotations. Overall, the results are quite encouraging about how well the model generalizes to the new corpus. Within each category, the correct class has by far the highest number of retrieved documents. In the economy topic, for example, the model correctly identifies 389 out of 720 speeches, corresponding to a recall of 0.540. 180 economy speeches are incorrectly assigned to the political system topic, which is the second-most selected topic in this row. In the economy column, the most frequent topic that is misconstrued as economy is also political system. This is likely because these topics are often discussed in the same speech.
The lowest recall of 0.371 (freedom and democracy) is very similar to the lowest recall of a topic in the within-domain model (0.422). The recall does not rise above 0.624, however. Because these data are at the speech level (rather than at the statement level, as in the source corpus), and speeches can touch on multiple topics, this relative decrease in performance is perhaps not too surprising. The tendency of misclassifications also looks different: whereas the within-domain model tends to categorize them as related to welfare, the cross-domain model tends to put documents into the political system category.
The relative distribution of predictions (Table 3b, bottom row) is also quite encouraging. The distribution is comparable to the distribution predicted by the within-domain model. But there are some interesting differences. For example, while economy is overrepresented in the party platforms, the topic is underrepresented in the parliamentary speeches.
For the 44-topic specification, confusion matrices are somewhat unwieldy, so we report the metrics in a table. In Table 4, each row is a topic, as indicated in the first column. Then, there are two sets of columns corresponding to the within-domain and cross-domain classifiers. Within these column groups, the first column (N) denotes the number of documents (statements or speeches, respectively) in the annotated test set. The remaining columns indicate topic-specific accuracy—top-1, top-3, and top-5, respectively. As mentioned above, top-1 accuracy is equivalent to class-level recall. Finally, the right-most column (Ratio) reports the ratio of cross-domain top-1 accuracy to within-domain top-1 accuracy. The table is sorted by cross-domain top-1 accuracy, from highest to lowest.Footnote 4
Table 4 Classifier performance with 44 topics.
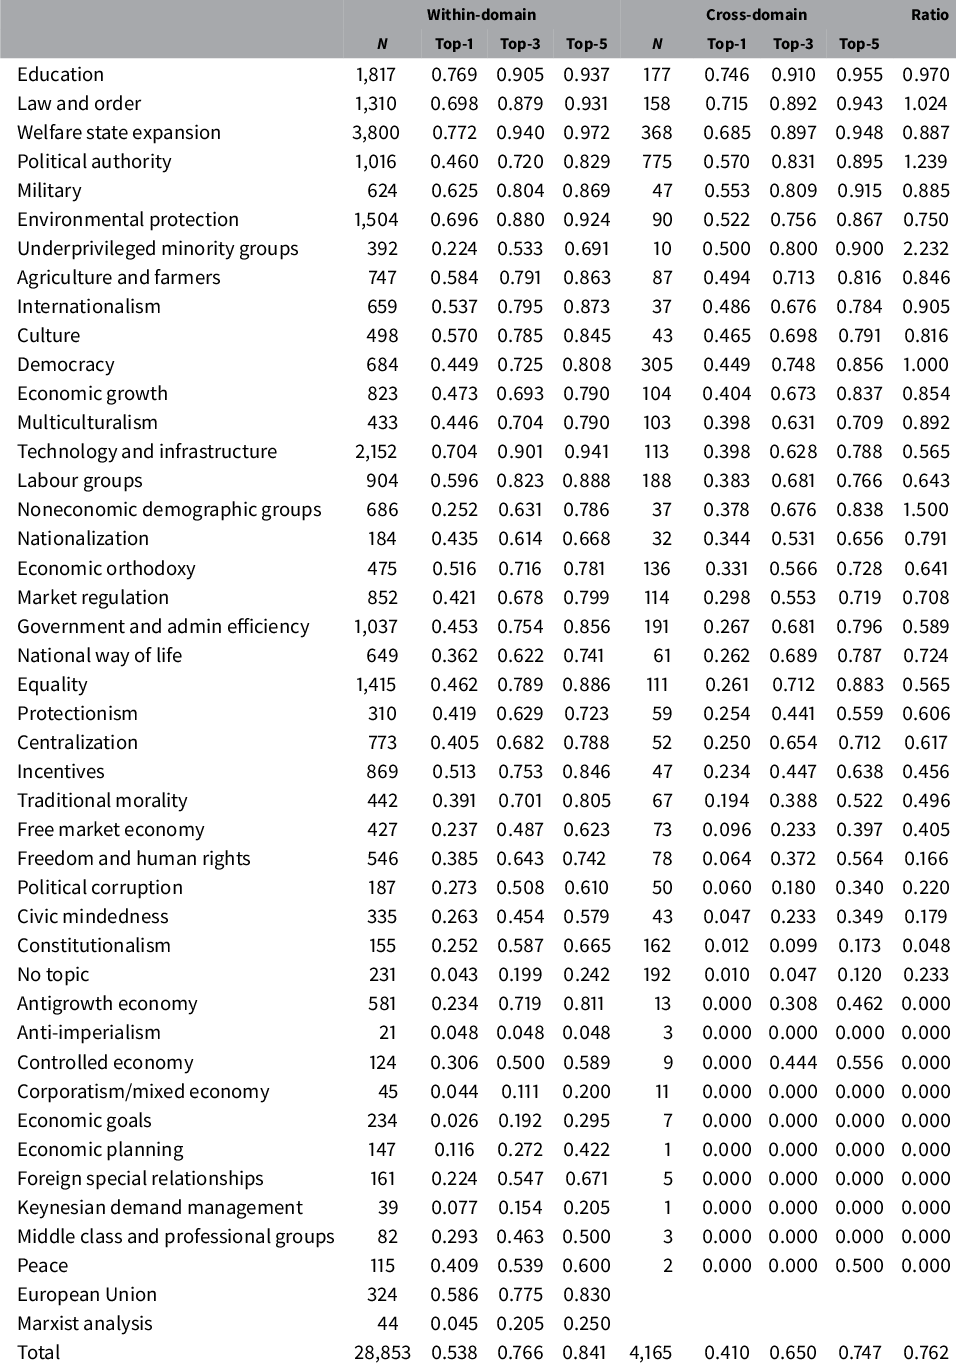
Notes: Rows are topics, and columns are metrics. Within-domain means a model trained on manifesto statements and evaluated on held-out manifesto statements. Cross-domain indicates the manifesto-trained model evaluated on newly annotated New Zealand parliament speeches. N denotes the number of documents that are hand-labeled as that category. Top-1, top-3, and top-5 are the accuracy metrics. Ratio is the cross-domain top-1 accuracy, divided by the within-domain top-1 accuracy.
Overall, the 44-topic metrics produce a more mixed picture of our classifier’s performance. Some topics have quite poor within-domain performance. For example, economic goals has 0.026 accuracy, whereas anti-imperialism has 0.048 accuracy. Yet some topics are highly distinctive and easy to classify: welfare state expansion has 0.772 top-1 and 0.940 top-3 accuracy, for example, whereas the corresponding figures for education are 0.769 and 0.905. The other topics are somewhere in between; the overall within-domain average accuracy is 0.538 (as indicated in Table 2).
Some of these poor-performing categories can be explained by the Manifesto Project’s codebook choices. Topics like anti-imperialism (along with corporatism/mixed economy, Keynesian demand management, Marxist analysis, and middle class and professional groups) are rare (at least in English-language party platforms) and could probably be folded into other, broader topics. Some topic pairs are difficult to distinguish semantically, such as economic goals versus economic growth, and the machine classifier tends to fold the smaller category into the larger one. This type of subtle distinction is unlikely to play an important role in downstream empirical applications.
The cross-domain performance is slightly worse overall. The distribution of the gap between within-domain and cross-domain is shown in Figure A11 in the Online Appendix. Unsurprisingly, any topic that the within-domain classifier could not categorize also performs poorly in the cross-domain classifier. We revisit this issue below as a potential diagnostic tool. Some topics (European Union and Marxist analysis) do not feature in the parliamentary speeches, so we cannot compute metrics for them. Ten topics, although infrequent, have zero accuracy. A number of topics have quite poor performance, with the classifier even failing to rank the correct topic within the top-5 most of the time. These metrics demonstrate the importance of some target-corpus validation, as machine-coded data on these poor-performing topics should not be used for any empirical analysis.
If we limit to the top rows of the table (based on the sort), the cross-domain classification is quite good. The performance for education (top-1 accuracy = 0.746, top-3 = 0.910) is about the same as for the within-domain classifier. A handful of topics perform even better cross-domain than within-domain: law and order (top-1 = 0.715), political authority (top-1 = 0.570), underprivileged minority groups (top-1 = 0.500), and noneconomic demographic groups (top-1 = 0.378). Of the 44 topics, 7 are ranked first correctly at least half of the time and have good top-3/top-5 accuracy. For 23 topics, the correct topic is ranked within the top-3 at least half of the time.
The relevance of the variation will depend on the downstream empirical task. Most of the categories with bad accuracy are quite rare. In our first application below, we focus on political authority—one of the better-performing topics for cross-domain learning.
4.3 Interpreting the Model Predictions
To increase our confidence that the model is properly identifying topics in the target corpus, we undertook further analysis to interpret the model predictions. First, we read the 10 parliamentary speeches with the highest probability of belonging to each topic, using both the 44-topic and 8-topic specifications. In general, the speeches corresponded very well to the specified topics, and we saw no evidence that they were driven by correlated features. Section B.6 in the Online Appendix includes text snippets for each of these topics.
To more systematically analyze the connection between text features and predicted topics, we created a feature importance measure to identify which phrases are significantly correlated with topics in the source and target corpora. We use a simple metric computed from ordinary least squares (OLS) regressions. Formally, for each output topic class k and each N-gram feature j, we run a bivariate OLS regression model
 $$ \begin{align} \hat{p}_{i}^{k} = \alpha + \beta_{jk} x^j_i + \epsilon_i, \ \forall j,k, \end{align} $$
where
 $\hat {p}_{i}^{k}$
is the predicted probability that document i is about topic k and
$\hat {p}_{i}^{k}$
is the predicted probability that document i is about topic k and
 $x^j_i$
is the relative frequency of N-gram j in document i. These regressions generate a dataset of coefficients
$x^j_i$
is the relative frequency of N-gram j in document i. These regressions generate a dataset of coefficients
 $\hat {\beta }_{jk}$
and associated standard errors
$\hat {\beta }_{jk}$
and associated standard errors
 $\widehat {\mathrm {s.e.}}_{jk}$
, separately for the manifesto statements and the parliamentary speeches.
$\widehat {\mathrm {s.e.}}_{jk}$
, separately for the manifesto statements and the parliamentary speeches.
To identify statistically significant features for each topic, we compute the t-statistic
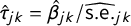 $\hat {\tau }_{jk}=\hat {\beta }_{jk}/\widehat {\mathrm {s.e.}}_{jk}$
in both the source and target corpora. Important features have a high (absolute value) t-statistic. To help further ensure that the features are interpretable, we constrain the vocabulary to a set of idiomatic noun phrases. This procedure is described in detail in Section B.7 in the Online Appendix, which also includes word clouds depicting the top-ranked phrases and t-statistics.
$\hat {\tau }_{jk}=\hat {\beta }_{jk}/\widehat {\mathrm {s.e.}}_{jk}$
in both the source and target corpora. Important features have a high (absolute value) t-statistic. To help further ensure that the features are interpretable, we constrain the vocabulary to a set of idiomatic noun phrases. This procedure is described in detail in Section B.7 in the Online Appendix, which also includes word clouds depicting the top-ranked phrases and t-statistics.
Figure 1 illustrates the results of this analysis using scatter plots. Each plot focuses on one of the eight topics k. In each plot, the vertical axis indexes the t-statistic
 $\hat {\tau }_{jk}^S$
for k in the manifesto platform statements, whereas the horizontal axis indexes
$\hat {\tau }_{jk}^S$
for k in the manifesto platform statements, whereas the horizontal axis indexes
 $\hat {\tau }_{jk}^T$
for k in the New Zealand parliamentary speeches. Each dot on the plot corresponds to an N-gram j, printed as a marker label. The vocabulary is filtered to the intersection of N-grams that are predictive for at least one topic in either corpus. Looking at the plots by topic, we find that there is a strong relationship in general between the t-stats in the source and target corpus. This is reassuring evidence that the content of the topics is similar in the manifesto and the parliamentary speech data. Hence, the topics in both data sources can be interpreted in a similar manner. The exception is no topic (Panel (h)), which intuitively would be less well defined in terms of political language.
$\hat {\tau }_{jk}^T$
for k in the New Zealand parliamentary speeches. Each dot on the plot corresponds to an N-gram j, printed as a marker label. The vocabulary is filtered to the intersection of N-grams that are predictive for at least one topic in either corpus. Looking at the plots by topic, we find that there is a strong relationship in general between the t-stats in the source and target corpus. This is reassuring evidence that the content of the topics is similar in the manifesto and the parliamentary speech data. Hence, the topics in both data sources can be interpreted in a similar manner. The exception is no topic (Panel (h)), which intuitively would be less well defined in terms of political language.

Figure 1 N-gram correlations with topics for source and target corpus. Notes: Scatter plot for the eight topics, showing the t-stats of N-grams in the manifesto corpus (vertical axis) against the t-stat in the speech data.
4.4 Diagnostic Tools for Cross-Domain Classification
Human annotation in the target corpus is costly, so it is useful to have preliminary diagnostic tools available using only within-domain metrics. We recommend two approaches to producing diagnostics without annotating any documents in the target corpus. While these diagnostics do not provide a clear rule regarding which analyses will work, they offer useful inputs that can be considered along with other relevant factors.
First, one can use the within-domain performance to predict cross-domain performance. As already mentioned, topics with poor within-domain accuracy also tend to have poor cross-domain accuracy (see also Yan et al. Reference Yan, Sanmay, Lavoie, Li and Sinclair2019). Figure A12 in the Online Appendix clearly shows that within-domain and cross-domain accuracies are highly correlated (correlation coefficient = 0.79). Therefore, within-domain metrics can help researchers assess which cross-domain topic measurements are likely to work well for empirical analysis.
Second, we use the feature importance metrics from Section 4.3 to compute a measure of feature congruence by topic. Formally, we define the feature congruence of topic k as
 $F_k=\mathrm {corr}(\hat {\tau }_{jk}^S, \hat {\tau }_{jk}^T)$
, where corr() is Pearson’s correlation and
$F_k=\mathrm {corr}(\hat {\tau }_{jk}^S, \hat {\tau }_{jk}^T)$
, where corr() is Pearson’s correlation and
 $\hat {\tau }_{jk}$
gives the estimated OLS t-statistic for N-gram j’s frequency regressed on topic k’s predicted probability (from the model trained on manifesto statements). As above, S and T indicate manifesto statements (source corpus) and parliamentary speeches (target corpus), respectively. This congruence measure is the correlation of the topic’s feature importance weights from the cross-domain model with those from the within-domain model (at the N-gram level). A strong correlation indicates that the model predictions are associated with similar language in both domains.
$\hat {\tau }_{jk}$
gives the estimated OLS t-statistic for N-gram j’s frequency regressed on topic k’s predicted probability (from the model trained on manifesto statements). As above, S and T indicate manifesto statements (source corpus) and parliamentary speeches (target corpus), respectively. This congruence measure is the correlation of the topic’s feature importance weights from the cross-domain model with those from the within-domain model (at the N-gram level). A strong correlation indicates that the model predictions are associated with similar language in both domains.
Figure 2 illustrates the extent to which
 $F_k$
can predict cross-domain performance. The vertical axis denotes the top-3 cross-domain classification accuracy, and the horizontal axis is the feature congruence measure. A dot corresponds to one of the topics with the associated label attached. We find that feature congruence is highly correlated with cross-domain classification accuracy (correlation coefficient = 0.70). For example, the education, welfare, and law/order topics have both high accuracy and high across-domain feature-importance congruence. Meanwhile, a number of topics (e.g., no topic and free market economy) have both low accuracy and low congruence.Footnote
5
$F_k$
can predict cross-domain performance. The vertical axis denotes the top-3 cross-domain classification accuracy, and the horizontal axis is the feature congruence measure. A dot corresponds to one of the topics with the associated label attached. We find that feature congruence is highly correlated with cross-domain classification accuracy (correlation coefficient = 0.70). For example, the education, welfare, and law/order topics have both high accuracy and high across-domain feature-importance congruence. Meanwhile, a number of topics (e.g., no topic and free market economy) have both low accuracy and low congruence.Footnote
5

Figure 2 Feature congruence and cross-domain classification accuracy. Notes: Scatter plot for the 44 topics, showing each topic’s top-3 cross-domain classification accuracy (vertical axis) against the feature congruence, as defined in the text.
These diagnostic tools can be used to filter out topics to produce more precise overall measurements. For example, if we only keep topics that are above the median in top-3 within-domain accuracy and feature congruence, the top-3 cross-domain balanced accuracy increases from 0.47 to 0.68.
4.5 Inter-Coder Reliability and Application to Other Countries
Section B.9 in the Online Appendix reports the results of our inter-coder reliability analysis. We find that the human coders agree with each other at about the same rate that our machine classifier agrees with the manifesto annotations. The cross-domain classifier accuracy does not vary substantially across human coders.
The classifier also works quite well in a (smaller) corpus of U.S. congressional speeches (see Section B.10 in the Online Appendix). Using the classifier trained on 44 topics, we find that the top-1 accuracy is 0.440. When we predict eight topics, the top-1 accuracy increases to 0.520. These numbers are comparable to those computed using the new hand-annotations for New Zealand, and they suggest that the cross-domain classifier could work in other contexts besides the main application implemented here.
5 Empirical Applications
Cross-domain topic classification has broad potential scope for interesting empirical applications. In what follows, we illustrate two case studies. The first examines the effect of New Zealand’s electoral reform on topics discussed in parliament. The second investigates the topics of parliamentary speeches broken down by speaker’s gender.
5.1 Effect of Electoral Reform on Speech Topics
Previous research suggests that the 1993 electoral reform fundamentally changed the country’s parliamentary practices. Unlike in the prereform period, afterward parties had to form coalition and minority governments, which are generally associated with lower stability (Powell Reference Powell2000; Vowles et al. Reference Vowles, Aimer, Karp, Banducci, Miller and Sullivan2002). Furthermore, parliamentary Standing Orders of the parliament were revised to explicitly reference parties and give them an important role in allocating speaking time (Proksch and Slapin Reference Proksch and Slapin2014). At the same time, parliamentarians had little experience with proportional representation and had to adapt to the new system (Taagepera and Shugart Reference Taagepera and Shugart1989). Multiple parliamentarians also split from their party to form new parties. In light of the political developments described above, our main theoretical expectation is that the reform increased discussions about political authority, which covers issues related to stability and party competence. Some example speeches on this topic are shown in Section B.6 in the Online Appendix.
This application illustrates the usefulness of cross-domain learning in three ways. First, this analysis would be difficult to conduct using a lexicon approach, because there are no established lexicons for this topic: issues of stability and competence are somewhat abstract and context dependent. The associated words in our target domain (Panel (f) of Figure A9 in the Online Appendix) are specific to New Zealand and would produce many false positives (e.g., the party names, and verbs like “say” and “promise”). Second, this analysis cannot be conducted with an unsupervised topic model because of the specificity issue: topic models cannot target a particular dimension of speech, such as political authority. It would only be through good luck, and potentially significant manipulation of the features and model hyperparameters, that this topic would show up and therefore be measurable. Third and finally, the advantage over supervised learning is that one does not have to undertake expensive handcoding to label enough speeches on this topic.
Figure 3 plots the average probability that a speech focuses on political authority for the years 1990–2002. Note that the reform was passed in 1993 and the new rules were used for the first time at the 1996 elections. The figure illustrates a clear discrete increase after the reform, relative to beforehand. The average probability that a speech focuses on political authority increases by about 0.03 from a prereform baseline probability of 0.13. In Section C.2 in the Online Appendix, we show that the result is statistically significant in a fixed-effect OLS regression framework. The results are also robust in a bootstrap analysis using multiple models trained on different subsets of the training data.

Figure 3 Effect of electoral reform on political authority. Notes: Vertical dashed lines indicate the year that the reform passed (1993) and went into effect (1996). The horizontal dashed line indicates the outcome mean in 1995. The bars illustrate 95% confidence intervals.
5.2 Effect of Gender on Speech Topics
A vibrant literature in comparative politics examines the policy content of parliamentary debates (Proksch and Slapin Reference Proksch and Slapin2014). For example, Bäck and Debus (Reference Bäck and Debus2019) study how speech topics vary according to the gender of the speaking parliamentarians. Using data from seven countries (Czech Republic, Estonia, Finland, Germany, Ireland, Norway, and Sweden), the authors assigned topics via manual coding of the debate segment title. They find that women parliamentarians talk less often about topics that are stereotypically associated with men.
The approach in Bäck and Debus (Reference Bäck and Debus2019) is reasonable in their context, yet exemplifies the challenges of topic classification in parliamentary speeches. Manual coding is feasible in these countries. However, the manual coding is costly, and debate segment information that allows the topics of all speeches to be inferred is not available in many databases and corpora. Coding topics at the speech level is an even more intensive effort. Lexicon-based approaches would not work, because there is not an established/validated dictionary for measuring topics across languages. Similarly, unsupervised topic models would not work in this case, because they cannot estimate consistent topics across multiple languages. Supervised learning is expensive, because one would need to create a training dataset for each parliament.
The cross-domain learning approach is well suited to this setting, as manual annotation of documents is not necessary. The manifesto corpus is available in multiple languages and would allow the assignment of a consistent set of topics across parliamentary speeches in these languages. While multilingual cross-domain learning is beyond the scope of this paper, we illustrate its feasibility by extending the analysis from Bäck and Debus (Reference Bäck and Debus2019) to New Zealand’s parliament.
Specifically, we examine differences in the content of speeches by gender. Our results suggest that men tend to devote a greater share to topics such as external relations, which is in line with Bäck and Debus (Reference Bäck and Debus2019). We also find that women devote a larger share of their speeches to talk about welfare (see Tables A17 and A18 in the Online Appendix).
6 Concluding Remarks
This paper has studied supervised learning for the cross-domain classification of political texts. This method combines the low cost of unsupervised topic models with the high interpretability and validatability of within-domain supervised classifiers. In an era of large and growing public annotated datasets, we expect that the applicability of this method will continue to expand. We have demonstrated how to use this method in the context of the manifesto corpus and parliamentary speeches from New Zealand. We used a multinomial logistic classifier to learn topics in the source corpus and predict topics in the target corpus. We showed how to validate the method using explanation methods in the target corpus, and more importantly, using human annotations of a subset of target corpus documents. To illustrate the empirical relevance of the method, we used our predicted topics to analyze the effects of New Zealand’s 1993 electoral reform and debate participation.
We make three recommendations for scholars interested in applying supervised learning for cross-domain classification tasks. First, applied researchers should carefully assess whether the categories of the source corpus capture the concepts of interest. In other words, researchers need to consider whether they can test their theoretical expectations using the categories of the source corpus. Second, researchers need to determine whether the source and target corpora are similar enough to ensure good performance. They can inspect existing evidence on cross-domain classification to assess their application, and compare the predictive features, as done in Figure 1. Third and finally, we recommend hand-coding a subset of the target corpus to assess model performance. This can be done using crowdsourcing or expert coders. We suggest using cross-domain classification when the cross-domain performance is similar to within-domain performance.
Supervised learning for cross-domain classification has the potential to increase our understanding of political phenomena. An important advantage of this method is that the ability to estimate the same topics across documents and countries. Cross-domain supervised learning allows us to study how closely a manifesto’s priorities match those in other documents, such as speeches, party press releases, coalition agreements, legislative texts, and social media data (e.g., Thomson et al. Reference Thomson2017). For example, researchers may want to investigate whether populist parties act more or less in line with their manifesto priorities than nonpopulist parties. Moreover, cross-domain classification can be used to improve the performance of existing measures of policy positions. For example, the tool could be used to distinguish ideological from nonideological topics, which might improve the performance of existing methods (e.g., Slapin and Proksch Reference Slapin and Proksch2008).
Future research may further improve the performance of cross-domain classification by using alternative models or coding schemes and by providing additional training to coders. The supervised-learning algorithms used here do not directly take into account the different data distributions in the source and target corpora. Nor did we provide any special training to coders; we used the existing manifesto coding scheme, which was not developed for cross-domain text classification. As political scientists have invested significant resources in hand-coding data, we hope that our work encourages further research on supervised learning and transfer learning in this field.
Acknowledgments
For helpful comments and suggestions, we would like to thank Kenneth Benoit, Amy Catalinac, Daniele Durante, Sara B. Hobolt, Michael Laver, Stefan Müller, Andrew Peterson, Sebastian Thieme, Matia Vannoni, Jack Vowles, and our audiences at the ASQPS conference, the MPSA conference, the Berlin Social Science Center, Bocconi University, ETH Zurich, the London School of Economics and Political Science, New York University, the University of Essex, and the New Zealand Parliament. We thank Matthew Gibbons, David Bracken, Pandanus Petter, Yael Reiss, and Tove Wikelhut for annotating speeches. Samriddhi Jain, Linda Samsinger, and Meet Vora provided excellent research assistance.
Funding
This work was supported by the European Research Council (advanced grant 694583).
Data Availability Statement
Replication code for this article has been published in Code Ocean and can be viewed interactively at https://doi.org/10.24433/CO.2554396.v1 (Osnabrügge, Ash, and Morelli Reference Osnabrügge, Ash and Morelli2021a). A preservation copy of the same code and data can also be accessed via Dataverse at https://doi.org/10.7910/DVN/CHTWUB (Osnabrügge, Ash, and Morelli Reference Osnabrügge, Ash and Morelli2021b).
Supplementary Material
For supplementary material accompanying this paper, please visit https://doi.org/10.1017/pan.2021.37.


 Open access