


The WHO has defined the double burden of malnutrition as the co-existence of undernutrition with overweight and obesity that may manifest in individuals, households and populations across the life course(1). Undernutrition includes conditions such as stunting, wasting, thinness and micronutrient deficiency(2). Worldwide, 88 % of countries are facing more than one form of malnutrition(3). In 2016, it was estimated that 75 million girls and 117 million boys aged 5 to 19 years had thinness(4). Despite decreasing global trends in prevalence of thinness from 1975 to 2016, the absolute numbers of children and adolescents with thinness increased in Asia and Africa due to population growth(4). At the same time, the number of children and adolescents with obesity worldwide increased from 5 million to 50 million in girls and from 6 million to 74 million in boys, with a rapid increase among boys in Southeast Asia(4). Both forms of malnutrition are associated with short- and long-term adverse health consequences. Thinness in childhood and adolescence is associated with an increased risk of mortality and morbidity. This could delay maturity and reduced physical work capacity and productivity(5,6) . In girls, thinness could increase the risk of adverse pregnancy outcomes and post-menopausal osteoporosis in later life(5,6) . Likewise, overweight and obesity in childhood and adolescence tend to persist into adulthood and are associated with physically and psychologically adverse health outcomes, including many chronic diseases and mental health disorders(Reference Pulgarón7,8) .
Since its independence in 1957, Malaysia, a country located in Southeast Asia, has experienced decades of a thriving economy and rapid development. From a country dominated by a rural region and depending on the agricultural sector at the time of independence, Malaysia has transformed into a highly urbanised country with dependency on the service sector economy. The rapid transformation has led to changes in the lifestyles and behaviours of Malaysians. Westernised diets, low levels of physical activity and sedentary behaviours have become the norms(Reference Goh, Azam-Ali and McCullough9). Evidence shows that Malaysia is currently in the midst of nutrition and epidemiological transitions with increasing prevalence of overweight, obesity and diet-related non-communicable diseases, with a high burden of undernutrition(Reference Goh, Azam-Ali and McCullough9–11).
A standardised and reliable reference to measure malnutrition in children and adolescents is essential to guide policy efforts to tackle malnutrition. Regarding thinness, overweight and obesity, BMI is nowadays commonly used in children and adolescents for growth monitoring, clinical management and research(Reference Must and Anderson12). In addition to local references, several international references are available, including the widely used age- and sex-specific references developed by the International Obesity Task Force (IOTF)(Reference Cole and Lobstein13), the WHO(Reference de Onis, Onyango and Borghi14) and the Centres for Disease Control and Prevention (CDC)(Reference Kuczmarski, Ogden and Guo15). Previous studies among Malaysian children and adolescents have used international references in different ways(Reference Noor16–20). For example, the CDC Growth Chart 2000 reference was applied in the National Health and Morbidity Survey (NHMS) conducted in 2011 and 2015(18,19) . The prevalence of thinness among children and adolescents aged under 18 years decreased from 12 % to 8 %, while the prevalence of obesity doubled from 6 % to 12 % between the survey’s intervals. In the most recent NHMS survey in 2019, the WHO 2007 reference was used(20). Using that reference, the prevalence of thinness was 10 %, while the prevalence of obesity was 15 % among children and adolescents aged 5 to 17 years(20).
Several factors such as age, sex, ethnicity, urbanisation level of the place of residence, and socio-economic factors including household income and household size have been associated with the double burden of thinness and overweight and obesity in previous studies among Malaysian children and adolescents(21–Reference Ahmad, Zulaily and Shahril27). For example, male sex(21,22) , Indian ethnic origin(Reference Baharudin, Zainuddin and Selamat24) and urban residence(Reference Baharudin, Zainuddin and Selamat24) have been associated with higher prevalence of both thinness and obesity, while overweight was found to be as common in all major ethnic groups in the few national studies(21,22) . Higher household income has been associated with lower prevalence of thinness(Reference Baharudin, Zainuddin and Selamat24) and with higher prevalence of overweight(Reference Naidu, Mahmud and Ambak26) or obesity(Reference Baharudin, Zainuddin and Selamat24).
The double burden of malnutrition imposes a challenge in terms of the healthcare and wellbeing of the population. In addition to the high burden of undernutrition, it is predicted that 1·8 million Malaysians aged 5 to 19 years would be living with obesity in 2030(28). To our knowledge, there were no previous studies using nationally representative data looking at secular trends and sociodemographic determinants of both thinness and overweight and obesity among Malaysian children and adolescents. In addition, the use of different BMI references in the previous studies complicates comparisons across studies locally and internationally. Therefore, in order to develop effective strategies targeting the most afflicted parts of the population, the present study aims to provide vital information about time trends and potential sociodemographic differences in the prevalence of thinness and overweight (obesity included) at the population level in 6- to 17-year-old children and adolescents in Malaysia. For comparability at the local and international level, the present study applied the IOTF and the WHO BMI criteria as references for child and adolescent BMI status.
Methods
Study design and population
We used three repeated cross-sectional data from the NHMS conducted in 2006, 2011 and 2015 in Malaysia. The NHMS is a nationwide population-based survey conducted once every decade since 1986, and at 4-year intervals since 2011. The main aim of the NHMS is to monitor the prevalence and distribution of common diseases, health needs and health expenditures. The survey was designed to represent all non-institutionalised individuals residing in Malaysia for at least 4 (NHMS 2006) or 2 (NHMS 2011 and NHMS 2015) weeks before data collection(18,19,29) . A similar sampling design and methodology was used in each NHMS. The survey was designed as a two-stage stratified cluster sampling proportionate to the population size. Malaysia was first stratified into states that were further stratified into rural and urban areas (<10 000 v. ≥10 000 inhabitants), based on geostatistical census areas defined by the Department of Statistics Malaysia (DOSM)(30). The first stage of the sampling involved the random selection of enumeration blocks from the clusters of rural and urban areas separately. In the second stage, living quarters (buildings where people live) were randomly sampled from each selected enumeration block. All households and their members within the selected living quarters were included in the study. A larger sample was selected in 2006 to represent data at the national and state level, while the surveys in 2011 and 2015 were designed to provide data at the national level only. The response rates in living quarters for NHMS 2006, 2011 and 2015 were 90·0 %, 88·2 % and 89·2 %, and the individual participation rates were 94·6 %, 93·0 % and 86·4 %, respectively. In this study, data from 6- to 17-year-old children and adolescents were used.
Procedures and measures
The NHMS consists of face-to-face interviews, self-administrated questionnaires and clinical measurements including height and weight. All questionnaires were structured, pre-tested and available as bilingual (English and Malay). A questionnaire manual was prepared to guide the data collection, done by trained research assistants. Information about children younger than 13 years of age was collected from their parents or guardians (by proxy), and information concerning individuals older than 13 years directly from them. The variables of this study were measured as described below.
Anthropometry
Body weight was measured on an electronic digital weighing scale (Tanita Personal Scale) according to a standard procedure for children and adolescents(5). Everyone was weighed twice, barefoot, with minimum clothing; weight was recorded to the nearest 0·1 kg. A standard weight was supplied for each team for standardisation of the weighing scales. Height was measured twice based on the SECA Body Meter to the nearest 0·1 cm. The tools were validated and calibrated before use. The average of the two weight and height measurements, respectively, were used to calculate BMI (weight in kilograms divided by the square of height in metres, kg/m2). Two age- and sex-specific BMI criteria were used to define thinness, overweight and obesity: (1) the IOTF 2012 reference is appropriate for children and adolescents aged 2–18 years and provides BMI cut-offs that correspond to adult cut-offs of 18·5, 25·0 and 30·0 kg/m2 at the age of 18 years(Reference Cole and Lobstein13). We used a published SPSS code for the calculations(31). (2) In the WHO 2007 criteria, thinness is defined as a BMI-for-age Z-score lower than −2 sd, overweight is defined as a BMI-for-age Z-score greater than +1 sd, and obesity is defined as a BMI-for-age Z-score greater than +2 sd, from the mean of the WHO reference population(Reference de Onis, Onyango and Borghi14). We used the WHO Reference 2007 SPSS macro package to calculate the BMI Z-scores(32). We excluded BMI Z-scores greater than +5 sd or less than −5 sd. Age at the time of the interview, recorded in full years, was used when applying the IOTF and the WHO BMI criteria.
Sociodemography
Age at the time of the interview, recorded in full years, was used in the analysis. Ages from 6 to 9 years were classified as pre-adolescence, 10 to 13 years as early adolescence and 14 to 17 years as mid-adolescence, based on adolescent growth and development(Reference Strasburger, Brown, Braverman, Sydor, Bierig and Walz33). Residential area was categorised into urban or rural according to the DOSM definition(30). Ethnicity was based on major ethnicities in Malaysia: Malay, Chinese, Indian, Other Bumiputeras (which comprises indigenous people living in Peninsular and East Malaysia) and Other (including Malaysian minorities such as Sikh, Baba, Chitty, Eurasian and non-citizens residing in Malaysia). Household size was classified based on the number of individuals living in the household into small (maximum three), medium (between four and six) and large (seven or more) households. Household income was based on the self-reported income of all individuals living in the household per month. For the analyses, household income was divided into quintiles (Q1 to Q5; Q1 representing the lowest and Q5 the highest income), separately for each survey year.
Statistical analysis
The crude prevalence estimates of thinness, overweight and obesity were calculated for each survey year, according to the IOTF and WHO BMI criteria. Complex sample analyses were conducted to account for the complex survey design. As BMI varies substantially by sex and age during childhood and adolescence, all analyses were stratified by sex and the three age groups. Individuals with missing BMI values (3·7 %, 6·2 % and 5·2 % in 2006, 2011 and 2015, respectively) were excluded from all analyses. In addition, study subjects in the ethnicity category of Other were excluded from the analyses involving sociodemographic factors, due to the small number of participants in that category (approximately 3 % of the total sample each survey year). The statistical significance of the time trends in the prevalence of thinness, overweight and obesity across the study period was assessed by log-binomial regression, with year as a continuous variable and adjusted for age. The results from these analyses are presented as prevalence ratios (PR) (with 95 % CI) that describe the relative change in the prevalence of thinness, overweight and obesity, respectively, per year. Then, the prevalence of thinness and overweight was calculated for each survey year (using the IOTF criteria) separately in each subgroup of ethnicity, residential area, household size and household income. We only used the IOTF criteria here, to avoid small numbers in some subgroups when defining thinness according to the WHO criteria. The statistical significance of the time trends in the prevalence of thinness and overweight within each sociodemographic subgroup was assessed by log-binomial regression, with year as a continuous variable, and adjusted for age. The results are presented as PR (with P-value) that describe the relative change in the prevalence of thinness and overweight per year in each sociodemographic subgroup. Finally, associations of individual sociodemographic factors (age group, ethnicity, residential area, household size and household income) with the prevalence of thinness (v. normal weight) and overweight (v. normal weight) in 2015 were studied. The statistical significance of these associations was assessed by log-Poisson regression, adjusted for age. The results of these analyses are presented as PR (with 95 % CI) that describe the ratio of the prevalence of thinness and overweight, respectively, in each sociodemographic subgroup in comparison to the respective reference group (in 2015). We used log (µ) as the link function in modelling the binary outcomes in log-binomial and log-Poisson regressions. All statistical tests were attained by using a two-tailed test, and an α level <0·05 was used for statistical significance. Analyses were performed using Stata SE 14 and IBM SPSS 25.0.
Results
Study population
Data were available on 28 094 individuals aged 6 to 17 years, with the biggest sample (n 14 838) in 2006 and the smallest sample (n 6262) in 2015 (Table 1). The proportion of individuals with Malay ethnicity increased, and the proportion of large households decreased somewhat during the study period. However, the distributions of sociodemographic characteristics were relatively similar in the three surveys, as follows: Malay ethnicity made up two-thirds of the sample, slightly over 50 % of the individuals lived in urban areas and about 60 % came from medium-sized households.
Table 1 Sociodemographic characteristics of participating individuals aged 6 to 17 years in the National Health and Morbidity Survey (NHMS) 2006, 2011 and 2015, Malaysia

* Missing values are expressed separately from the valid percentage distribution.
† Other Bumiputeras comprised of indigenous individuals living in Peninsular and East Malaysia.
‡ Other ethnicities comprised of other minorities such as Sikh, Baba, Chitty, Eurasian and non-citizens.
§ Urban: areas with population sizes ≥10 000; rural: areas with population sizes <10 000.
‖ Household size was classified based on the number of individuals living in the household as small (maximum three), medium (between four and six) and large (seven or more).
¶ Household income is the total average earnings of all individuals living in the household per month and was classified into Quintiles. Quintile 1 = the lowest income quintile; Quintile 5 = the highest income quintile.
NHMS 2006: Q1 (≤ RM 550·00), Q2 (RM 550·01–RM 1000·00), Q3 (RM 1000·01–RM 1500·00), Q4 (RM 1500·01–RM 2510·00), Q5 (≥ RM 2510·01); 1 USD = RM 3.78 in January 2006.
NHMS 2011: Q1 (≤ RM 900·00), Q2 (RM 901·00–RM 1750·00), Q3 (RM 1751·00–RM 3000·00), Q4 (RM 3001·00–RM 4840·00), Q5 ((≥ 4841·00); 1 USD = RM 3·06 in January 2011.
NHMS 2015: Q1 (≤ RM 1300·00), Q2 (RM 1301·00–RM 2300·00), Q3 (RM 2301·00–RM 3500·00), Q4 (RM 3501·00–RM 5900·00), Q5 (≥ RM 5901·00); 1 USD = RM 3·52 in January 2015.
Thinness
The prevalence of thinness fell significantly from 22·7 % (95 % CI 21·8, 23·5) in 2006 to 18·7 % (95 % CI 17·3, 20·1) in 2015 among all individuals, from 22·1 % (95 % CI 21·0, 23·1) to 18·2 % (95 % CI 16·2, 20·3) in boys, and from 23·3 % (95 % CI 22·2, 24·2) to 19·1 % (95 % CI 17·4, 21·0) in girls according to the IOTF criteria. Figure 1 shows the distribution of nutritional status, including the prevalence of thinness, across the study period according to sex and age. The decrease in the prevalence of thinness (IOTF criteria) over time was significant in all sex-age groups except for pre-adolescent boys (Fig. 2, Panel A and Panel B). According to the WHO criteria, the prevalence of thinness decreased from 8·3 % (95 % CI 7·8, 8·8) to 6·7 % (95 % CI 5·8, 7·7) among all individuals, from 8·7 % (95 % CI 8·0, 9·4) to 7·4 % (95 % CI 6·0, 9·1) in boys and from 7·8 % (95 % CI 7·1, 8·5) to 5·9 % (95 % CI 5·0, 7·1) in girls. Overall, there were no significant differences in the secular changes in thinness between boys and girls, whether defined by the IOTF or the WHO criteria.

Fig. 1 Distribution of nutritional status based on BMI and defined by the IOTF(Reference Cole and Lobstein13) and WHO(Reference de Onis, Onyango and Borghi14) criteria according to sex and age (pre-adolescent, 6–9 years; early adolescent, 10–13 years; and mid-adolescent 14–17 years) in the National Health and Morbidity Survey (NHMS) 2006, 2011 and 2015, Malaysia. Thin, thinness; OW, overweight; OB, obesity; IOTF, International Obesity Task Force. ![]() , Thin;
, Thin; ![]() , normal;
, normal; ![]() , OW;
, OW; ![]() , OB
, OB

Fig. 2 Panel (A–F). Prevalence ratio (describes the relative change per year across the study period 2006–2015) of thinness, overweight (including obesity) and obesity based on the IOTF(Reference Cole and Lobstein13) and WHO(Reference de Onis, Onyango and Borghi14) classifications of sex and age (pre-adolescent, 6–9 years; early adolescent, 10–13 years; and mid-adolescent 14–17 years). National Health and Morbidity Survey (NHMS), Malaysia. IOTF, International Obesity Task Force
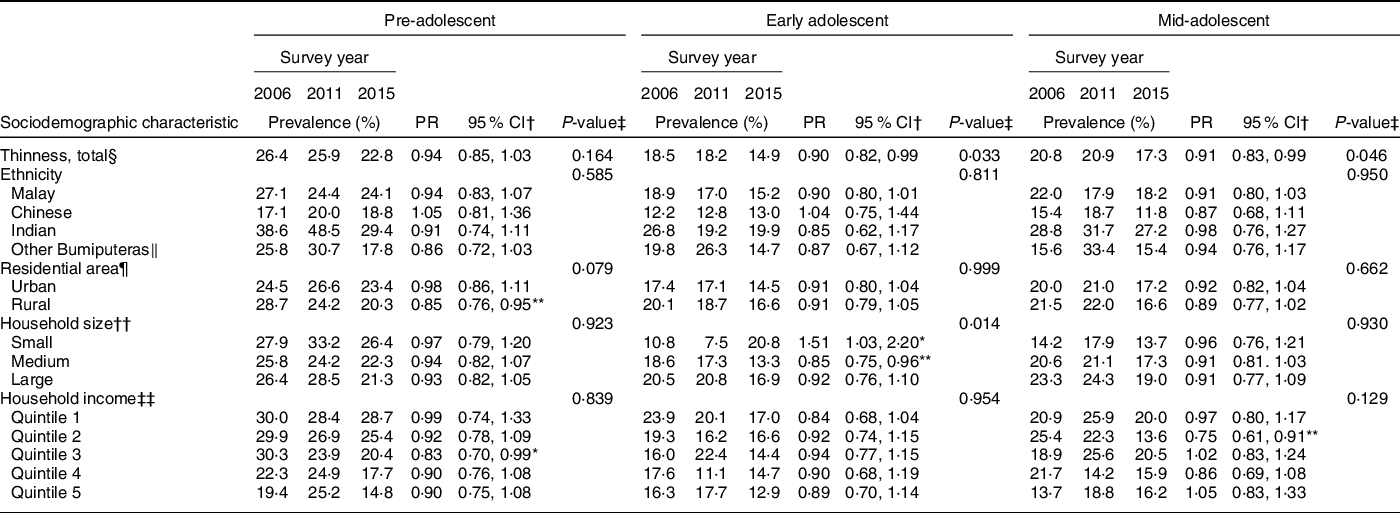
Prevalence of thinness varied in the sociodemographic subgroups from 2006 to 2015 as shown in Tables 2 and 3. The PR (describing the relative change in the prevalence of thinness per year, adjusted for age, in subgroups of ethnicity, residential area, household size and household income) were mostly below 1, indicating a decrease in the prevalence of thinness from 2006 to 2015 in those subgroups; however, relatively few of the PR were statistically significant. The only statistically significant interaction between survey year and a sociodemographic variable was observed for household size in early adolescent boys (P = 0·014). While the prevalence of thinness decreased over time among boys living in medium-sized and large households, it increased among boys living in small households.
Table 2 Prevalence of thinness (IOTF criteria) in boys according to individual sociodemographic characteristics separated by age groups, survey year (2006, 2011 and 2015), as well as prevalence ratio (PR) (describes the relative change in the prevalence of thinness per year in each subgroup). National Health and Morbidity Survey (NHMS), Malaysia
IOTF, International Obesity Task Force.
Age groups: pre-adolescent 6–9 years, early adolescent 10–13 years and mid-adolescent 14–17 years.
Significance test for each sociodemographic subgroup:
* Significance at <5 % level.
† 95 % CI for the PR.
‡ Interaction test between sociodemographic variable and survey year.
§ Thinness was classified according to the IOTF classification(Reference Cole and Lobstein13).
‖ Other Bumiputeras comprised of indigenous individuals living in Peninsular and East Malaysia.
¶ Urban: areas with population sizes ≥10 000; rural: areas with population sizes <10 000.
** Significance at <1 % level.
†† Household size was classified based on the number of individuals living in the household into small (maximum three), medium (between four and six) and large (seven or more).
‡‡ Household income is the total average earnings of all individuals living in the household per month and was classified into Quintile. Quintile 1 = the lowest income quintile; Quintile 5 = the highest income quintile.
Table 3 Prevalence of thinness (IOTF criteria) in girls according to individual sociodemographic characteristics separated by age groups, survey year (2006, 2011 and 2015), as well as prevalence ratio (PR) (describes the relative change in the prevalence of thinness per year in each subgroup). National Health and Morbidity Survey (NHMS), Malaysia

IOTF, International Obesity Task Force.
Age groups: pre-adolescent 6–9 years, early adolescent 10–13 years and mid-adolescent 14–17 years.
Significance test for each sociodemographic subgroup:
* Significance at <5 % level.
† 95 % CI for the PR.
‡ Interaction test between sociodemographic variable and survey year.
§ Thinness was classified according to the IOTF classification(Reference Cole and Lobstein13).
‖ Other Bumiputeras comprised of indigenous individuals living in Peninsular and East Malaysia.
¶ Urban: areas with population sizes ≥10 000; rural: areas with population sizes <10 000.
** Significance at <1 % level.
†† Household size was classified based on the number of individuals living in the household into small (maximum three), medium (between four and six) and large (seven or more).
‡‡ Household income is the total average earnings of all individuals living in the household per month and was classified into Quintile. Quintile 1 = the lowest income quintile; Quintile 5 = the highest income quintile.
In 2015, thinness was more common in pre-adolescence than in mid-adolescence (see online Supplemental Tables 1 and 2). In addition, a statistically significant association was observed between ethnicity and thinness among pre-adolescent girls; those with Indian ethnic origin had a higher prevalence of thinness, and those with Chinese origin had a lower prevalence of thinness, as compared to Malay (the strata-specific P-values with borderline significance).
Overweight and Obesity
The prevalence of overweight (including obesity) increased significantly from 19·6 % (95 % CI 18·8, 20·4) in 2006 to 25·2 % (95 % CI 23·6, 27·0) in 2015 among all individuals, from 20·2 % (95 % CI 19·2, 21·3) to 26·0 % (95 % CI 23·8, 28·5) in boys and from 18·9 % (95 % CI 17·9, 19·9) to 24·4 % (95 % CI 22·4, 26·5) in girls according to the IOTF criteria. Respectively, the prevalence of obesity increased from 7·2 % (95 % CI 6·7, 7·7) to 10·1 % (95 % CI 9·1, 11·2) among all individuals, from 7·3 % (95 % CI 6·7, 8·0) to 10·6 % (95 % CI 9·2, 12·2) in boys and from 7·0 % (95 % CI 6·4, 7·7) to 9·5 % (95 % CI 8·3, 10·9) in girls. Figure 1 shows the distribution of nutritional status, including the prevalence of overweight and obesity across the study period according to sex and age. The increases in the prevalence of overweight and obesity over time were statistically significant in all sex-age groups, except for mid-adolescent boys and, regarding obesity, in early adolescent girls (Fig. 2, Panels C to F). Based on the WHO criteria, the prevalence of overweight (including obesity) increased from 23·4 % (95 % CI 22·5, 24·2) in 2006 to 29·2 % (95 % CI 27·5, 30·9) in 2015 in all individuals, and, respectively, from 24·9 % (95 % CI 23·8, 26·1) to 31·0 % (95 % CI 28·7, 33·3) in boys and from 21·7 % (95 % CI 20·7, 22·8) to 27·4 % (95 % CI 25·3, 29·4) in girls. Regarding obesity, the respective increases were from 10·4 % (95 % CI 9·8, 11·0) to 14·2 % (95 % CI 12·9, 15·5) in all individuals, from 11·9 % (95 % CI 11·1, 12·8) to 16·1 % (95 % CI 14·4, 18·1) in boys and from 8·8 % (95 % CI 8·1, 9·6) to 12·1 % (95 % CI 10·6, 13·7) in girls. Overall, there was no significant difference in the secular changes in overweight and obesity between boys and girls, whether defined by the IOTF or WHO criteria.
Tables 4 and 5 show the prevalence of overweight (including obesity) in different sociodemographic subgroups from 2006 to 2015. The trends in the prevalence of overweight over time were mainly increasing (PR > 1), and statistically significant in several subgroups, particularly in pre-adolescent boys and early adolescent girls. Statistically significant interactions between survey year and a sociodemographic variable were observed in three analyses, as follows: (1) among mid-adolescent boys, overweight became more common in rural but not urban areas (interaction term P = 0·014); (2) among mid-adolescent girls, overweight became more common among Other Bumiputeras and Chinese, while changes in the other groups were smaller and insignificant (P = 0·020); and (3) among early adolescent girls, overweight became more common in the highest and lowest quintiles of household income (P = 0·009), while changes in the other groups were smaller and insignificant.
Table 4 Prevalence of overweight (including obesity; IOTF criteria) in boys according to individual sociodemographic characteristics separated by age group, survey year (2006, 2011 and 2015), as well as prevalence ratio (PR) (describes the relative change in the prevalence of overweight individuals per year in each subgroup). National Health and Morbidity Survey (NHMS), Malaysia

IOTF, International Obesity Task Force.
Age groups: pre-adolescent 6–9 years, early adolescent 10–13 years and mid-adolescent 14–17 years.
Significance test for each sociodemographic subgroup:
* Significance at <5 % level.
† 95 % CI for the PR.
‡ Interaction test between sociodemographic variable and survey year.
§ Overweight (including obesity) was classified according to the IOTF classification(Reference Cole and Lobstein13).
‖ Other Bumiputeras comprised of indigenous individuals living in Peninsular and East Malaysia.
¶ Urban: areas with population sizes ≥10 000; rural: areas with population sizes <10 000.
** Significance at <1 % level.
†† Household size was classified based on the number of individuals living in the household into small (maximum three), medium (between four and six) and large (seven or more).
‡‡ Household income is the total average earnings of all individuals living in the household per month and was classified into Quintile. Quintile 1 = the lowest income quintile; Quintile 5 = the highest income quintile.
*** Significance at <0·1 % level.
Table 5 Prevalence of overweight (including obesity; IOTF criteria) in girls according to individual sociodemographic characteristics, separated by age group, survey year (2006, 2011 and 2015), as well as prevalence ratio (PR) (describes the relative change in the prevalence of overweight per year in each subgroup). National Health and Morbidity Survey (NHMS), Malaysia

IOTF, International Obesity Task Force.
Age groups: pre-adolescent 6–9 years, early adolescent 10–13 years and mid-adolescent 14–17 years.
Significance test for each sociodemographic subgroup:
* Significance at <5 % level.
† 95 % CI for the PR.
‡ Interaction test between sociodemographic variable and survey year.
§ Overweight (including obesity) was classified according to the IOTF classification(Reference Cole and Lobstein13).
‖ Other Bumiputeras comprised of indigenous individuals living in Peninsular and East Malaysia.
¶ Urban: areas with population sizes ≥10 000; rural: areas with population sizes <10 000.
** Significance at <1 % level.
†† Household size was classified based on the number of individuals living in the household into small (maximum three), medium (between four and six) and large (seven or more).
‡‡ Household income is the total average earnings of all individuals living in the household per month and was classified into Quintile. Quintile 1 = the lowest income quintile; Quintile 5 = the highest income quintile.
*** Significance at <0·1 % level.
In 2015, the following associations between the sociodemographic factors and overweight (including obesity) were statistically significant (see online Supplemental Tables 3 and 4). Early adolescent boys of Chinese ethnicity had a higher prevalence of overweight than Malay. Pre-adolescent boys from small households had a higher prevalence of overweight, and early adolescent girls from large households had a lower prevalence of overweight, as compared to medium-sized household residents.
Translating the prevalence estimates to absolute numbers, there were 1·1 million children and adolescents with thinness, 1·5 million children and adolescents with overweight (including obesity), and almost 600 000 children and adolescents with obesity in Malaysia in 2015, based on the IOTF classification. Using the WHO classification, the respective population estimates were 390 000, 1·7 million and 820 000.
Discussion
Summary of findings
This is the first study describing secular trends and sociodemographic determinants of two forms of malnutrition (thinness and overweight/obesity) simultaneously, among children and adolescents in Malaysia. As evidenced by this study, Malaysia is facing a double burden of malnutrition with increasing trends of overweight and obesity and a gradual decline in thinness prevalence from 2006 to 2015. Apart from a few exceptions, these secular changes were, in general, similar in the different sociodemographic subgroups (sex, age, ethnicity, place of residence, household size and household income), and thinness and overweight co-existed in all the sociodemographic subgroups. The present study also highlights that different BMI criteria result in very different estimates of absolute numbers of thinness, but also of overweight and obesity, in Malaysian children and adolescents.
Comparison to previous studies
Four national school-based studies were conducted in Malaysia between 2008 and 2017, in which the nutritional status of children and adolescents was assessed using the WHO BMI classification(21–Reference Zainuddin, Selamat and Baharudin23,Reference Poh, Ng and Siti Haslinda34) . The overall prevalence of thinness, overweight and obesity in these previous studies were comparable to our results based on the WHO BMI criteria. Comparing to the prevalence estimates of thinness and excess weight by the NCD Risk Factor Collaboration among 5- to 19-year-olds in 2015(4), thinness seems to be much more common, and overweight and obesity much less common, in some of the neighbouring countries than in Malaysia. On the other hand, 13- to 16-year-old adolescents in Brunei had a higher prevalence of overweight and obesity as compared to adolescents in Malaysia(Reference Pengpid and Peltzer35). Secular trends of thinness and excess weight similar to those in our study have been observed in other developing countries in Southeast Asia(4,Reference Novianti Rachmi, Li and Baur36–Reference Kien, Lee and Nam38) and China(Reference Song, Agardh and Ma39,Reference Zhai, Dong and Bai40) , and among children and adolescents from South Asian(Reference Mistry and Puthussery41) and African countries(Reference Muthuri, Francis and Wachira42).
Regarding the sociodemographic factors, the secular changes in the prevalence of thinness and overweight between 2006 and 2015 were, in general, similar in the different sociodemographic subgroups (sex, age, ethnicity, place of residence, household size and household income). Looking at the most recent study year (2015), we observed a significantly higher prevalence of thinness in pre-adolescence (6–9 years) than in mid-adolescence (14–17 years). Because of rapid growth in children between the age of 5 years and pubertal age(Reference Rogol, Clark and Roemmich43), any imbalance in nutrient intake and energy expenditure during this period will increase the likelihood of thinness among the younger children. The distribution of thinness according to the different ethnic groups in our study is similar to that in previous national studies(21–Reference Zainuddin, Selamat and Baharudin23). Regarding overweight, previous national studies reported roughly similar findings across the major ethnic groups, which is in line with our findings(21,22) . Differences in genetic factors, cultural traditions and religious beliefs, as well as in socio-economics, may influence dietary patterns, lifestyle habits and weight perceptions – and, thereby, the weight status of ethnic groups(Reference Kasmini, Idris and Fatimah44,Reference Rezali, Chin and Shariff45) . Finally, we observed some differences in the prevalence of thinness and overweight according to household size, varying by sex and age. Previously, larger household size has been associated with a higher prevalence of thinness and a lower prevalence of excess weight among children from an urban area in Malaysia(Reference Ahmad, Zulaily and Shahril27). However, we are not aware of any national-level studies to compare our results. This signifies the need for further research.
Strengths and limitations
A strength of our study is that we were able to use three large, nationally representative population-based data with comparable study designs and high response rates, and complex sample analysis to account for the disproportionate sampling of the population. Further, trained staff measured height and weight using standardised and calibrated equipment. Using BMI as a measure of adiposity can be seen as a limitation(Reference Doak, Hoffman and Norris46), although BMI is generally accepted as a screening measure of weight status in population studies(47). The BMI cut-offs used for overweight and obesity(Reference Cole and Lobstein13,Reference de Onis, Onyango and Borghi14) may have been too high in the sense that Asian populations have been observed to have higher health risks at lower BMI values(Reference Hills, Mokhtar and Brownie48). Information on age, ethnicity and household income was self-reported, which may cause some error, though we have no specific reason to suspect that such error would be systematic. We did not adjust household income for household size, and we did not include information on dietary intake, physical activity or parental factors that could confound or explain associations between sociodemographic factors and weight status or explain the observed secular trends. Finally, although the sample sizes of the three NHMS surveys were large, some of the stratified analyses may have had insufficient statistical power. On the other hand, we made multiple comparisons within strata of sociodemographic variables, which increases the probability of receiving a statistically significant P-value in at least one stratum, even if the null hypothesis about an association would be true(Reference Sjölander and Vansteelandt49). Because our study was descriptive and we used a frequentist analytical approach, we followed the suggestion by Sjölander and Vansteelandt and did not formally adjust the statistical analyses for multiple testing(Reference Sjölander and Vansteelandt49).
Public health implications
In the present study, the WHO population estimate for thinness was about 60 % lower, and that the estimate for obesity was about 40 % higher, than the respective estimates based on the IOTF classification. The discrepancies between the estimates based on the two BMI criteria are well known by researchers in the field(Reference Partap, Young and Allotey50). However, as prevalence figures inform public health policy decision-making, the importance of being clear about which criteria are used in each case cannot be over-emphasised.
Regardless of which BMI criteria are used, the double burden of malnutrition in terms of thinness and overweight and obesity exists among Malaysian children and adolescents. Considering the serious health consequences associated with undernutrition and overweight and obesity in children and adolescents, effective strategies incorporating double-duty actions to prevent co-existence of undernutrition with overweight and obesity are crucial. Based on our results, we recommend close monitoring of children’s nutritional status and that public health interventions target families with children, from an early age.
Conclusion
The present findings provide evidence that Malaysia is facing a double burden of malnutrition at national level among 6- to 17-year-old adolescents, with increasing trends of overweight and obesity and a persistent despite gradually decreasing trend of thinness across one decade, and affecting adolescents of different ethnic origins, from rural and urban areas, and from households of varying sizes and income levels. Further understanding is needed about sociodemographic, lifestyle-related and environmental determinants of thinness and overweight among Malaysian children and adolescents and their families. Research is also warranted to investigate whether a double burden exists at other than the country level, such as the household level and the individual level.
Acknowledgements
Acknowledgements: The authors would like to thank the Director General of Health Malaysia for the permission to use the datasets and publish this article. Financial support: This research received no specific grant from any funding agency in the public, commercial or not-for-profit sectors. Conflict of interest: There are no conflicts of interest. Authorship: M.S.M., B.M.N., R.K., S.M.V. and S.L.-J. formulated the research questions and designed the study. M.S.M., B.M.N. and S.L.-J. conducted the study and performed statistical analysis. M.S.M. and S.L.-J. wrote paper. R.K. and S.M.V. contributed (to the writing) with critical comments. All authors read and approved the final manuscript. Ethics of human subject participation: This study was conducted according to the guidelines laid down in the Declaration of Helsinki and all procedures involving research study participants were approved by the Medical Research Ethics Committee under the Ministry of Health Malaysia. Written informed consent was obtained from all participants.
Supplementary material
For supplementary material accompanying this paper visit https://doi.org/10.1017/S1368980021003190


