


Undernutrition continues to be an important public health problem in India, despite several nutrition intervention programmes in operation over the last four decades. Undernutrition is responsible directly or indirectly for about 45 % of deaths among children under 5 years of age (under-5s) globally, with these children at higher risk of death from common childhood illness such as diarrhoea, pneumonia and malaria( Reference Black, Victora and Walker 1 ). Of this, about two-thirds are attributable to suboptimal infant and young child feeding (IYCF) practices and occur during first year of life( Reference Black, Allen and Bhutta 2 ). In developing countries, optimal breast-feeding – that is, breast-feeding within an hour of birth, exclusive breast-feeding for 6 months and continued breast-feeding until age 2 years or longer – has the potential to prevent 12 % of all deaths in under-5s( Reference Black, Victora and Walker 1 ).
Poor feeding practices during infancy and early childhood, resulting in malnutrition, contribute to impairment of cognitive and social development, poor school performance and reduced productivity in later life( Reference Victora, Adair and Fall 3 ).
Exclusively breast-fed children are less susceptible to diarrhoea and pneumonia and are fourteen times more likely to survive than non-breast-fed children( Reference Arifeen, Black and Antelman 4 ). IYCF is a key area to improve child survival and promote healthy growth and development. The first 2 years of a child’s life are particularly important, as optimal nutrition during this period lowers morbidity and mortality, reduces the risk of chronic disease and fosters better development overall.
Many studies have shown beneficial effects of breast-feeding on infant mortality, respiratory infections, diarrhoea( Reference Arifeen, Black and Antelman 4 ) and neonatal sepsis( Reference Bahl, Frost and Kirkwood 5 – Reference Edmond, Zandoh and Quigley 9 ) and thus on nutritional status. Suboptimum breast-feeding was estimated to be responsible for 1·4 million child deaths and 44 million disability-adjusted life years (10 % of disability-adjusted life years in under-5s) for the year 2004( Reference Black, Allen and Bhutta 2 ). WHO has recommended breast-feeding to be initiated early after birth, preferably within an hour, avoidance of prelacteal feeds and exclusive breast-feeding up to first 6 months.
UNICEF has set seventeen developmental goals under the Sustainable Development Goals 2015( 10 ), officially known as Transforming Our World: The 2030 Agenda for Sustainable Development, which include poverty alleviation, ending hunger, achieving food security and improved nutrition, and promoting sustainable agriculture. Improving nutrition includes: ending all forms of malnutrition, such as reducing stunting and wasting in under-5s by 2025 as agreed internationally; addressing the nutritional needs of adolescent girls, pregnant and lactating women and older persons; and reducing the global maternal mortality rate to less than 70/100 000 live births, the neonatal mortality rate to as low as 12/1000 live births and the under-5 mortality rate to 25/1000 live births( 10 ).
These targets can only be achieved by improving maternal and adolescent nutrition, proper health-care services, control of childhood diseases and reducing undernutrition among under-5s.
The present study was carried out by the National Nutrition Monitoring Bureau (NNMB) on ‘diet and nutritional status of the rural population in India’ during 2011–2012. Data pertaining to IYCF feeding practices and their influence on nutritional status are presented in the current paper.
Methods
Study design and setting
A community-based, cross-sectional study was carried out in ten states in India (Kerala, Tamil Nadu, Karnataka, Andhra Pradesh, Maharashtra, Gujarat, Madhya Pradesh, Orissa, West Bengal and Uttar Pradesh) adopting a multistage random sampling procedure. A total of 120 villages were covered in each NNMB state.
Selection of villages and households
From each state, the villages were selected based on probability proportional to size of the population. Ninety villages were selected from those covered in previous surveys and the remaining thirty villages were randomly selected afresh from the list of villages obtained from the Census of India( 11 ). From each selected village, twenty households (HH) were covered after dividing the village into five geographical areas based on streets/mohallas/areas. It was ensured that at least one of the five areas was inhabited by scheduled caste (SC)/scheduled tribe (ST) communities, which are officially designated groups of historically disadvantaged people as per the Constitution of India, and the groups in the other areas were designated in one or other of the population categories wherever possible to give equal representation to all communities. From each area, four contiguous HH were covered by randomly selecting the first HH. Thus, a total of twenty HH were covered in each village and 2400 HH in each state. All children <3 years of age present at the time of the survey were included in the study.
Data collection
Data were collected by a team comprising a medical officer, a nutritionist and a social worker in each state, who were trained and standardized in survey methodologies by scientists from the National Institute of Nutrition, Hyderabad. All survey schedules were pre-tested before being used in the field. Information on household socio-economic and sociodemographic characteristics, such as community, religion, education, occupation and income, were collected using a pre-tested proforma. IYCF practices such as initiation of breast-feeding, age at initiating complementary feeding, colostrum feeding, etc. were also collected from mothers of children aged <2 years. Anthropometric measurements of the children were collected. Length/height (up to nearest 1 mm) was measured with an infantometer/anthropometer rod and weight (up to nearest 100 g) with a SECA weighing scale (SECA Deutschland, Hamburg, Germany) using standard anthropometric procedures( Reference Jelliffe and Jelliffe 12 ). History of morbidity such as fever, respiratory infection, diarrhoea, etc., if any, during the 15d preceding the visit was also collected.
Definitions
‘Household’ is defined as those living together under one roof and sharing a common kitchen.
‘Pucca house’ means walls made of cement and bricks or stones with a reinforced cement concrete roof; a ‘semi-pucca house’ is one that has brick or stone walls and a tiled or asbestos roof; while a ‘kutcha house’ has mud or thatched walls and a thatched or tiled/asbestos roof.
‘Minimum dietary diversity’ is the number of different foods or food groups consumed over a given reference period and is said to be met by the consumption of four or more food groups in a diet.
‘Prelacteal feeds’ are those foods given to a newborn before breast-feeding is established or before breast milk ‘comes in’, usually on the first day of life, and include honey, jaggery (brown sugar from sugarcane), ghee (clarified butter) and ghutti (herbal paste).
‘Exclusive breast-feeding’ means giving only breast milk, not even water, up to 6 months.
Ethical approval
The study was approved by the Institutional Ethical Committee of the National Institute of Nutrition as well as the Scientific Advisory Committee. Written informed consent was obtained from the mothers involved in the study.
Data analysis
The data were scrutinized and entered on computer at the National Institute of Nutrition, Hyderabad. Data cleaning was done by carrying out range and consistency checks, then data analysis was conducted using the statistical software package SPSS Statistics for Windows version 17.0. Tests of proportions (χ 2 test) and bivariate analyses (logistic regression) were carried out, and multivariate logistic regression analyses were done according to the conceptual hierarchical framework developed by Victora et al. ( Reference Victora, Huttly and Fuchs 13 ). Figure 1 shows the factors controlled for in hierarchical order for underweight, stunting and wasting, which was the basis for adjusted logistic regression analyses. Age and gender were considered inherent factors and were controlled for in all models and at each stage irrespective of significance level. The distal factors (such as community, per capita income (tertile), type of house and landholding) constituted the first stage. Age and gender remained in the model together with significant distal factors, while intermediate factors (such as age and parity of mother, education of mother, place of delivery, birth weight, sanitary latrine and hand-washing practices of mother) were added, which constituted the second stage. The proximal variables (including breast-feeding practices, age at initiation of complementary feeding and morbidities during the preceding fortnight) were added in the third stage.
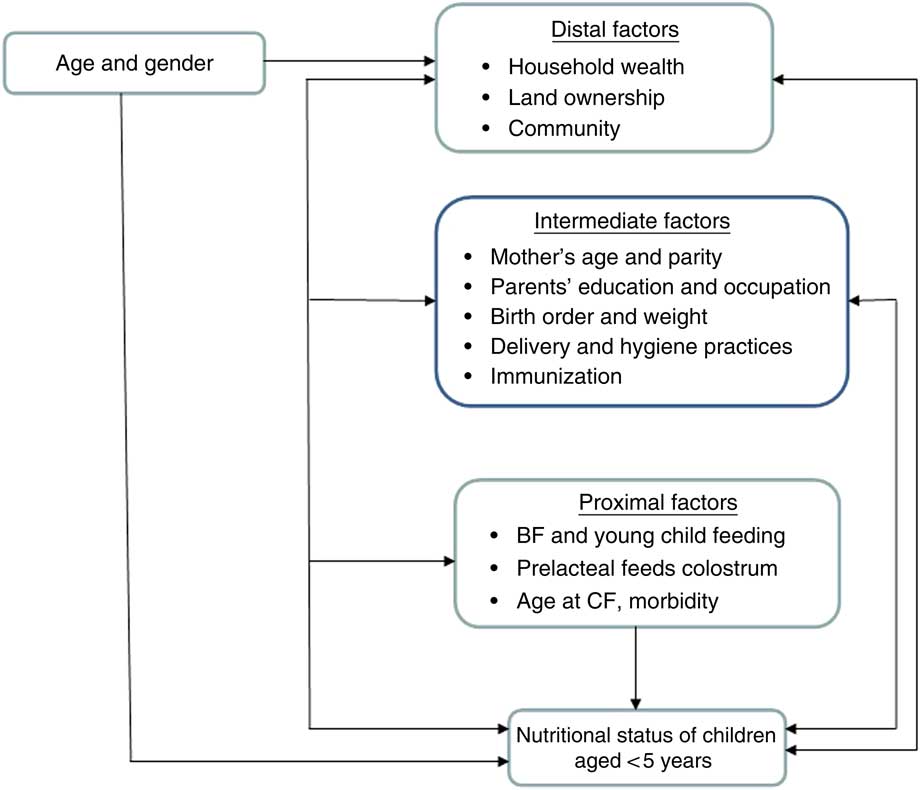
Fig. 1 (colour online) Factors controlled for in hierarchical order in the adjusted logistic regression analyses for underweight, stunting and wasting (BF, breast-feeding; CF, complementary feeding)
The nutritional status of children was assessed according to sd classification( 14 ) using the WHO Child Growth Standards( 15 ). Children who were below 2 sd from the reference median (median<−2 sd) on the basis of weight-for-age, height-for-age and weight-for-height indices were classified as underweight, stunted and wasted, respectively; while children who were below 3 sd from the reference median (median<−3 sd) were classified as severely underweight, severely stunted and severely wasted, respectively.
Results
Coverage
A total of 4038 (2095 boys, 51·9 %) children aged 0–35 months were covered for IYCF practices and anthropometric measurements. The mean age of the children was 16·3 (sd 9·5) months.
Sociodemographic characteristics
The majority (88·6 %) of children belonged to the Hindu religion, while 7 % were Muslims; 14 % belonged to ST communities, 26 % to SC and 35 % were from the other backward caste category. About 44 % were living in a kutcha house, 34 % in a semi-pucca house, while only 23 % had a pucca house. About 43 % belonged to a nuclear family while 38 % were from joint families, 78 % of houses had electricity, 39 % of HH were using tap water for drinking purposes and 29 % of HH had a sanitary latrine. Monthly per capita income was Rs 1083 only.
Feeding practices of infants
Only 36 % of the mothers initiated breast-feeding within 1h of birth, while 15 % did so after 24h. About 50 % of children were exclusively breast-fed up to 6 months. Among children aged 6–11 months, 54 % had complementary feeding initiated at 6–7 months old. Minimum dietary diversity was observed among 31 % of 6–11-month-old children while it was 85 % among 12–23-month-old children.
Prevalence of undernutrition among children
The prevalence of underweight, stunting and wasting was 38, 41 and 22 %, respectively, and all prevalences except wasting were lower among girls (36 % underweight, 39 % stunted) compared with boys (40 and 44 %, respectively).
Association between sociodemographic characteristics and undernutrition using bivariate analyses
The odds of being underweight were 1·91 times higher among children aged 12–35 months compared with 0–11-month-olds. The odds of being underweight were 1·28 times higher among boys than girls. The odds of underweight were 2·89 and 1·60 times higher among children belonging to ST and SC compared with others; 1·57 times higher among children belonging to nuclear families compared with joint families; 2·17 times higher among children of illiterate mothers compared with children of the most highly educated mothers (9th grade or above); 2·56 times higher among children from HH with per capita income in the first tertile compared with children from HH with per capita income in the third tertile; and 2·38 times higher among children belonging to HH not having a sanitary latrine. Similarly, the odds of stunting and wasting were higher among 12–35-month-olds, among boys, among children belonging to ST and SC communities, among children from nuclear families, of illiterate mothers, from HH with per capita income in the first tertile and from HH not having the facility of a sanitary latrine (Table 1).
Table 1 Bivariate analyses of undernutrition according to age, gender and socio-economic status among Indian children aged <3 years, National Nutrition Monitoring Bureau survey, 2011–2012

Ref., reference category.
Association of antenatal care, delivery and feeding practices with undernutrition among 0–11-month-old children using bivariate analyses
The odds of being underweight were 2·90 times higher among children whose mothers did not attend antenatal check-ups compared with those whose mothers had four or more antenatal visits; and about 2·5 times higher among children whose mothers had not consumed or consumed fewer than ninety iron–folic acid (IFA) tablets during pregnancy, compared with those whose others consumed ninety IFA tablets or more. The odds of underweight were 1·61 times higher among children delivered at home than among those delivered at hospital and 2·22 times higher among children with low birth weight than among those with normal weight at birth. Similarly, the odds of stunting were higher among children delivered at home and among low-birth-weight children. The odds of wasting were higher among children whose mothers did not attend antenatal check-ups and among children whose mothers did not consume or consumed fewer than ninety IFA tablets during pregnancy. Only stunting was observed to be significantly associated with minimum dietary diversity (child’s consumption of four or more food groups; OR=1·56; 95 % CI 1·10, 2·21; Table 2).
Table 2 Bivariate analyses of undernutrition among Indian children aged <3 years, National Nutrition Monitoring Bureau survey, 2011–2012
ANC, antenatal care; IYCF, infant and young child; IFA, iron–folic acid; BF, breast-feeding; CF, complementary feeding; ref., reference category.
Undernutrition in relation to feeding practices among 0–11-month-old children
Among 0–5-month-old children, it was observed that undernutrition prevalence was low among exclusively breast-fed infants up to 4 months of age; at age 5 months, the prevalence was higher among exclusively breast-fed children compared with those receiving complementary feeding in addition to breast milk. Among 6–11-month-old children, the prevalence of underweight and stunting was lower among children who received complementary feeding in addition to breast milk at age 6–8 months compared with those who were exclusively breast-fed or those who received complementary feeding after 8 months.
Association of complementary feeding practices and immunization with undernutrition among 12–23-month-old children
The prevalence of underweight and wasting was observed to be high among children who were exclusively breast-fed (78·6 and 50·0 %, respectively) compared with children who received complementary feeding in addition to breast milk (43·7 and 22·0 %, respectively). Underweight and stunting prevalences were observed to be high among children who received complementary feeding after age 8 months (45·2 and 58·0 %, respectively) compared with children who received complementary feeding at 6–8 months of age (40·8 and 52·9 %, respectively). It was also observed that the prevalence of underweight and stunting was higher among partially immunized or not immunized children (53·0 and 63·0 %, respectively) compared with fully immunized children (39·5 and 50·8 %, respectively). The underweight and wasting prevalences were significantly higher (P<0·001) among 12–35- month-old children who did not meet minimum dietary diversity (fewer than four food groups in diet; 54·0 and 31·3 %, respectively) than among children having minimum dietary diversity (39·7 and 19·8 %, respectively). The odds of underweight and stunting were 1·7 and 1·6 times higher among partially/not immunized children compared with children fully immunized against six vaccine-preventable diseases, while underweight (OR=1·65; 95 % CI 1·45, 2·05) and wasting (OR=1·66; 95 % CI 1·29, 2·12) were higher among children not meeting minimum dietary diversity than among children with minimum dietary diversity (Table 2).
Stepwise logistic regression analysis for undernutrition using the conceptual framework
It was observed that the odds of underweight at entry level were 2·29 (95 % CI 1·83, 2·86) and 1·40 (95 % CI 1·16, 1·70) times higher among children belonging to ST and SC communities, respectively, compared with children from the others category. The odds of underweight were 2·04 (95 % CI 1·71, 2·43) times higher among children belonging to the lowest socio-economic group compared with children from the highest socio-economic group. Children from nuclear families had 1·27 (95 % CI 1·09, 1·47) times more risk and children living in kutcha houses had 1·63 (95 % CI 1·32, 2·02) times more risk of underweight than children from joint families and children living in pucca houses, respectively. In the second stage, in addition to the above variables, mother’s education, sanitary latrine, hand-washing practices of mothers, IFA consumption during pregnancy, place of birth and birth weight were added. The risk of underweight was 1·48 (95 % CI 1·02, 2·14) times higher among children of illiterate mothers compared with children whose mothers were educated to 9th grade or above. The risk of underweight was 1·37 (95 % CI 1·00, 1·89) times higher among children from HH not having the facility of a sanitary latrine. Low-birth-weight children had 2·13 times higher risk of underweight (95 % CI 1·43, 3·16) compared with normal-birth-weight children. Furthermore, compared with children whose mothers had consumed ninety or more, underweight risk was 2·14 and 2·09 times higher among those children whose mothers had consumed fewer than ninety or not consumed IFA tablets during pregnancy, respectively. In the third stage, in addition to the above variables, time of initiation of breast-feeding, age at complementary feeding initiation and morbidity were added, but they were not observed to be associated with underweight (Table 3).
Table 3 Adjusted logistic regression analysis of factors associated with undernutrition among Indian children aged <3 years, National Nutrition Monitoring Bureau survey, 2011–2012

Ref., reference category; IFA, iron–folic acid tablets.
Similarly, age and gender were associated with stunting. The risk of stunting was 1·78 (95 % CI 1·42, 2·23) and 1·44 (95 % CI 1·19, 1·74) times higher among children belonging to ST and SC communities, respectively, compared with children from the others category. The odds of stunting were 1·91 (95 % CI 1·61, 2·28) times higher among children belonging to the lowest socio-economic group than among those from the highest socio-economic group. Children living in kutcha houses had 1·31 (95 % CI 1·08, 1·66) more risk of stunting compared with children living in pucca houses. In the second stage, community and per capita income, mother’s education, sanitary latrine, birth weight and IFA consumption were significantly associated with stunting. The risk of stunting was 1·69 (95 % CI 1·17, 2·44) times higher among children of illiterate mothers compared with children whose mothers had studied to 9th grade or above. The risk of stunting was 1·55 (95 % CI 1·17, 2·15) times higher among children from HH without a sanitary latrine. Low-birth-weight children had 1·64 times higher risk of stunting (95 % CI 1·09, 2·47) than normal-birth-weight children. Mothers not consuming IFA tablets increased the children’s risk of stunting by 2·08 (95 % CI 1·38, 3·13) times compared with consumption of ninety or more IFA tablets during pregnancy. In the third stage, in addition to the above variables, infant feeding and morbidity were added, but were not observed to be associated with stunting (Table 3).
Gender was observed to be associated with wasting at entry level. In the first stage, the risk of wasting was 1·79 (95 % CI 1·39, 2·31) and 1·47 (95 % CI 1·18, 1·85) times higher among children belonging to ST and SC communities than among children from the others category. The odds of wasting were 1·52 (95 % CI 1·24, 1·85) times higher among children belonging to the lowest socio-economic group compared with those from the highest. Children living in kutcha houses and children from nuclear families had 1·50 and 1·26 times more risk of wasting compared with their counterparts in pucca houses and joint families. In the second stage, children whose weight was not measured and children whose mothers had not consumed or consumed fewer than ninety IFA tablets had 1·58, 1·51 and 1·60 times more risk of wasting, respectively. In the third stage, feeding practices and morbidity was added, but none of them was significant (Table 3).
Regression analysis carried out among 12–23-month-old children using variables such as education of mother, immunization, hand-washing practices before feeding, minimum dietary diversity and morbidity during the previous fortnight, keeping age and sex constant, showed that the risk of undernutrition was significantly higher among children of illiterate mothers, those not receiving any immunization or partially immunized and those not meeting minimum dietary diversity (Table 4).
Table 4 Logistic regression analysis of factors associated with undernutrition among Indian children aged 12–23 months, National Nutrition Monitoring Bureau) survey, 2011–2012

Ref., reference category.
Discussion
During 2011–2012, the NNMB carried out for first the time a study on IYCF practices in ten states of India representing 80 % of the population. Optimal nutrition in the first 2 years of life – that is, early and exclusive breast-feeding and continued breast-feeding for 2 years or more, together with nutritionally adequate, safe, age-appropriate and responsive complementary feeding starting at 6 months – is critical to prevent stunting in infancy and early childhood and break the intergenerational cycle of undernutrition. The present study observed suboptimum IYCF practices among the 0–23-month-old children. It was observed that only 36 % of infants received breast-feeding within an hour of birth, similar to UNICEF data on this IYCF indicator of 41 % for India, 43 % for Bangladesh, 50 % for Thailand and 38 % % in Nigeria. About 50 % of 6–11-month-old children were exclusively breast-fed up to 6 months of age, similar to the UNICEF findings which showed 57 % of children aged 6–9 months in India were exclusively breast-fed up to 6 months, but lower than the findings of 74 % for Bangladesh and 75 % for Indonesia and Nigeria( 16 ). The National Family Health Survey-4 (NFHS-4) also reported similar findings for India, which is 55 %( 17 ). Exclusively breast-fed infants are at a lower risk of diseases like diarrhoea and pneumonia. In 2011, UNICEF highlighted that breast-feeding is a preventive intervention and the most important element in reducing child mortality( 18 ).
WHO recommends that infants should start receiving complementary foods at 6 months of age in addition to breast milk. However, in the present study, only 54 % of children aged 6–11 months received complementary feeding at 6–7 months of age, which is similar to a previous study( Reference Meshram, Mallikharjun Rao and Reddy 19 ). NFHS-4 reported only 43 % of children aged 6–8 months receiving complementary foods( 17 ).
Undernutrition was observed to be associated with antenatal and perinatal care and infant feeding practices. A study by Pokhrel et al.( Reference Pokhrel, Nanishi and Poudel 20 ) in Nepal observed a significant association between antenatal care practices and undernutrition among children. Mother’s education was observed to be associated with availing of antenatal care services as observed by Tayie and Lartey( Reference Tayie and Lartey 21 ) and Meshram et al. ( Reference Meshram, Laxmaiah and Venkaiah 22 ). No significant association was observed between undernutrition and time of breast-feeding initiation, similar to a previous study( Reference Meshram, Mallikharjun Rao and Reddy 19 ); however, Bahl et al. observed significant associations between these practices and increase in morbidity and mortality among them( Reference Bahl, Frost and Kirkwood 23 ). A significant association between low birth weight and undernutrition was observed in the present study, which concurs with our previous studies( Reference Meshram, Mallikharjun Rao and Reddy 19 , Reference Meshram, Laxmaiah and Venkaiah 22 ). Low-birth-weight babies are more prone to infections and thus undernutrition. Breast-feeding is the best method of infant feeding to meet the nutritional, metabolic and psychological needs of the baby. Exclusive breast-feeding is a feasible strategy especially in low-income countries as it reduces the risk of infant mortality, morbidity and especially infection. Ogbo et al. ( Reference Ogbo, Agho and Page 24 ) observed that early initiation of breast-feeding was associated with higher maternal education, frequent antenatal care visits and birth interval.
The prevalence of undernutrition observed in the current study is higher except wasting than in the NFHS-4 carried out in India, which reported 32, 32 and 25 % for underweight, stunting and wasting, respectively( 17 ). UNICEF data showed that 35 % of under-5s in South Asia were stunted, while this prevalence was 34 % in Africa, whereas wasting prevalence was 16 % in South Asia and 6–9 % in Africa( 25 ).
Undernutrition was observed to be significantly higher among children of illiterate mothers, children from SC and ST communities, and children from HH of low socio-economic status. Educated mothers have more efficiency in the management of limited HH resources, greater utilization of health-care services, better health-promoting practices, low fertility and more child-centred caring practices( Reference Bharati, Pal and Chakrabarty 26 ). SC and ST communities are socio-economically deprived groups; children from these communities have low socio-economic status and thus high rates of undernutrition.
High rates of undernutrition may be due to poor knowledge of mothers about feeding practices, low education and poor socio-economic status, similar to other studies( Reference Mananga, Kana–Sop and Nolla 27 ). There is a significant relationship between improvement in nutritional status of children and optimum infant feeding practices by their mothers. Delayed initiation of breast-feeding, deprivation from colostrum and improper complementary feeding were significant risk factors for undernutrition among under-5s as observed by Kumar et al. ( Reference Kumar, Goel and Mittal 28 ). Severe undernutrition was significantly higher in children when weaning was delayed( Reference Rasania and Sachdev 29 ). In the present study, the prevalence of underweight and stunting was observed to be high among children who received complementary feeding after age 8 months compared with children who received complementary feeding at 6–8 months of age. It was also observed that the prevalence of underweight and stunting was higher among partially immunized or not immunized children than among fully immunized children.
The present study found a significant association between minimum dietary diversity and undernutrition. Bentley et al.’s study in Mumbai observed that only 13 % of children aged 6–23 months were meeting minimum dietary diversity, while 43 % had minimum meal frequency, but no association was observed with nutritional status( Reference Bentley, Das and Alcock 30 ); while Arimond and Ruel observed a significant association of dietary diversity with stunting( Reference Arimond and Ruel 31 ). In Ghana, Sakaa et al. demonstrated that the high percentage of malnutrition in the children may be attributed to the faulty consistency of foods which are traditionally fed to children as well as to less emphasis on iron- and vitamin-rich foods( Reference Sakaa, Wemakor and Abizary 32 ). Hence emphasis on providing a variety of food groups to the child, along with optimal timely complementary feeding at 6 months of age, is desirable for achieving the child’s growth potential and health.
The main limitation of the present study is that most of the risk factor details were obtained from the mother because there was no other means of obtaining the information; thus there could have been recall bias. However, the outcome was measured prospectively by trained investigators and so maternal recall bias was less likely to have affected the observed associations. The major strengths of the study are its national representation covering more than 80 % of the population and data being collected by trained investigators of NNMB who were working in the same field.
Conclusions
The prevalence of undernutrition among Indian children aged <3 years was observed to be high and associated with low socio-economic status, illiteracy of the mother, low birth weight and lack of dietary diversity. Improving mothers’ socio-economic and literacy status can help in improving maternal nutrition during pregnancy and thus low birth weight. Also improving mothers’ knowledge about IYCF practices will help in improving the nutritional status of children.
Acknowledgements
Acknowledgements: The authors are thankful to the Director of the National Institute of Nutrition, Hyderabad for support during the study. They would like to thank all technical staff of the field division for their technical support. They are grateful to Mr Bhaskar and Dr Naveenkumar for their help in analysing data. The authors extend sincere thanks to the entire field staff from different states for their efforts in the data collection. Financial support: This work was supported by the Indian Council of Medical Research, New Delhi. The Indian Council of Medical Research had no role in the design, analysis or writing of this article. Conflict of interest: None declared. Authorship: All authors were involved in study design, sampling and protocol development; I.I.M. drafted the manuscript and all other authors reviewed it; N.B.K. was involved in data analysis. Ethics of human subject participation: This study was conducted according to the guidelines laid down in the Declaration of Helsinki and all procedures involving human subjects were approved by the Institutional Ethical Committee of the National Institute of Nutrition as well as the Scientific Advisory Committee. Written informed consent was obtained from the mothers involved in the study.


