


Maintaining a healthy body weight is an effective way to reduce the risk for diabetes, CVD and some cancers( Reference Allison, Fontaine and Manson 1 – Reference Haslam and James 3 ). Poor diet and physical inactivity are key behavioural factors contributing to excess body weight and high body fatness. Adequate nutrient intake is important for optimal health, beyond total energy intake. In fact, it has been argued that dietary patterns such as the Mediterranean diet, with its emphasis on consumption of fruit, vegetables, whole grains and fish, affect body weight independent of energy intake( Reference Esposito, Kastorini and Panagiotakos 4 ). Despite an abundance of foods in the US marketplace, many people do not eat a variety of foods that would provide adequate levels of nutrient intake, as specified in the Dietary Guidelines for Americans, while meeting their energy requirements( 5 ). In addition, energy restriction may further compromise intakes of essential nutrients( Reference Caballero 6 ). Of particular concern are low intakes of dietary fibre, Ca, K and vitamin D, which are lower than current recommendations in many individuals( 5 , Reference Karppanen, Karppanen and Mervaala 7 ), and are associated with obesity( Reference Howarth, Saltzman and Roberts 8 ), hypertension( Reference Karppanen 9 , Reference Vaskonen 10 ) and osteoporosis( Reference Garriguet 11 ).
There is some evidence that physical activity (PA) is associated with a better dietary intake( Reference Csizmadi, Kelemen and Speidel 2 , Reference Cao, Sasaki and Oh 12 , Reference Carlson, Sallis and Ramirez 13 ). The benefits of PA regarding nutrient intake, however, have been attributed to an exercise-induced increase in energy requirement that is typically compensated by increased energy intake( Reference Westerterp 14 ), rather than differences in dietary pattern. Diet information, however, was commonly obtained via diet history questionnaires( Reference Csizmadi, Kelemen and Speidel 2 , Reference Cao, Sasaki and Oh 12 ), which provide only limited information on current dietary patterns. Most studies further focused on the elderly or members of high-risk populations, such as the obese or metabolic syndrome patients( Reference Shay, Van Horn and Stamler 15 , Reference Kaur and Henry 16 ). Currently, there is limited information on the association between nutrient intake and PA in young, healthy adults. The present study examined if nutrient intake varies by PA level (PAL) in adults aged 21–35 years. It was hypothesized that individuals who have higher PAL have higher intakes of key nutrients. Given that PAL and dietary patterns have been shown to differ between normal-weight and overweight/obese individuals( Reference Zemel, Donnelly and Smith 17 , Reference Proper, Singh and van Mechelen 18 ), potential differences in this association by weight status were examined as well.
Methods
Participants
The present study used baseline data from an ongoing observational study. The design and rationale for the Energy Balance Study has been described in detail previously( Reference Hand, Shook and Paluch 19 ). Briefly, 430 healthy young adults (48·5% male; 21–35 years of age) with a BMI between 20 and 35 kg/m2 were recruited via flyers, email messages on listservs and social media. Inclusion/exclusion criteria were selected to allow for the recruitment of a broad group of individuals with no major acute or chronic diseases. Specifically, exclusion criteria consisted of participants with a resting blood pressure exceeding 150 mmHg systolic and/or 90 mmHg diastolic, an ambulatory blood glucose level greater than 145 mg/dl or self-reported medication for any major chronic health condition. In addition, participants were excluded if they reported a history of major depression, anxiety disorder or panic disorder. In order to be included in the present analysis participants needed to have had at least two 24 h diet recalls (24HR) and at least 5 d (including two weekend days) of valid, objectively measured PA data; resulting in a final sample size of 407 (49 % men). The study was approved by the University of South Carolina Institutional Review Board and all participants signed informed consent prior to data collection.
Assessment of body size and composition
Body weight (in kilograms) and height (in centimetres) were measured according to standard procedures, with participants wearing surgical scrubs and in bare feet. The average of three measurements was used to calculate BMI (BMI=body weight/height2), which was subsequently used to differentiate between normal-weight (18·5 kg/m2 <BMI<25·0 kg/m2) and overweight/obese individuals (BMI≥25·0 kg/m2)( 5 , Reference Lang and Froelicher 20 ). Fat mass and lean mass were measured via dual-energy X-ray absorptiometry (Lunar DPX system, version 3·6; Lunar Radiation Corp., Madison, WI, USA).
Assessment of physical activity level
The SenseWear Mini Armband® (Body Media, Pittsburgh, PA, USA), which has been shown to be a valid device to measure energy expenditure( Reference St-Onge, Mignault and Allison 21 , Reference Welk, McClain and Eisenmann 22 ), was used to measure total daily energy expenditure (TDEE) over a 10 d period. Participants were asked to wear the armband for 24 h except during any periods when the armband could get wet. Participants were deemed compliant if they completed 5 d of wear (including two weekend days) with at least 19 h of verifiable time per day. During non-wear time participants were instructed to record their activities, which were matched with the corresponding metabolic equivalent of task (MET) value according to the 2011 Compendium of Physical Activities( Reference Ainsworth, Haskell and Herrmann 23 ). Energy expenditure missing from the armband was calculated using the participant’s RMR.
RMR was measured via indirect calorimetry using a ventilated hood and an open-circuit system (True One 2400; Parvo Medics, Sandy, UT, USA). Participants arrived in the laboratory after a 12 h fast and at least 24 h after the last bout of structured exercise. Participants remained awake and rested in a supine position for up to 15 min prior to measuring expired gases over a 30 min period.
PAL was calculated (PAL=TDEE/RMR) and used to stratify participants into sedentary or lightly active (PAL<1·6), active or moderately active (1·6≤PAL<1·9) or vigorously active (PAL≥1·9)( 24 ).
Nutrient intake and reporting accuracy
Multiple telephone-administered 24HR interviews were administered over a period of 14 d, including two weekdays and one weekend day. Prior to the 24HR participants received portion size training to increase reporting accuracy. The Nutrition Data System for Research software (NDSR® version 2012) was used to conduct the dietary interviews. NDSR is considered the state-of-the-art research software for conducting dietary recalls( Reference Novotny, Rumpler and Judd 25 ). In the present study, 24HR were collected by a team of experienced (>6 years of using NDSR) registered dietitians specifically trained in using the NDSR protocol using the multi-pass approach. The protocol uses prompting to reduce omissions and standardizes the interview method across interviews. Interviews were conducted on randomly selected, non-consecutive days and cold calls were made to participants to minimize preparation that could bias recall. In order to be included in the analysis participants needed to complete at least two diet recalls( Reference Ma, Olendzki and Pagoto 26 ).
In order to adjust for dietary misreporting, the difference between reported energy intake (EI) and energy requirement was used as a covariate (EI difference) in statistical analyses. Energy requirement was calculated based on change in fat mass and fat-free mass over a 3-month period and average TDEE( Reference Thomas, Schoeller and Redman 27 ). In addition, scores derived from the Marlow–Crowne Social Desirability Scale( Reference Crowne and Marlowe 28 ) and the Martin–Larsen Approval Motivation Scale( Reference Martin 29 ) were used to evaluate social desirability and social approval of participants, which have been shown to bias self-reported dietary information( Reference Hebert, Hurley and Peterson 30 – Reference Hebert, Ma and Clemow 33 ).
Statistical analysis
Due to potential differences in dietary nutrient intakes and PA, normal-weight and overweight/obese participants were analysed separately. Descriptive characteristics were calculated for the three PAL groups within each weight category. The nutrient intake differences between different activity groups were initially examined via MANCOVA, adjusting for sex, age, social desirability, social approval and EI difference; a second analysis adjusted for reported EI, in addition to the previously used covariates. All analyses were carried out using the statistical software package SPSS Version 16 and the nominal significance level for a linear trend across groups was set at α=0·05.
Results
Descriptive characteristics are presented in Table 1. Two-thirds (67 %) of the participants were of European descent, with the majority (84 %) having ≥4 years of college education. In the total sample, 84 % of participants (51 % male) were considered active or vigorously active. There were no differences by weight category in race, sex and educational background. However, normal-weight participants were significantly younger than overweight/obese participants (27·0 (sd 3·6) v. 28·3 (sd 3·8) years; P<0·01) and had significantly higher PAL (P<0·01). In both normal-weight and overweight/obese groups, more men were vigorously active. There were no differences in anthropometric characteristics across PAL categories in the normal-weight participants while BMI decreased with increasing PAL in overweight/obese (P for trend <0·01).
Table 1 Descriptive characteristics of the sample of healthy young adult participants from the Energy Balance Study, by activity level in each weight category

EI, energy intake; TDEE, total daily energy expenditure; MVPA, moderate and vigorous physical activity (in bouts of at least 10 min with a minimum of 8 min at an intensity >3 MET); MET, metabolic equivalent of task; PAL, physical activity level.
Values are percentages for categorical variables, means and standard deviations for continuous variables.
Sedentary=PAL<1·6; active=1·6≤PAL<1·9; vigorously active=PAL≥1·9.
Table 2 shows nutrient intakes by activity group, separately for normal-weight and overweight/obese participants. After adjusting for age, sex, social desirability, social approval and EI difference, normal-weight participants had lower intakes of protein, cholesterol, P, Na, Se, choline (P<0·01), Ca and Zn (P<0·05), but higher carbohydrate intake (P<0·05), compared with overweight/obese participants. After additionally controlling for reported EI, normal-weight participants had lower protein (P<0·05) and Na intakes (P<0·01) but higher intakes of total fibre, Mg, Cu and vitamin E (P<0·01) than overweight/obese participants.
Table 2 Macro- and micronutrient intakes of the sample of healthy young adult participants from the Energy Balance Study, by activity level in each weight category
EI, energy intake; RAE, retinol activity equivalents (RAE vitamin A=µg retinol + (µg β-carotene equivalents/12)).
Sedentary =PAL<1·6; active=1·6≤PAL<1·9; vigorously active=PAL≥1·9.
* P for trend <0·05 in overweight/obese adults after adjusting for age, sex, social desirability, social approval and EI difference.
† P for trend <0·05 in normal-weight adults adjusting for age, sex, social desirability, social approval and EI difference.
‡ P for trend <0·05 in normal-weight adults after additionally adjusting for reported EI.
After adjusting for age, sex, social desirability, social approval and EI difference, in the normal-weight group, vigorously active participants had significantly higher intakes of Mg, P, Na, Cu, Se, thiamin, niacin and choline compared with sedentary participants (all P<0·05; Fig. 1); in overweight/obese participants, except for higher Na and Cu intakes (P<0·05), vigorously active participants had similar nutrient intakes to sedentary participants (Fig. 2). Differences were no longer significant after additionally adjusting for reported EI.
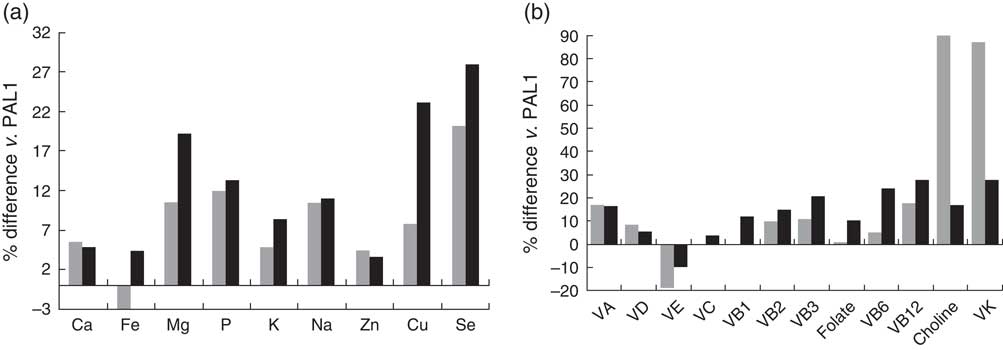
Fig. 1 Percentage difference in the intakes of (a) minerals and (b) vitamins in active (PAL2; ![]() ) and vigorously active (PAL3;
) and vigorously active (PAL3; ![]() ) participants compared with sedentary (PAL1) participants in the normal-weight group adjusting for age, sex, social desirability, social approval and EI difference; sample of healthy young adult participants from the Energy Balance Study. The mineral or vitamin % difference of PAL2 v. PAL1 is equal to [(reported mineral or vitamin intakePAL2 – reported mineral or vitamin intakePAL1)/reported mineral or vitamin intakePAL1] ×100 %; the mineral or vitamin % difference of PAL3 v. PAL1 is equal to [(reported mineral or vitamin intakePAL3 – reported mineral or vitamin intakePAL1)/reported mineral or vitamin intakePAL1) ×100 % (PAL, physical activity (sedentary=PAL<1·6, active=1·6≤ PAL<1·9, vigorously active=PAL ≥1·9); EI, energy intake; VA, vitamin A; VD, vitamin D; VE, vitamin E; VC, vitamin C; VB1, thiamin; VB2, riboflavin; VB3, niacin; VB6, vitamin B6; VB12, vitamin B12, VK, vitamin K)
) participants compared with sedentary (PAL1) participants in the normal-weight group adjusting for age, sex, social desirability, social approval and EI difference; sample of healthy young adult participants from the Energy Balance Study. The mineral or vitamin % difference of PAL2 v. PAL1 is equal to [(reported mineral or vitamin intakePAL2 – reported mineral or vitamin intakePAL1)/reported mineral or vitamin intakePAL1] ×100 %; the mineral or vitamin % difference of PAL3 v. PAL1 is equal to [(reported mineral or vitamin intakePAL3 – reported mineral or vitamin intakePAL1)/reported mineral or vitamin intakePAL1) ×100 % (PAL, physical activity (sedentary=PAL<1·6, active=1·6≤ PAL<1·9, vigorously active=PAL ≥1·9); EI, energy intake; VA, vitamin A; VD, vitamin D; VE, vitamin E; VC, vitamin C; VB1, thiamin; VB2, riboflavin; VB3, niacin; VB6, vitamin B6; VB12, vitamin B12, VK, vitamin K)
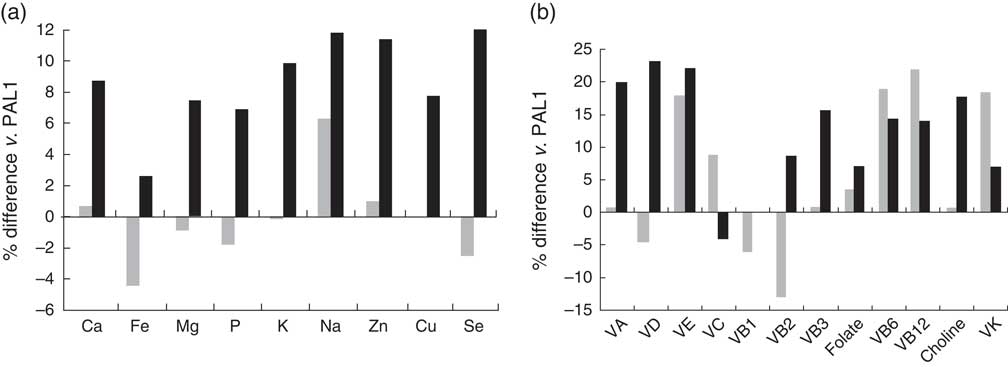
Fig. 2 Percentage difference in the intakes of (a) minerals and (b) vitamins in active (PAL2; ![]() ) and vigorously active (PAL3;
) and vigorously active (PAL3; ![]() ) participants compared with sedentary (PAL1) participants in the overweight/obese group adjusting for age, sex, social desirability, social approval and EI difference; sample of healthy young adult participants from the Energy Balance Study. The mineral or vitamin % difference of PAL2 v. PAL1 is equal to [(reported mineral or vitamin intakePAL2 – reported mineral or vitamin intakePAL1)/reported mineral or vitamin intakePAL1] ×100 %; the mineral or vitamin % difference of PAL3 v. PAL1 is equal to [(reported mineral or vitamin intakePAL3 – reported mineral or vitamin intakePAL1)/reported mineral or vitamin intakePAL1) ×100 % (PAL, physical activity (sedentary=PAL<1·6, active=1·6≤ PAL <1·9, vigorously active=PAL≥1·9); EI, energy intake; VA, vitamin A; VD, vitamin D; VE, vitamin E; VC, vitamin C; VB1, thiamin; VB2, riboflavin; VB3, niacin; VB6, vitamin B6; VB12, vitamin B12, VK, vitamin K)
) participants compared with sedentary (PAL1) participants in the overweight/obese group adjusting for age, sex, social desirability, social approval and EI difference; sample of healthy young adult participants from the Energy Balance Study. The mineral or vitamin % difference of PAL2 v. PAL1 is equal to [(reported mineral or vitamin intakePAL2 – reported mineral or vitamin intakePAL1)/reported mineral or vitamin intakePAL1] ×100 %; the mineral or vitamin % difference of PAL3 v. PAL1 is equal to [(reported mineral or vitamin intakePAL3 – reported mineral or vitamin intakePAL1)/reported mineral or vitamin intakePAL1) ×100 % (PAL, physical activity (sedentary=PAL<1·6, active=1·6≤ PAL <1·9, vigorously active=PAL≥1·9); EI, energy intake; VA, vitamin A; VD, vitamin D; VE, vitamin E; VC, vitamin C; VB1, thiamin; VB2, riboflavin; VB3, niacin; VB6, vitamin B6; VB12, vitamin B12, VK, vitamin K)
Discussion
Results of the present study suggest that individuals who have higher PAL have higher intakes of key nutrients. After additionally adjusting for reported EI, there was no difference in nutrient intakes across PAL categories, indicating that dietary pattern did not differ by activity level. A higher PAL, however, allows for a higher energy intake while maintaining energy balance.
Various studies have shown a positive association between PAL and concordance with nutrient guidelines( Reference Csizmadi, Kelemen and Speidel 2 , Reference Fogelholm, Anderssen and Gunnarsdottir 34 , Reference Parsons, Power and Manor 35 ) and there is evidence of a positive association between nutrient intake and cardiorespiratory fitness( Reference Cao, Sasaki and Oh 12 , Reference Brodney, McPherson and Carpenter 36 ). The present study also showed higher intakes of key nutrients in active normal-weight participants, but nutrient intakes no longer differed when total energy intake was taken into consideration. PA per se, therefore, may not affect dietary pattern. However, higher energy expenditure due to increased PA would allow for greater food consumption while maintaining energy balance. Individuals who want to maintain body weight at low levels of energy expenditure must sustain food restriction over the long term, which may not be feasible for most people. Hence, at low levels of energy expenditure individuals may continually be at risk of gaining weight or insufficient nutrient intake. It has further been hypothesized that there is a minimum threshold for energy expenditure above which energy intake is more easily matched to expenditure through appetite control( Reference Hill, Wyatt and Peters 37 ). Results of the present study suggest that PA does not necessarily affect dietary pattern but it does allow for a higher energy intake, which could contribute to dietary nutrient adequacy and provide health benefits in excess of supplements. This is an additional argument for the importance of PA regarding overall health.
Consistent with various observations in other Western populations( Reference Csizmadi, Kelemen and Speidel 2 , Reference Karppanen, Karppanen and Mervaala 7 , Reference Anderson, Cotterchio and Boucher 38 , Reference Garriguet 39 ), our results indicated that sedentary young adults consumed lower amounts of essential minerals and vitamins from the array of foods while meeting their energy needs. Diets low in energy and nutrients, to compensate for increasingly sedentary lifestyles, may, however, have detrimental effects on overall health. Even though these individuals try to reduce chronic disease risk with weight maintenance, they may have nutrient inadequacies that increase their risk for some chronic diseases( Reference Fairfield and Fletcher 40 , Reference Fletcher and Fairfield 41 ). For example, dietary fibre is good for promoting intestinal peristalsis and preventing colon cancer. It has been further shown that healthy-weight participants with a higher PAL consume more dietary fibre, which is associated with a lesser degree of weight gain( Reference van Dam and Seidell 42 ). Consumption of an additional 14 g fibre/d for >2 d is associated with a 10 % decrease in energy intake due to an increase in post-meal satiety and a decrease in subsequent hunger( Reference Howarth, Saltzman and Roberts 8 ). The present study showed that higher PAL is associated with higher fibre intake, particularly in normal-weight participants.
Minerals and vitamins are key nutrients for health maintenance and chronic disease prevention( Reference Ramage-Morin and Garriguet 43 ). For example, Ca, Mg and K are crucial in building and maintaining bone mineral density( Reference Sarkis, Pinheiro Mde and Szejnfeld 44 ). Dietary Ca, Mg and K combined with plant sterols have been suggested as a promising novel approach to modifying CVD risk( Reference Vaskonen 10 , Reference Vaskonen, Mervaala and Krogerus 45 ). Insufficient intakes of Ca, Mg and K and high Na intake are associated with arterial hypertension( Reference Karppanen, Karppanen and Mervaala 7 , Reference Karppanen 9 ). The B-group vitamins are essential for energy production. Such as, thiamin helps to convert glucose into energy and has a role in nerve function; riboflavin is primarily involved in energy production and helps vision and skin health; niacin is essential for the body to convert carbohydrates, fat and alcohol into energy, helps maintain skin health and supports the nervous and digestive systems. As was addressed for fibre intake, higher PAL was associated with higher intakes of Mg and K in normal-weight, but not in overweight/obese participants. Although increasing energy expenditure and energy intake alone may not be sufficient to correct the dietary inadequacies, the present results indicate that higher PA is associated with higher intakes of vitamins and minerals, which are associated with various health benefits.
Several limitations need to be considered when interpreting the findings of the present study. The sample consisted predominantly of European-American, well-educated adults with a high activity level (average PAL=1·7), which limits the generalizability of the study results. Further, dietary intake was assessed via self-report, which has inherent sources of measurement error. In order to increase the accuracy of dietary reports, participants were given a validated two-dimensional food portion visual and received 10–15 min of training on how to use it to estimate portion sizes of commonly eaten foods( Reference Posner, Smigelski and Duggal 46 ). To help account for dietary misreporting, social desirability and social approval were also considered in the analysis as these have been shown to bias dietary assessment( Reference Hebert, Hurley and Peterson 30 – Reference Hebert, Ma and Clemow 33 ). In addition, calculated energy requirements were included as a covariate in order to adjust for misreporting of overall dietary intake. It also should also be considered that dietary supplements were not included in the assessment of dietary intake in the present study. Although most people do not consume an optimal amount of all vitamins by diet alone, at least 50 % of adults in the USA take dietary supplements( Reference Millen, Dodd and Subar 47 , Reference Radimer, Bindewald and Hughes 48 ); evidence on the relationship between dietary supplements and health risk is still inconsistent( Reference Park, Murphy and Wilkens 49 , Reference Pocobelli, Peters and Kristal 50 ) and adequate nutrient intake via regular foods remains a safer source of nutrients.
Conclusion
In summary, the present study showed that individuals with a higher PAL have higher intakes of key nutrients. Dietary pattern, however, does not seem to differ significantly between PA categories, suggesting that the benefits of PA are predominantly due to a higher overall food intake while maintaining energy balance, rather than a healthier diet.
Acknowledgements
Acknowledgements: The authors wish to thank the study participants and the Energy Balance Study team. Financial support: Funding for this project was provided through a grant from The Coca-Cola Company. The sponsor played no role in the study design, collection, analysis and interpretation of data, or preparation and submission of this manuscript. Authorship: G.A.H., S.N.B. and J.R.H. conceived and designed the study. R.P.S. managed data collection. Y.Y. analysed the data and wrote the manuscript with input from C.D., J.R.H., R.P.S., T.G.H., G.A.H. and S.N.B. Ethics of human subject participation: The study was approved by the University of South Carolina Institutional Review Board and all participants signed informed consent prior to data collection.


