


Introduction
Wildlife is an essential component of all ecosystems. The unsustainable removal of wildlife (defaunation) can create cascading effects that affect plant communities (e.g., Harrison et al. Reference Harrison, Tan, Plotkin, Slik, Detto and Brenes2013) and thus the ecosystem functions and services they provide (Dirzo et al. Reference Dirzo, Young, Galetti, Ceballos, Isaac and Collen2014, Kurten Reference Kurten2013). For example, without wildlife, the carbon storage capacity of tropical forests could decrease by up to 12% (Osuri et al. Reference Osuri, Ratnam, Varma, Alvarez-Loayza, Hurtado Astaiza and Bradford2016), or by as much as 26–37% in Amazonian forests (Peres et al. Reference Peres, Emilio, Schietti, Desmoulière and Levi2016). Since conserving forests represents as much as 37% of the solution to mitigating climate change (Griscom et al. Reference Griscom, Adams, Ellis, Houghton, Lomax and Miteva2017), ensuring wildlife population numbers are stable is necessary in order to maximize carbon storage. However, the health of wildlife populations often gets overlooked in conservation programmes.
There is growing evidence that many populations of wildlife are declining globally (Dirzo et al. Reference Dirzo, Young, Galetti, Ceballos, Isaac and Collen2014, Ripple et al. Reference Ripple, Chapron, López-Bao, Durant, Macdonald and Lindsey2016), but currently, we do not have access to timely, local and reliable primary (unprocessed) data on the status of these populations for most places on the globe. The Living Planet Index (LPI), an annual indicator that measures changes in vertebrate wildlife population levels at the global level, reported an average decrease of 60% in the abundance of 16 704 populations comprising 4005 species of vertebrates between 1970 and 2014 (WWF 2018). The LPI is calculated by compiling published population time series studies, which can limit its interpretation given that it represents past states of population abundance (due to a built-in lag in the publication of journal articles), key features of the raw data are not available (e.g., error estimates) and publications can be biased (e.g., there are more publications on populations that are decreasing or increasing versus those that are stable). Other evidence for wildlife population declines comes from global assessments by the International Union for Conservation of Nature (IUCN), which compiles information from various sources to assess the conservation status of wildlife. These sources have different degrees of uncertainty or weight, rendering them difficult to interpret and understand (O’Brien et al. Reference O’Brien, Baillie, Krueger and Cuke2010). For mammals and birds, assessments only happen every 4–5 years, which is not frequent enough to capture rapid population changes. The available primary data on wildlife populations are largely incomplete and spatially biased, particularly in megadiverse regions with limited resources (Meyer et al. Reference Meyer, Kreft, Guralnick and Jetz2015). This information must be publicly accessible, sufficiently detailed and in a digestible format to be useful at several scales – from individual protected areas to countries, regions and continents.
The miniaturization of hardware and explosion of digital data types (images, video, sound) over the last 15 years has led to new devices and systems that can be used to sample wildlife populations in a cost-effective way (O’Brien & Kinnaird Reference O’Brien and Kinnaird2013). Camera traps are the most popular such approach, and their use has increased exponentially over the past decade, with thousands of individuals and organizations collecting these data (Steenweg et al. Reference Steenweg, Hebblewhite, Kays, Ahumada, Fisher and Burton2017). Methods to deploy camera traps over large areas in order to monitor and evaluate populations have been well developed (TEAM Network 2011, Wearn & Glover-Kapfer Reference Wearn and Glover-Kapfer2017). These sensors are easy to set up, provide a verifiable record of the data (the image or the video) and sample a range of medium-to-large ground-dwelling mammal and bird species of interest to conservation. These data can be useful to governmental and non-governmental organizations (NGOs) (Ahumada et al. Reference Ahumada, O’Brien, Mugerwa, Hurtado, Rovero and Zimmermann2016), academic and research institutions, extractive companies, citizen scientists (McShea et al. Reference McShea, Forrester, Costello, He and Kays2016) and local and indigenous communities (Schuttler et al. Reference Schuttler, Sears, Orendain, Khot, Rubenstein and Rubenstein2019). However, data collection has increased at a much faster rate than the development of integrated tools to manage, process and analyse these data (Fegraus et al. Reference Fegraus, Lin, Ahumada, Baru, Chandra and Youn2011, Harris et al. Reference Harris, Thompson, Childs and Sanderson2010). A recent global survey of camera trappers (Glover-Kapfer et al. Reference Glover-Kapfer, Soto-Navarro and Wearn2019) found that 61% of respondents identified image cataloguing and data analysis as substantial barriers to effective camera trapping. Without these tools, it is difficult to generate insights from the raw camera trap data and effectively manage wildlife populations.
We identify barriers hindering the use of camera trap data today and describe solutions to take advantage of these data for science and conservation. We propose integrating these solutions in Wildlife Insights (WI), a unique technology and knowledge platform.
Barriers faced by collectors and users of camera trap data
Significant barriers prevent the wildlife management, scientific and conservation communities from taking advantage of camera trap data. First, the camera trap data pipeline is too slow, laborious and tedious. Processing thousands of images from a typical camera trap survey can take several weeks or months. Second, most camera trap data are not shared. Because of the sheer volume of data, most data collectors use only removable or built-in hard drives for data storage. This makes data vulnerable to loss (Michener & Jones Reference Michener and Jones2012), creates data silos (data are not easily accessible) and is a barrier to collaboration and data exchange (Scotson et al. Reference Scotson, Johnston, Iannarilli, Wearn, Mohd-Azlan and Wong2017). Third, most data users are unable to easily analyse camera trap data or extract insights for conservation. Camera trap data are inherently difficult to analyse, and simple questions such as, ‘Is this species population increasing or decreasing at my site?’ can only be answered by a minority of users with training in advanced statistics. Furthermore, most of these users reside in high-income countries, leaving low-income, biodiversity-rich countries vulnerable to analytical gaps. Finally, most of the existing camera trap hardware was not originally designed for science and conservation, but was shaped to satisfy the needs of wildlife hunters. Most current camera trap models lack basic environmental sensors (e.g., light, temperature, humidity), distance and speed measurement sensors (important for estimating movement and density of animals), global position system capabilities, Bluetooth connectivity and other smart features (e.g., identifying blanks or misfires) (Table 1).
Table 1. Main barriers limiting use of camera trap data, proposed solutions and key associated Wildlife Insights components that will implement those solutions.
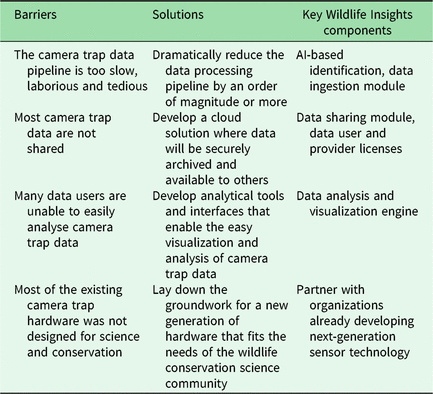
AI = artificial intelligence.
A solution to overcome these barriers: Wildlife Insights
We propose to address these barriers through a technology and open knowledge platform, WI, where global wildlife data can be aggregated, analysed and shared. We propose a specific solution to each of the barriers listed above and then explain how these solutions will be integrated into the platform (Table 1).
First, the data processing pipeline needs to be sped up by at least tenfold. New software that uses artificial intelligence (AI) to automatically identify the species in the image, learns as new species are added to the system and is integrated in a user-friendly interface is needed. This should be coupled with an intuitive and clean interface to manage images, sequences of images and projects all in one place. Second, data silos should be eliminated and data exposure increased, where appropriate, by developing a solution whereby data will be securely archived and available to the wider community of conservationists, scientists and managers. Flexible data licensing models (e.g., Creative Commons) should be available to easily allow data collectors to share data and potential data users to build upon data that are being shared. Third, analytical tools and interfaces that enable the easy visualization and analysis of camera trap data at different levels of aggregation, such as various temporal, spatial and taxonomic scales, are required. A key goal is to improve the ability of wildlife managers and others to make local decisions on the ground based on wildlife data and the socio-environmental context surrounding them. For example, WI could provide wildlife biodiversity outcome indicators that can be integrated into emerging frameworks in order to assess protected area management effectiveness such as IUCN Green List Standards (IUCN & World Commission on Protected Areas 2017). The development and adoption of a new generation of hardware that fits the needs of the wildlife conservation science community should be accelerated. We envision partnering with NGOs already developing next-generation sensor technologies and technology companies in order to achieve this.
Wildlife Insights platform components
There are three basic components to ensure the WI platform fulfils its intended functionality: data input; AI and analysis; and data sharing (Fig. 1). Some of the functionality of the platform is illustrated in Fig. 2, with an emphasis on image display, review and management (Fig. 2(a–c)), as well as some simple analytics (Fig. 2(d)) at the project level.
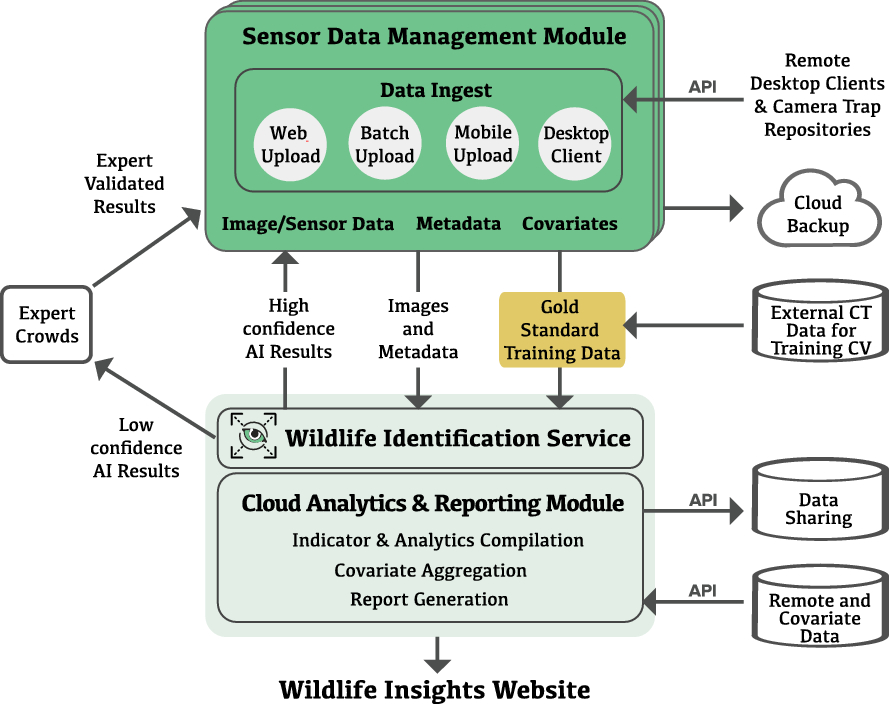
Fig. 1. Wildlife Insights system architecture. AI = artificial intelligence; API = application programming interface; CT = camera trap; CV = computer vision.
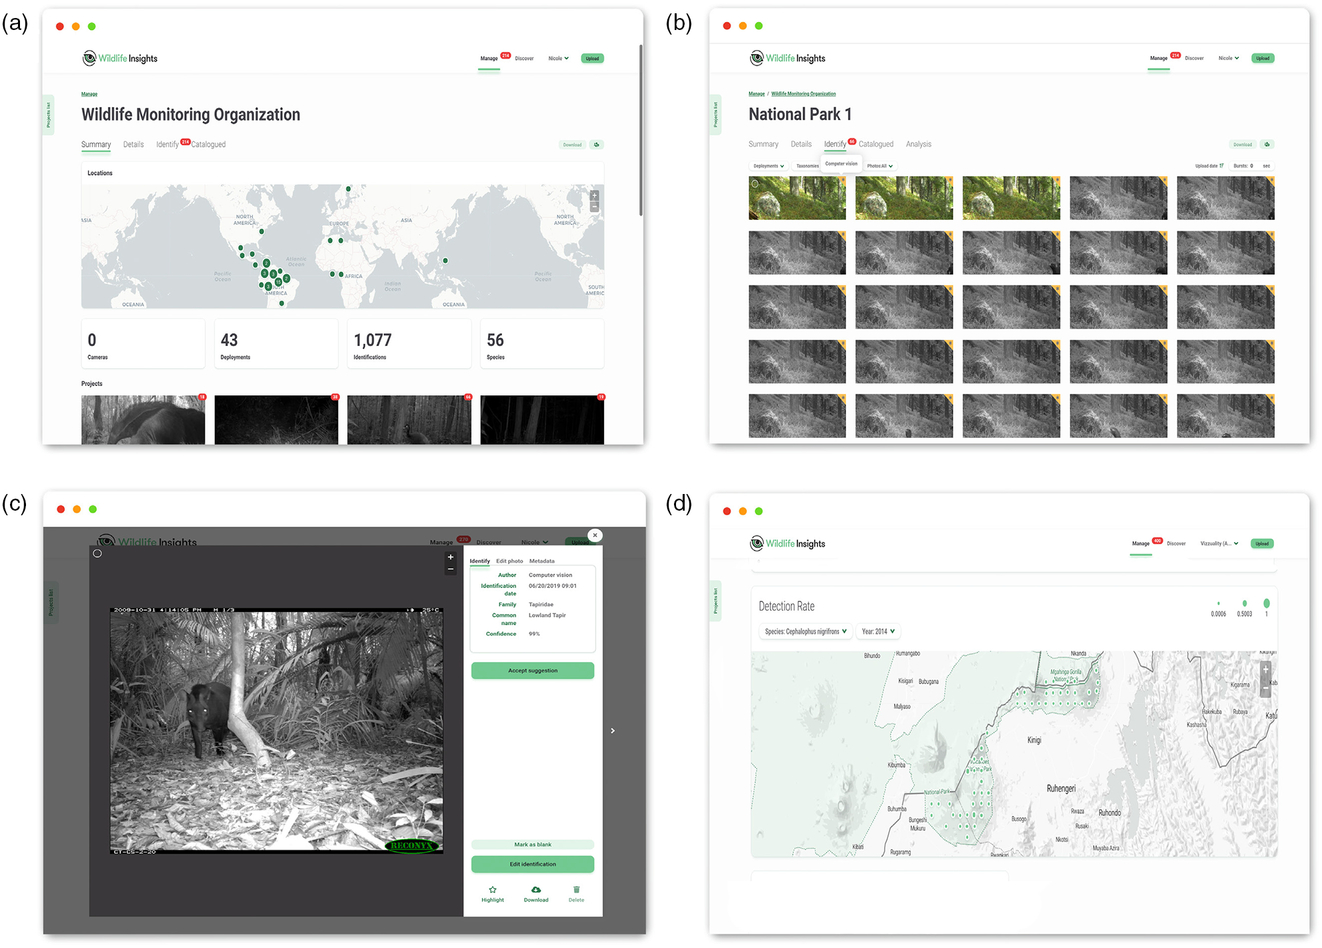
Fig. 2. Screenshots illustrating basic Wildlife Insights functionality at the organization and project level. (a) Main landing page for an organization, showing all projects from that organization and other summary information (e.g., location of camera traps, metadata, maps). (b) View of the ‘Identify’ tab within a project, showing images that have been processed by an artificial intelligence algorithm and are ready for review (yellow stars). (c) Window showing the overlay screen that pops out when clicking on an image or group of images in (b) with identification details (species name, accuracy of identification, etc.), photo editing capabilities, metadata, favourite and download buttons. (d) Analysis tab showing samples of data/model summaries, such as a simple species richness intensity map.
Data input component
This is composed of a data ingestion module and a sensor management module. The data ingestion module allows data to come into the system in four different ways: new raw/unprocessed images; existing catalogued camera trap data uploaded in a batch; catalogued data coming into the system by using application programming interfaces (APIs); and data coming from a desktop client or smartphone app. The sensor data management module organizes all of this information in a database including images, the metadata associated with those images (e.g., time, date, etc.) and ancillary environmental/social covariates associated with a camera trap location or project (e.g., temperature, elevation, etc.). When uploading existing catalogued data either in batch mode or via an API, the data ingestion module implements quality assurance and quality control measures in order to identify typos in species identifications, location errors and inconsistencies in time, date and other variables, and then presents these to the user for correction in order to ensure the ingested data are of the highest quality.
Artificial intelligence and analysis component
This layer consists of two main modules: a wildlife identification service (WIS) and an analytics engine module. In its initial version, the WIS is a multiclass classification deep convolutional neural network model using pre-trained image embedding from Inception – a model that is widely used in image processing for identifying real-world objects (Szegedy et al. Reference Szegedy, Vanhoucke, Ioffe, Shlens and Wojna2016). We fine tune the model using the extensive labelled dataset from the WI partners, taking advantage of temporally and geospatially correlated images to increase accuracy and develop models in order to identify images without wildlife. The WIS will be trained with c. 18 million labelled images from the core partners of WI, and it will be continually retrained as new data come in and better identifications are made. Users will run inferences in the cloud as images are uploaded to the platform and locally in edge environments on desktop and smartphone devices.
An additional part of the data processing and analysis component is an analytics engine and reporting services module that provides key indicators and reports at the species, project, initiative (collection of projects) and global levels. A first level of analytics provides operational statistics for each camera trap project (or initiative), including administrative information, project goals, number of sampling locations, number of deployments (a set of camera trap data coming from a particular spatial location collected over a finite time interval), sampling effort, number of images and observation events and number of species detected. A second level of analytics and visualization tools includes simple statistics and models that can be derived using existing approaches. These include analyses at the species/individual level (e.g., activity budgets), population level (e.g., temporal trends from different metrics such as occupancy, point abundance and density) and community level (species diversity indices). A third level of analytics provides users with more complex spatial and/or temporal products that use environmental/social covariates and allow spatial and/or temporal inferences for various population and community metrics in unsampled locations within the vicinity of a camera trap project (e.g., an entire protected area). These covariates can come from existing standardized global layers (e.g., climate, elevation, protection status) or be provided by data providers at the project level (e.g., habitat structure, management level). In a fourth level, the camera trap data are envisioned to be integrated with other biodiversity data types (i.e., incidental occurrence records, animal movement data, expert range maps, checklists and modelled distributions) from other platforms (i.e., Map of Life, Half Earth) to support global biodiversity conservation (Jetz et al. Reference Jetz, McPherson and Guralnick2012). The integration of camera trap data will offer an unprecedented view of global conservation patterns, which will support the calculation of essential biodiversity variables (EBVs) (Kissling et al. Reference Kissling, Ahumada, Bowser, Fernandez, Fernández and García2018, Pereira et al. Reference Pereira, Ferrier, Walters, Geller, Jongman, Scholes and Bruford2013), specifically the species abundance and species distribution EBVs (Jetz et al. Reference Jetz, McGeoch, Guralnick, Ferrier, Beck and Costello2019) and indicators for the Intergovernmental Science-Policy Platform for Biodiversity and Ecosystem Services (IPBES). A final level of analytics will aggregate all of the camera trap data in WI to produce global products, including population and community indices that can be disaggregated at lower spatial scales (e.g., a global Wildlife Picture Index, disaggregated by country or region, similar to the Living Planet Index) (O’Brien et al. Reference O’Brien, Baillie, Krueger and Cuke2010). All of these products are being designed in a consultative way – with end users in mind – to ensure that they inform understanding of wildlife as well as provide insights for conservation and management at the local scale.
Data sharing component
How the information is shared and presented is key to ensuring achievement of the desired goals of WI. A key module of this component is a front-end multilingual website with basic information about WI, engaging visualization tools and statistics, camera trap resources and standards and a customizable content management system, which allows users/clients to personalize the way they organize, analyse and work with their data. A platform preview website is at www.wildlifeinsights.org.
People and/or organizations that upload their data to WI (data providers) have the option of sharing their data under a flexible license model outlined by the Creative Commons, including public domain CC0, CC BY 4.0 (attribution required) and CC BY-NC 4.0 (attribution non-commercial) (https://creativecommons.org/licenses). Data providers can embargo their data on the platform for an initial period of 1–24 months with the possibility of renewal up to a maximum of 48 months. Embargoed data are not publicly displayed on the platform, but are available to a Wildlife Insights Analytics Taskforce for the purpose of developing platform-wide derived products that are publicly displayed on the WI website (e.g., Wildlife Picture Index). Camera trap images containing people will not be publicly displayed on the platform (see ‘Potential risks’ section). People and/or organizations looking for camera trap data on WI – data users – can browse and download publicly available data, including images and all associated metadata (time, date, camera trap location, species name, etc.), after registering on the platform. When downloading WI data, data users need to record an intended purpose (e.g., use for class exercise or research). Whenever a dataset is downloaded by a data user, the corresponding data provider will receive a notification with information about the data user and intended purpose of use (if shared under CC BY license). This will foster collaboration and communication between data users and data providers while ensuring appropriate attribution if required by the specific data sharing license.
Wildlife Insights organizational structure
Creating a solution with these characteristics cannot be done by one single organization or organization type. This challenge requires a partnership between institutions that collect camera trap data as part of their core mission, organizations with core competencies in data analysis and modelling and technology companies that are at the forefront of emerging software and hardware development in the era of big data. It also requires technologists and conservationists that can bridge domain-specific semantics to design intuitive interfaces for managing and visualizing these data in a way that makes sense to a wide variety of audiences. To date, WI is a partnership between eight organizations – the core partners – including NGOs (Conservation International, Wildlife Conservation Society, World Wildlife Fund, Zoological Society of London), academic organizations (The Smithsonian Institution, North Carolina Museum of Natural Sciences, Yale University) and a technology company (Google).
The governance of WI follows the model of many open source software collaborations, with three different bodies sharing responsibility and guiding the decisions of WI: a steering committee (SC); four thematic standing committees; and a secretariat. The SC is the highest governing body of the platform, and it is composed of individuals representing each of the core partner organizations, chairs of each of the four standing committees (see below) and an executive director from the secretariat. The SC reviews and approves the high-level financial and programmatic agenda of WI. The sharing of members between the standing committees and the SC provides for a more open and transparent decision-making process. There are four programmatic standing committees: Technology; Science and Analytics; Communications; and Sustainability. Each of these committees, composed of individuals from the core partners, advisors and members of the camera trapping community at large, provides programmatic and strategic guidance to the SC and the secretariat on these thematic areas. Finally, a small secretariat office (currently at Conservation International) ensures the implementation of major programmatic and operational activities and guides collaborative fundraising activities among the partners.
Potential risks
Sharing location-based biodiversity data incurs potential risks, particularly for threatened species. The main risk is the perverse use of spatial information on threatened species by wildlife traffickers and poachers. WI aims to mitigate this risk by adopting a recent framework that provides a decision tree on whether or not biodiversity information should be published based on a cost–benefit assessment (Tulloch et al. Reference Tulloch, Auerbach, Avery-Gomm, Bayraktarov, Butt and Dickman2018). WI will maintain and periodically review a list of camera-trapped species that have been assessed as Critically Endangered (CR), Endangered (EN) or Vulnerable (VU) according to the latest version of the IUCN Red List and for which hunting and/or collecting have been identified as threats. WI will not make public the exact locations of camera traps that have recorded these species; instead, summary information at a coarse spatial scale will be shown. Individual data providers will have control over releasing this information to particular data users for legitimate uses if requested. Given the ubiquity of national and local red lists that extend IUCN’s global Red List, data providers will have the option of adding up to five additional species that are considered threatened or sensitive by local and national red lists. The locations of these species will also be obscured following the guidelines outlined for threatened species.
Posting images with humans also poses a privacy risk. Human images will be kept private to each data provider, will not be public and will include the ability to face blur and delete the images altogether. Finally, WI will use industry security standards to ensure data are safe and backed up regularly.
The future of Wildlife Insights and other shared data platforms
We envision WI as a long-lasting solution to a problem currently faced by camera trap and other passive sensor data, not as a regular science or conservation project. Given that the amount of wildlife and environmental data is growing at an unprecedented rate (Farley et al. Reference Farley, Dawson, Goring and Williams2018, Stephenson et al. Reference Stephenson, Brooks, Butchart, Fegraus, Geller and Hoft2017), WI’s success – and the success of existing and new shared data platforms – is strongly tied to its permanence, growth and continuity. Pathways to sustainability need to be found that go beyond external philanthropic funding.
WI requires a business plan to address this problem explicitly from the beginning. This plan needs to identify ways to generate revenue such as software as a service for certain types of users (e.g., companies and/or large companies), core partner contributions, multilateral and bilateral funding and interest-generating financial instruments. A sustainability strategy would allow WI to maintain core operating costs, grow and innovate while at the same time maintaining the platform as free of charge for most of its users.
To be successful, WI needs to demonstrate that timely and reliable data can be mainstreamed in the design and implementation of wildlife conservation programmes in a proactive, evidence-based approach. More importantly, it needs to show that this approach has impact on wildlife populations, helping to ensure their future conservation.
Acknowledgements
We thank the camera trap community at large for inspiring us to find better solutions to ensuring that their data are used to their maximum potential. We thank William McShea, who made important contributions to this paper, and Patrick Jansen, who was involved in the initial discussions around Wildlife Insights. We also thank Oliver Wearn and an anonymous reviewer for helpful comments on previous versions of the manuscript.
Financial support
We thank The Gordon and Betty Moore Foundation, Lyda Hill and Google for partial support of this work.
Conflict of interest
None.
Ethical standards
None.


