
Abstract
Although the pick-up/drop-off (PUDO) strategy in carpooling offers the convenience of short-distance walking for passengers during boarding and disembarking, there is a noticeable hesitancy among commuters to adopt this travel method, despite its numerous benefits. Here, this paper establishes a tripartite evolutionary game theory (EGT) model to verify the evolutionary stability of choosing the PUDO strategy of drivers and passengers and offering subsidies strategy of carpooling platforms in carpooling system. The model presented in this paper serves as a valuable tool for assessing the dissemination and implementation of PUDO strategy and offering subsidies strategy in carpooling applications. Subsequently, an empirical analysis is conducted to examine and compare the sensitivity of the parameters across various scenarios. The findings suggest that: firstly, providing subsidies to passengers and drivers, along with deductions for drivers through carpooling platforms, is an effective way to promote wider adoption of the PUDO strategy. Then, the decision-making process is divided into three stages: initial stage, middle stage, and mature stage. PUDO strategy progresses from initial rejection to widespread acceptance among drivers in the middle stage and, in the mature stage, both passengers and drivers tend to adopt it under carpooling platform subsidies; the factors influencing the costs of waiting and walking times, as well as the subsidies granted to passengers, are essential determinants that require careful consideration by passengers, drivers, and carpooling platforms when choosing the PUDO strategy. Our work provides valuable insight into the PUDO strategy’s applicability and the declared results provide implications for traffic managers and carpooling platforms to offer a suitable incentive.
1 Introduction
With the advancements in technology and the increasing convenience of mobile communication, shared lifestyles are gaining momentum and garnering widespread adoption globally. Specifically, carpooling represents a progressive method of shared lifestyle. Carpooling refers to the collaborative transportation arrangement in which several individuals share a vehicle to travel from separate origination points to their respective destinations, thereby completing at least a portion of their journey together [1]. Carpooling is widely recognized as a crucial system that effectively substitutes conventional taxi services, primarily due to its substantially reduced cost for commuters. Additionally, it holds the potential to alleviate traffic congestion pressures, thereby contributing to the efficient management of road networks [2]. Drivers who provide carpooling services tend to achieve more effective orders, alleviate idle time on the car, and reduce additional fuel consumption losses [3]. Regarding the convenience and potential benefits of carpooling, companies that offer this service, such as Didi and Uber, have gained popularity in numerous countries [4]. In this paper, these companies are regarded as carpooling platforms. An escalating number of carpooling platforms are giving due consideration to the environmental impact on society, acknowledging that the practice of carpooling fosters sustainable environmental development and effectively mitigates carbon emissions [5].
However, an excessive number of diversions results in a reduced rate of carpool matching and an upsurge in unoccupied vehicles, thereby diminishing the proficiency of carpooling platforms to optimize their advantages. Based on research studies, the attainment of a market share ranging from 20%-50% (or conceivably higher) in the adoption of carpooling can yield a substantial improvement in mobility [6, 7]. Furthermore, carpooling platforms confront complex challenges regarding operational efficiencies, such as protracted passenger wait times and a significant proportion of carpool vehicles lying idle, amounting up to 41%, particularly in major metropolitan areas [8]. Simultaneously, despite the cost-effective and convenient nature of carpooling for both passengers and drivers, certain situations may lead to detours, as illustrated in Fig. 1(a). Adherence to the rigid practice of collecting and delivering passengers solely from their designated originating locations and endpoints can give rise to superfluous diversions. This conduct on the part of drivers frequently culminates in delays for other passengers, who embark from diverse locations, and additionally generates unwarranted fuel consumption for the drivers [9].

The process diagram of PUDO in the case of carpooling for three passengers
Mitigating detours problems lead to promoting an environmentally friendly society [10]. Hence, to further mitigate the issue of detours during carpooling, an investigation into the adoption of the Pick-up/Drop-off (PUDO) strategy has been conducted as detailed in the work [11]. This approach mandates that passengers partake in a brief perambulation prior to embarkation and after disembarkation from the transportation. The PUDO strategy represents a viable and expedient substitute for the detours commonly implemented in door-to-door transportation schemes. The available empirical evidence suggests that requiring passengers to undertake a brief walk of approximately one minute can yield notable benefits, including a substantial reduction in carpool rejections, exceeding 80%, and a reduction in vehicle travel time exceeding 10%. This solution can be represented graphically in Fig. 1(b). The PUDO strategy presents a more convenient and efficient transportation option for passengers, potentially resulting in reduced travel times compared to traditional taxi operations. For drivers, implementing PUDO points can effectively prevent extensive detours and increase the number of dispatch orders. Furthermore, the adoption of PUDO by carpooling platforms can provide additional benefits, including an improved success rate of carpooling, reduced carbon emissions, and increased environmental sustainability. Despite these advantages, passengers may exhibit reluctance to engage in additional walks due to a conflict between optimizing time utilization and cost savings within the context of PUDO carpooling, ultimately leading to reduced efficiency of carpooling matching. In response, carpooling platforms may consider providing subsidies to both passengers and drivers under their supervision. The key focus of this paper is to perform an extensive analysis of the intricate interrelation and probable conflicts between passengers, drivers, and carpooling platforms within the framework of carpooling systems.
Furthermore, taking into account the fact that the relevant participants exhibit relatively bounded rationality in their decision-making characteristics, this paper utilizes evolutionary game theory (EGT) as an analytical tool to assess the decision-making process regarding the adoption of the PUDO strategy and the provision of subsidies in carpooling problems. The replicator dynamics (RD) equations are employed to examine the stability of strategies, and those with stable Nash Equilibrium points are recognized as evolutionarily stable strategies (ESS). Although the use of the PUDO strategy has been widely recognized as a viable solution for mitigating transportation issues like detours and congestion to some extent, there is a lack of research focusing on the necessity of promoting the PUDO strategy. Particularly, the examination of decision-making challenges and interdependencies among the three stakeholders involved in the carpooling system using EGT methodology remains underexplored.
The motivation of this paper is to assess the influence of the PUDO strategy on the entire carpooling system and elucidate the importance of the subsidy mechanism provided by carpooling platforms. With appropriately chosen parameters, the simulation results possess a certain degree of representativeness. The findings can provide practical implications for transportation managers and stimulate further research in this field.
Hence, in order to accomplish these objectives, we systematically solve the following 3 questions both theoretically and empirically within our study:
-
1)
Would the adoption of the PUDO strategy by passengers and drivers become an ESS in the decision-making process of carpooling?
-
2)
Additionally, would factors such as passenger walking time and driver waiting time serve as significant determinants influencing the establishment of the PUDO strategy as an ESS?
-
3)
Should carpooling platforms provide subsidies to passengers and drivers as an incentive for promoting the PUDO strategy? If so, would the act of offering subsidies by carpooling platforms become the ESS of the carpooling system?
The structure of this paper is as follows: Section 2 presents the related literature review focusing on the carpooling problem with PUDO strategy and the implication of applying EGT. Section 3 designs a tripartite evolutionary game model for determining the ESS points aimed at proving the feasibility of the PUDO and offering subsidies strategy. The findings of the model and precise ESS points are analyzed. Section 4 examines dynamic evolutionary paths and parameters sensitivity analysis to focus on passengers’ and drivers’ PUDO strategy evolutionary tendency and carpooling platforms’ offer subsidies strategy over a specific time. Section 5 concludes this paper and provides future prospects.
2 Literature review
This section elucidates the current literature regarding the PUDO strategy in carpooling systems and the application of the EGT approach.
2.1 Carpooling problem with PUDO
The elaboration of smartphone and wireless communication technologies has boosted the evolution of sharing economy [12]. Regarding transportation systems, carpooling services are increasingly prevalent. The potential market for carpooling among private car owners is driven by environmental sustainability considerations. Therefore, an analysis of carpooling patterns in Dublin has been undertaken [13]. Except for data analysis of carpooling commuters, some competitive algorithms are explored for improving the carpooling problems. An exact algorithm is proposed for the join-based carpooling, which has an aptitude for removing myriad invalid pairs that avoid computing their shortest routes [14]. Besides, scholars put forward an online dynamic insertion algorithm with demand forecasts to assign decisions for vehicles [15].
Scholars are also keen on resolving carpooling challenges through the establishment of meeting points, in addition to utilizing algorithms to address vehicle requisites. The carpooling problem with the PUDO strategy in terms of the pros and cons of their solutions are summarized in Table 1.
2.2 Previous study of EGT
Evolutionary game dynamics, as a combination of multidisciplinary research, has been widely applied in mathematics, biology, sociology, economics, politics, psychology, computer science, artificial intelligence, etc [20, 21]. Many scholars research decision-making problems based on the tripartite evolutionary game. The ecological benefits are analyzed among upstream, downstream, and central governments by constructing a tripartite evolutionary game model [22]. The result encourages the central government to supervise as well as focus on the composition of opportunity costs and the subject, object, and standard of watershed ecological compensation. The paper [23] presents a tripartite evolutionary game model among the government, the recycler, and the consumer in the E-waste recycling industry. According to the analysis results, this paper analyzes three stages, and the government is advised to play a crucial role in the E-waste recycling field. Meanwhile, a tripartite evolutionary game model is established based on regulatory agencies, renewable energy companies, and power grid companies to explore the evolution of the Feed-in Tariff and Renewable Portfolio Standard (RPS) [24]. A tripartite collaboration is constructed based on an evolutionary game model among government, industry, and university [25]. They analyze strategic conflict for three parts of participants. A tripartite evolutionary game model of shared manufacturing is proposed among manufacturing companies and the government. It is imperative that the optimization of utilization efficiency plays a pivotal role in fostering collaborative manufacturing and facilitating governmental oversight of manufacturing enterprises [26].
As for applying tripartite EGT on transportation, scholars propose an evolutionary game-theoretic method with a third-party service provider (3PSP) to identify the self-operation mode as an evolutionarily stable strategy. The model chooses an optimal sourcing strategy to maximize profit [27]. The analysis of railroad transportation operations is approached through the establishment of a tripartite evolutionary game model, in which the impact of government initiatives and other pertinent factors are examined, and their corresponding trends are thoroughly discussed [28].
EGT differs from traditional game theory in that it embraces the concept of “bounded rationality” among participants. During the learning and imitation process, each individual adjusts their strategy choices through continuous trial and error, aiming to find the optimal strategy combination [29]. Participants in carpooling, such as passengers and drivers, typically choose strategies based on their own experiences and benefits. EGT provides a framework to simulate and analyze the evolution of participant strategies, predicting the outcomes resulting from interactions among different strategies. As participants in the carpooling system pursue their own interests, EGT helps identify which strategies exhibit evolutionary stability. By analyzing the evolutionary outcomes between different strategies, stable strategies can be identified, offering insights into the direction in which the system will evolve.
The implementation of PUDO points in carpooling systems has been advocated by numerous scholars as an effective approach to address transportation challenges. However, existing studies have primarily focused on strategic planning and matching algorithms, overlooking the essential aspects of the attitudes and relationships among drivers, passengers, and carpooling platforms in the PUDO strategy. In addition, we propose the inclusion of subsidies as a behavior in carpooling systems. Thus, this paper aims to bridge this gap by utilizing the tripartite EGT methodology to explore the relationship among these three participants and provide insights for decision-making regarding the PUDO strategy.
3 Tripartite EGT carpooling model
This section commences by introducing the conceptual framework of the tripartite EGT carpooling model. Subsequently, it puts forth the underlying assumptions and notations grounded on the aforementioned model. Lastly, the tripartite EGT carpooling model is comprehensively examined from the perspectives of the RD system and ESS.
3.1 Framework of tripartite EGT carpooling model
This paper aims to solve the decision-making problem of passengers’ and drivers’ PUDO strategy and carpooling platforms’ offer subsidies strategy. Carpooling platforms offer services to both passengers and drivers by dispatching orders. As such, the three parties involved in carpooling (namely drivers, passengers, and carpooling platforms) are considered interdependent and bounded rational groups in a carpooling system with the PUDO strategy, whereby the information they receive is incomplete, and they learn through interaction with one another. Imperfectly rational decision-making is evident in the selection of PUDO by passengers and drivers, as they often fail to account for the decisions of other participants in the carpooling process. Additionally, there is a lack of consensus on whether carpooling platforms should offer subsidies. Furthermore, it can be argued that carpooling platforms themselves exhibit imperfect rationality. Thus, employing the EGT framework is appropriate for investigating the dynamic changes in strategies and factors that influence decision-making in this context.
The proposed framework employs a tripartite EGT model to examine the decision-making dynamics involved in the PUDO strategy. Specifically, the framework examines the relationship between passengers and drivers for choosing PUDO strategy and carpooling platform strategy with respect to the provision of subsidies. The details are displayed by four steps as follows:
Step 1: Setting assumptions and notations in a tripartite EGT carpooling model.
Step 2: Designing payoff matrices for passengers, drivers, and carpooling platforms for PUDO strategy and subsidies strategy.
Step 3: Based on the payoff matrices, the replicator dynamic mechanism is employed to stimulate the three parties’ learning and dynamic adjustment processes in the carpooling system.
Step 4: The stability of passengers and drivers’ choice of PUDO strategy and offering subsidies strategy of carpooling platforms is proved by obtaining ESS points.
3.2 Assumptions and notations setting in tripartite EGT carpooling model
In order to describe the carpooling problem with PUDO strategy based on tripartite EGT, the assumptions are set up as follows:
-
a.
The populations of passengers, drivers, and carpooling platforms are decision-making participants which are of bounded rationality in proposed tripartite EGT. They can be denoted as: passengers (\(T=1\)), drivers (\(T=2\)), carpooling platforms (\(T=3\)).
-
b.
The carpooling request is successfully matched if passengers or drivers choose PUDO strategy.
-
c.
The carpooling platforms have permission to offer subsidies to drivers and passengers.
-
d.
The passengers have two strategies: “choose PUDO” (\(i=1\)) or “reject PUDO” (\(i=2\)). The drivers have two strategies: “choose PUDO” (\(i=1\)) or “reject PUDO” (\(i=2\)). The carpooling platforms have two strategies: “offer subsidies” (\(i=1\)) or “not offer subsidies” (\(i=2\)).
In summary, the strategy set can be described as \(S={S_{i}^{T}}={(S_{1}^{1}, S_{2}^{1}), (S_{1}^{2}, S_{2}^{2}), (S_{1}^{3}, S_{2}^{3})}\), the probabilities of passengers choosing two different strategies with mathematical representation are: \(S^{1}_{1}=x\) (\(x\in [0,1]\)), \(S^{1}_{2}=1-x\) (\(x\in [0,1]\)). The probabilities of drivers choosing two different strategies with mathematical representation are \(S^{2}_{1}=y\) (\(y\in [0,1]\)), \(S^{2}_{2}=1-y\) (\(y\in [0,1]\)). The probabilities of carpooling platforms choosing two different strategies with mathematical representation are \(S^{3}_{1}=z\) (\(z\in [0,1]\)), \(S^{3}_{2}=1-z\) (\(z\in [0,1]\)).
Figure 2 illustrates the specific relationship in terms of carpooling platforms, drivers, and passengers on decision-making in the carpooling system with the PUDO and subsidies strategy. Before designing the payoff matrices, it is necessary to identify benefits and influencing factors for the three parties. m denotes drivers’ income as they complete each carpooling order. m is influenced by both carpooling rating \(\chi _{r}\) and constant fee η which is paid by carpooling passengers. Eq. (1) represents m quantitatively [30].
The variable \(C_{f}\) denotes the reduction in fuel consumption attributable to drivers’ choosing the PUDO strategy, resulting in a decrease in detours. By utilizing this strategy, drivers can typically accommodate additional passengers without deviating from their planned route, which in turn, reduces fuel consumption associated with detours [31]. The variable \(C_{f}\) is linked to a linear relationship denoted by \(R_{v}\), which exists between vehicle weight and fuel consumption. Additionally, it is dependent on several other factors, including the average number of passengers per carpooling car denoted as \(N_{v}\), the average number of additional passengers per vehicle represented by \(\Delta N_{v}\), and the requirement for an additional detour denoted by \(\alpha _{v}\). When \(\alpha _{v} = 0\), there is no need to increase the number of passengers per carpooling car to travel additional distances, and passenger miles in the same vehicle are represented by \(M_{V}\). Furthermore, \(C_{f}\) is also influenced by the average fuel economy of carpooling cars, which is denoted by \(F_{v}\). Eq. (2) is presented to represent \(C_{f}\) using the aforementioned parameters.

Schematic diagram of the decision-making interest relationship among passengers, drivers, and carpooling platforms
Additionally, the time spent when drivers and passengers hesitate to choose PUDO strategy can be seen as a sunk cost \(C_{z}\) [32], which is related to exogenous variables ϵ that influence the relative cost of being a passenger or a driver. As well as the fixed travel time l for each PUDO point, and the operation (involving hesitation) cost denoted by μ [30]. \(C_{z}\) can be quantified as Eq. (3):
For carpooling platforms, there are some unavoidable operating costs. However, developing PUDO strategy can be beneficial to environmental sustainability [10] which can take other reputation benefits for carpooling platforms. Carpooling platforms have the right to conduct a salary deduction of P to drivers due to non-environmental carbon emissions [33]. The salary deduction from carpooling platforms P has closely related to the fuel consumption rate \(F_{r}\) and CO2 emission rate \(C_{r}\) and pollution ratio γ. In detail, P is denoted by Eq. (4):
During periods of heavy traffic or inclement weather, utilizing carpooling services can provide significant convenience benefits to passengers who adopt the PUDO strategy. These benefits denoted as n can be quantified by the product of two variables: unit time α and carpooling rating \(\chi _{r}\) [30]. Specifically, the quantitative expression for n is given by Eq. (5).
Carpooling platforms are required to cover the operational expenses (\(C_{g}\)) associated with establishing and implementing the PUDO strategy. These expenses may include but are not limited to, costs related to developing and maintaining the platform’s technological infrastructure and managing logistics associated with coordinating PUDO locations. It is essential for carpooling platforms to factor in these costs when designing their PUDO strategy and determining their pricing structure, to ensure the sustainability of the program in the long term. Simultaneously, carpooling platforms stand to gain from the environmentally sustainable mode of transportation R and the order’s income (F) that the PUDO strategy provides [34]. For drivers, waiting time cost \(C_{d}\) when they choose the PUDO strategy may be the main factor. Additionally, the subsidy for drivers by the carpooling platform is denoted as \(S_{1}\). This study focused on thoroughly investigating the time cost (which includes wait and walk costs) and expected subsidies provided to passengers who choose the PUDO strategy, denoted as \(C_{p}\) and \(S_{2}\), respectively. In order to clarify the factors (\(C_{d}\), \(C_{p}\), and \(S_{2}\)) that contribute to the consolidation of the PUDO strategy, we have formulated a relevant survey questionnaire to facilitate the parameterization of variables. The open-source repository contains all the survey questions and collected dataFootnote 1. The model variables’ notations achieved in the tripartite EGT carpooling model are elaborated in Table 2.
By doing so, we aim to better understand the factors that impact the successful implementation of the PUDO strategy and to advance the existing body of knowledge in this area. Our research approach is guided by a rigorous and systematic methodology that ensures the validity and reliability of our findings.
Table 3 shows the payoff matrix of the three parties implementing subsidies strategy by carpooling platforms.
Table 4 shows the payoff matrix of the three parties without implementing subsidies strategy by the carpooling platforms.
3.3 Tripartite EGT carpooling model analysis
Based on the previous tripartite EGT carpooling model definitions, assumptions, notations, and payoff matrices, this paper presents the replicator dynamic equations in this section to obtain the Nash equilibrium points. Then, it analyzes the stability of Nash equilibrium points by using the Jacobian matrix. The parameters x, y indicate the proportions of passengers and drivers choosing PUDO strategy, and z means the probability of carpooling platforms offering subsidies for passengers and drivers. \(\pi _{mn}\) represents the expected payoffs of the three parties selecting different strategies.
3.3.1 Replicator dynamic system in the tripartite EGT carpooling model
With the framework of the proposed EGT, the payoffs of passengers, drivers, and carpooling platforms when they choose different strategies are expounded as follows:
For passengers, the payoff when choosing PUDO strategy is represented as \(\pi _{11}\), and the payoff when rejecting PUDO strategy is represented as \(\pi _{12}\):
The replicated dynamic equation of passengers is given in Eq. (8):
For drivers, the payoff when choosing PUDO strategy is represented as \(\pi _{21}\), and the payoff when rejecting PUDO strategy is represented as \(\pi _{22}\):
The replicated dynamic equation of drivers is given in Eq. (11):
For the carpooling platforms, the payoff of offering subsidies for passengers and drivers is represented as \(\pi _{31}\), and the payoff when not offering subsidies is represented as \(\pi _{32}\):
The replicated system dynamic equation of the carpooling platforms is presented in Eq. (14):
3.3.2 Evolutionary stable strategies in the tripartite EGT carpooling model
In the EGT, the primary focus of the analysis is on the examination of the dynamic alterations in probabilities that occur when one player adjusts their strategy in response to changes in the game. The player’s learning ability is usually reflected by the replicator dynamics, which identifies the rate of dynamic change. Clearly, Eq. (8), Eq. (11), and Eq. (14) compose the replicator dynamic system. The stable state of the system can be obtained as follows when the replication dynamic equations equal 0.
As a consequence, the equilibrium points can be calculated when \(F(x)=0\), \(F(y)=0\), and \(F(z)=0\) they are: \(E_{1}(0,0,0)\), \(E_{2}(1,0,0)\), \(E_{3}(0,1,0)\), \(E_{4}(0,0,1)\), \(E_{5}(1,1,0)\), \(E_{6}(1,0,1)\), \(E_{7}(0,1,1) \), \(E_{8}(1,1,1)\) and \(E_{9}(x^{*},y^{*},z^{*})\), \(x^{*}\in [0,1]\), \(y^{*}\in [0,1] \) and \(z^{*}\in [0,1] \). The stable point obtained by replicating the dynamic equation must be strictly in a pure-strategy Nash equilibrium. Since \(E_{9}\) is a mixed-strategy Nash equilibrium, it cannot be a stable point [35]. Therefore, this paper determines the stability of the other eight equilibrium points.
In this paper, Lyapunov’s system stability theory [36] is introduced to define the stability of equilibrium points. To prove the stability of these equilibrium points and then filter the ESS, the Jacobian matrix [37] of the system can be described based on the paradigm of Jacobian matrix in Eq. (17):
The Jacobian matrices can be obtained by calculating the replicated dynamic system. The eight Jacobian matrices are provided in Eqs. (18)-(25):
The eigenvalues of the Jacobian matrix can be used to determine the stability of the equilibrium points. The eigenvalues calculated by the Jacobian matrix are listed in Table 5.
According to Lyapunov’s stability criterion, \(E_{1}\), \(E_{3}\) and \(E_{8}\) can be known as stable by adding three groups of constraints. The specific constraints are calculated in Eqs. (26)-(28):
When \(n-C_{p}+C_{z}<0\) and \(m-C_{d}-C_{f}+C_{z}<0\), it means the benefits and convenience of passengers when completing orders are less than time cost and hesitant sunk costs of passengers. At the same time, the sum of income and hesitant sunk costs of drivers are less than the drivers’ excess fuel consumption and time cost when they choose PUDO strategy. Point \((0,0,0)\) is the ESS point of the system in this case which represents passengers and drivers rejecting PUDO strategy, carpooling platforms do not plan to offer subsidies. The strategy space is {reject PUDO, reject PUDO, not offer subsidies}. When \(R+P-S_{2}-C_{g}<0\), it implies the additional benefit and drivers’ deduction of remuneration for carpooling platforms is less than the subsidies for passengers from carpooling platforms and the operating cost of platforms. Moreover, the equilibrium point \((0, 1, 0)\) is stable, the strategy space of three parties is {reject PUDO, choose PUDO, not offer subsidies}, this phenomenon implies advantages of the PUDO strategy for drivers in carpooling process. When \(C_{p}-S_{2}<0\) and \(S_{2}+S_{1}+C_{g}-R<0\), it reveals that the walking time costs of passengers are less than the subsidies for passengers from carpooling platforms and the subsidies expenditure of carpooling platforms. In both situations, \((1,1,1)\) is the stable equilibrium point. The strategy space of passengers, drivers and carpooling platforms is {choose PUDO, choose PUDO, offer subsidies}. This situation is also positive to promote the success rate of carpooling. Moreover, it is the best solution in the proposed carpooling system [11].
4 Simulation of EGT carpooling model and empirical analysis
The empirical analysis is a scientific method that not only offers a quantitative explanation of current circumstances, but also involves a meticulous examination of data obtained from a questionnaire and a thorough assessment of relevant antecedent studies to determine parameter values. The applicability and accuracy of the model are further tested through empirical analysis. This paper considers the empirical analysis with previous research and the aforementioned questionnaire. Additionally, sensitivity analysis of various parameters can offer valuable insights into the management implications of the research problem based on the empirical analysis. Moreover, this section simulates the passengers, drivers, and carpooling platforms’ dynamic evolutionary path of the replicator system and explores ESS points in the carpooling system.
4.1 Initial data and parameters
Considering the process of carpooling, each driver receives an expected income of m. From the investigation [30], \(\eta = 4.6\) CNY/passenger, carpooling ratio \(\chi _{i}=2\) passengers. Thus, the drivers’ expected average income is \(m=9.2\) CNY. In the study [38], drivers’ wait time \(C_{d}\) is estimated when they pick up passengers. The estimated average \(C_{d}\) is 3.74 minutes. The fuel savings associated with an increase in carpooling can be estimated using a mathematical model [31]. Increasing vehicle occupancy without increasing travel can result in fuel savings \(C_{f}\). we get \(C_{f}\) is 4.26 CNY. Following the studies [39] and [40], we get \(\mu =14\), \(l=0.5\), \(C_{z}=2.4\) minutes. In addition, \(\alpha =5.5\), passengers’ convenience, and benefits to take a carpooling can be calculated as \(n=1.92\) minutes [30]. [41] and [33] imply \(F_{r}=8\%\), \(C_{r}=3.1\) CNY/L, \(\gamma =1\) L/order. The average passenger’s wait and walk time cost \(C_{p}\) and expected subsidies \(S_{2}\) provided by carpooling platforms is 2.37 minutes and 2.88 CNY in our questionnaireFootnote 2, respectively. Additionally, we assume subsidies \(S_{1}\) provided by carpooling platforms for drivers is 1 CNY.
Simulation of the dynamic evolutionary trajectory of the evolutionary system is performed in Matlab 2020a software to verify the accuracy of model consequences and render dynamic evolution trends more clearly and concisely.
4.2 Simulation of dynamic evolutionary paths of decision-making strategy in carpooling system
In order to identify the EGT carpooling model’s precision, this subsection simulates drivers, passengers, and carpooling platforms’ behavior dynamic evolutionary paths to depict the dynamic evolutionary trajectories of the passengers’ and drivers’ PUDO strategy and carpooling platforms’ offering subsidies strategy. The evolutionary game paths are obtained by using numerical simulation of the probabilities of the game subject’s choices of strategies in each case.
Followed by Table 6, the ESS under three satisfied constraint cases can all converge after simulation, and the evolution paths are depicted by distinct colored lines, as illustrated in Fig. 3. In Case 1, when the advantages and convenience experienced by passengers upon completing orders are overshadowed by the time cost and hesitant sunk costs incurred. Meanwhile, the combined income and hesitant sunk costs of drivers fall short of their excessive fuel consumption and time cost when opting for the PUDO strategy. Under these circumstances, the evolutionary trajectory will ultimately converge toward the ESS of \((0,0,0)\), aligning with the model analysis. In Case 2, the incremental benefit and drivers’ remuneration deduction from carpooling platforms are outweighed by the subsidies provided to passengers and the operational costs incurred by the platforms. In such circumstances, the evolutionary trajectory will ultimately converge toward the ESS of \((0,1,0)\), consistent with the model analysis. In Case 3, the time costs incurred by passengers for walking are outweighed by the subsidies provided to passengers by carpooling platforms and the subsidy expenditure of the platforms. Given these circumstances, the evolutionary trajectory will ultimately converge toward the ESS of \((1,1,1)\), in accordance with the findings of our model analysis.

Dynamic evolutionary paths of the system under different ESS. The lines of different colors represent the trajectories of participants’ strategies evolving from the initial point to the endpoint. The starting point is defined as \((0, 0, 0)\), while the most densely clustered point corresponds to the final converged endpoint
4.3 Sensitivity analysis of different parameters for three participants
Numerical simulation is conducted to test the robustness of the proposed tripartite EGT model to determine the ESS points academically. In this paper, the meaning of ESS is that the strategy of decision-making participants will not change in light of changes in time and values simulation. Simulated results are divided into three categories based on correlations among passengers, drivers, and carpooling platforms. This paper takes case 3 with the condition in Table 6 as an example.
4.3.1 The sensitivity analysis for passengers
-
1)
Impact of walking time cost of passengers (\(C_{P}\)) by PUDO strategy on ESS.
The variable \(C_{p}\) is influenced by the setting of PUDO points taken charge of by carpooling platforms. The reasonable setting of PUDO points can effectively avoid passengers spending extra waiting time costs. When \(C_{p}\) changes, the ESS changes consequently. Figure 4(a) shows how ESS changes with \(C_{p}\) by changing \(C_{p}\) as the different values: 0.87, 1.37, 1.87, 2.37, and 2.87. As the value of \(C_{p}\) increases, the behavior of passengers evolves faster and approaches the ESS point – 1 gradually. Figure 4(a) depicts a phenomenon that the convergence rate of passengers tends to choose PUDO behavior accelerates as the walking time of passengers decreases. Upon reaching a total time cost threshold of 2.37, which encompasses the combined duration of both passenger wait time and walking time, the ultimate PUDO strategy will no longer maintain its dominant position (with a probability significantly less than 1). The probability of passengers selecting for the PUDO strategy is contingent upon the efficacy of the PUDO mechanism’s design, as well as a reduction in walking time costs. Improving the latter can amplify the chances of PUDO being selected as the preferred transportation mode.
Figure 4 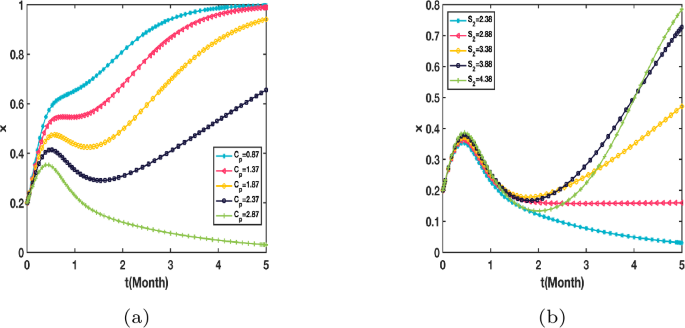
The sensitivity of independent values for passengers
-
2)
Impact of the subsidies for passengers by carpooling platform (\(S_{2}\)) on ESS.
The variable \(S_{2}\) can be interpreted as a discount provided by carpooling platforms to incentivize passengers. To evaluate the impact of subsidies on passenger preference for PUDO strategy via carpooling platforms, a sensitivity analysis is conducted by manipulating the value of \(S_{2}\) from its default initial value 2.88 to 2.38, 3.38, 3.88, and 4.38. In Fig. 4(b), as the magnitude of the variable \(S_{2}\) increases, the likelihood of passengers opting for the PUDO strategy initially diminishes, followed by a subsequent resurgence. Notably, when \(S_{2}\) falls below 3.38 CNY, the PUDO strategy ceases to represent an ESS. The adoption of the PUDO strategy is observed to steadily decline in response to inadequate passenger subsidies offered by carpooling platforms. This trend is indicative of a waning interest among passengers toward choosing the PUDO option.

4.3.2 The sensitivity analysis for drivers
-
1)
Impact of drivers’ deduction of remuneration when rejecting PUDO strategy from carpooling platforms (P) on ESS.
Figure 5(a) depicts that as drivers’ deduction of remuneration resulting from non-environmental carbon emissions increases, the rate of choosing the PUDO strategy accelerates. It can be discovered the sensitivity of the deduction to drivers from carpooling platforms by changing P as the different values: 0.248, 1.248, 2.248, 3.248, and 4.248. As the value of P increases, the behavior of passengers evolves faster and approaches the ESS point – 1 gradually. It is recommended to implement the deduction that is proportionate to the environmental impact resulting from non-adherence to the PUDO strategy by drivers on the platform, with the aim of incentivizing compliance. Furthermore, it is advisable to undertake measures that significantly increase the likelihood of drivers adopting the PUDO strategy.
Figure 5 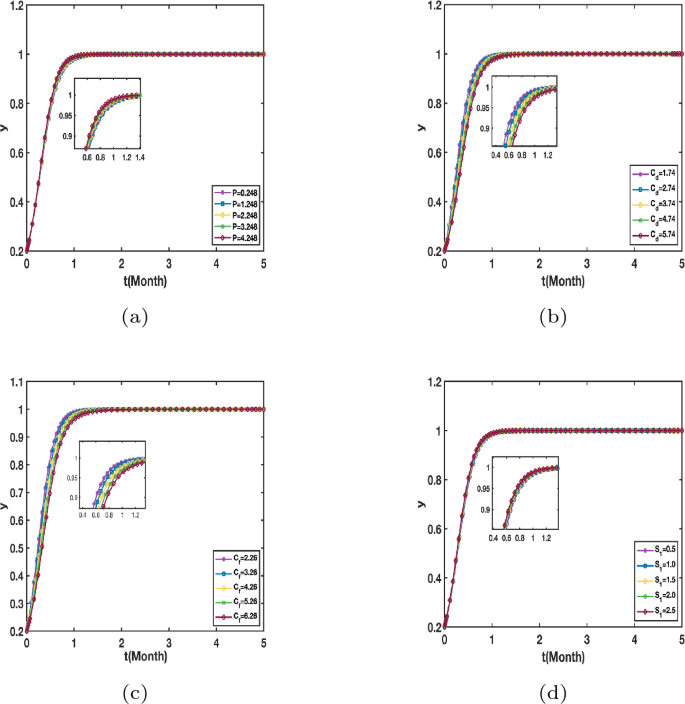
The sensitivity of independent values for drivers
-
2)
Impact of the waiting time when choosing PUDO strategy for drivers (\(C_{d}\)) on ESS.
Figure 5(b) shows the sensitivity of the waiting time for drivers (\(C_{d}\)). Observations indicate that manipulating the value of \(C_{d}\) (specifically, values of 1.74, 2.74, 3.74, 4.74, and 5.74) does not significantly alter driver behavior. Notably, decreased wait times associated with selecting the PUDO strategy correspond to a higher likelihood of PUDO strategy adoption by drivers, approaching a probability of 1.
-
3)
Impact of the excess fuel consumption of drivers when they choose the PUDO strategy (\(C_{f}\)) on ESS.
Figure 5(c) depicts the excess fuel consumption sensitivity of drivers upon adoption of the PUDO strategy, as determined by variations in the \(C_{f}\) parameter values of 2.26, 3.26, 4.26, 5.26, and 6.26. The simulation results reveal a decrease in fuel costs with increasing attractiveness of the PUDO strategy, while the rate of convergence accelerates, leading to a more rapid stabilization of the system.
-
4)
Impact of the subsidies for drivers when choosing PUDO strategy provided by carpooling platforms on ESS.
Variations in subsidies for drivers provided by carpooling platforms (\(S_{1}\)) are analyzed through simulations employing values of 0.5, 1.0, 1.5, 2.0, and 2.5. Figure 5(d) illustrates that as the subsidies for the PUDO strategy increase, there is a corresponding increase in driver adoption of PUDO and acceleration in the rate of convergence. However, the effect of platform subsidies on driver selection of the PUDO strategy appears negligible, as indicated by the minimal changes observed in the figure.

4.3.3 The sensitivity analysis for carpooling platforms
-
1)
Impact of carpooling platforms’ deduction of remuneration to drivers when choosing PUDO strategy (P) on ESS.
Divers’ deduction of remuneration resulting from non-environmental carbon emissions increase is analyzed in Fig. 6(a), which examines the sensitivity of deduction income (P) on drivers from carpooling platforms. The simulation results indicate that as carpooling platforms impose greater deductions on drivers, the amount of deduction of remuneration generated for the platform also increases. The sensitivity of P is assessed using varying values of 0.248, 0.748, 1.248, 1.748, and 2.248. The simulation results reveal that, despite the probability of the platforms ultimately selecting subsidies remaining near 1, increasing the P value strengthens the rate at which the platform imposes subsidies. This observation suggests that carpooling platforms’ implementation of deduction of remuneration to drivers as incentives to adopt the PUDO strategy accelerates the platform subsidy strategy’s rate of reaching the ESS point without significantly modifying the final outcome.
Figure 6 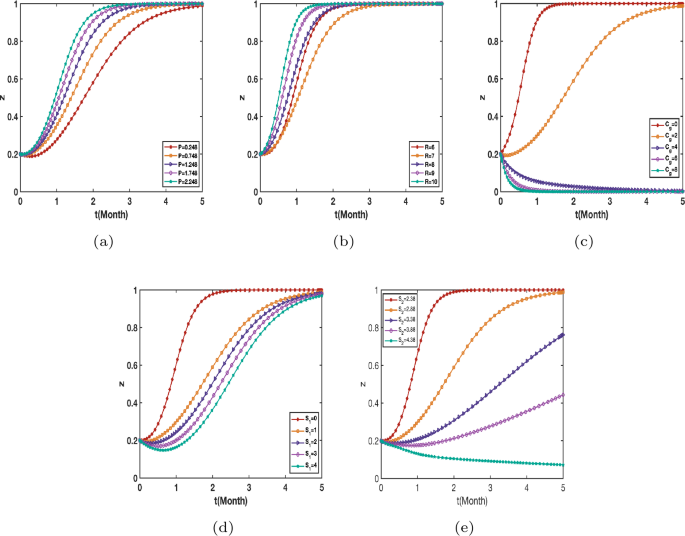
The sensitivity of independent values of carpooling platforms
-
2)
Impact of additional reputation environmental sustainability benefits for carpooling platforms (R) on ESS. The present study scrutinizes the impact of additional reputational environmental sustainability benefits on the subsidy strategies of carpooling platforms (R). Through a sensitivity analysis presented in Fig. 6(b), it was discovered that manipulating the value of R (6, 7, 8, 9, and 10) has a constructive influence on the carpooling platform’s behavior. As R escalates, the ESS convergence rate accelerates, and the platform displays an increased inclination to incentivize both passengers and drivers with subsidies. Such an outcome reinforces the stability and dominance of the PUDO strategy.
-
3)
Impact of operating costs of the platforms (\(C_{g}\)) on ESS.
It is anticipated that the introduction of PUDO strategy would entail operational costs for carpooling platforms to a certain degree. This assertion is validated by the portrayal of the sensitivity of platform operating costs (\(C_{g}\)) at varying values of 0, 2, 4, 6, and 8, as depicted in Fig. 6(c). Notably, a reduction in platform operating costs is positively associated with the probability of platforms providing subsidies to both drivers and passengers. In the event that the operational costs of the ride-sharing platform exceed the predetermined threshold of 4, the platform shall terminate the provision of subsidies designed to encourage the adoption of the PUDO strategy. Consequently, there is a heightened propensity among drivers and passengers to adopt the PUDO strategy.
-
4)
Impact of carpooling platform’s subsidies for drivers when they choose PUDO strategy (\(S_{1}\)) on ESS.
The sensitivity of the carpooling platform’s subsidies expenditure for drivers when choosing the PUDO strategy (\(S_{1}\)) is simulated by changing values as 0, 1, 2, 3, and 4. It can be considered that the subsidies provided by the platforms to drivers are regarded as a cost. Figure 6(d) illustrates that a reduction in the subsidy cost levied by the platform upon passengers leads to correspondingly greater feasibility of implementing the platform’s subsidy policy.
-
5)
Impact of carpooling platform’s subsidies for passengers when they choose PUDO strategy (\(S_{2}\)) on ESS
Figure 6(e) demonstrates the sensitivity of the subsidies provided by the carpooling platform to passengers who opt for the PUDO strategy. Herein, \(S_{2}\) is modulated through the values 1, 2, and 3. The graphical representation indicates that a decrease in \(S_{1}\) amplifies the platform’s propensity to offer subsidies to passengers, accelerates the rate of convergence, and leads to a trend toward an ESS point of 1. It is noteworthy that if the cost borne by the carpooling platform to passengers surpasses 3.38, there is a likelihood of a reduction in the probability of the platform’s subsidy strategy.

4.4 Discussions on simulation results
This subsection provides a comprehensive examination of the outcomes resulting from the ESS analysis and sensitivity simulation, which are relevant to the three parties (passengers, drivers, and carpooling platforms) engaged in carpooling operations. The analysis is conducted in line with the carpooling enterprise strategy life cycle, with a view to providing a comprehensive understanding of the intricacies of the subject [23, 42], the decision-making process of PUDO and offering subsidies strategy consists of three stages: initial stage, middle stage, and mature stage.
-
1)
During the initial stages of implementing the PUDO strategy, a lack of awareness about the strategy among both passengers and drivers results in limited adoption. Carpooling platforms also faced uncertainty about the benefits of offering subsidies to promote the PUDO strategy, leading to reluctance in taking this step at the outset. Moreover, passengers incurred costs in terms of walking and waiting time cost and sunk costs due to their hesitation, which may outweigh the eventual benefits and convenience. In addition, drivers who choose the PUDO strategy face significantly lower profits and sunk costs compared to those who choose to follow a strategy that restricts them from completing orders. The evolutionary ESS trends of passengers, drivers, and carpooling platforms converge towards \((0,0,0)\). Given these assumptions, it can be inferred that the strategy set of reject PUDO, reject PUDO, not offer subsidies harms the consummation of carpooling.
-
2)
During the middle stage of PUDO strategy implementation, carpooling platforms face a substantial increase in operating expenses due to the provision of subsidies to passengers. The outlay of operating costs and subsidies overshadows the additional benefits and the deduction of remuneration from drivers that the platform derives, leading to a reduction in the overall profitability of the PUDO strategy. Consequently, the evolutionary ESS of the system shifts towards point \((0,1,0)\), where carpooling platforms adopt the PUDO strategy, but do not provide any subsidies to passengers. Under this circumstance, the relevant strategy space for the system becomes reject PUDO, choose PUDO, not offer subsidies. While rejecting the PUDO strategy exposes carpooling platforms to the risks of forgoing the strategy’s advantages, choosing the strategy with subsidies is unfeasible due to the high operating costs involved. Therefore, choosing the PUDO strategy without offering subsidies becomes the most optimal strategy for carpooling platforms. This shift in the ESS underscores the significance of a comprehensive cost-benefit analysis when implementing new initiatives such as PUDO. By making informed decisions based on a thorough assessment of the costs and benefits, carpooling platforms can maximize their profits and ensure the successful implementation of the PUDO strategy.
-
3)
In the mature stage, carpooling platforms face the challenge of overcoming the skepticism and hesitancy of both drivers and passengers towards this innovative approach. To surmount this obstacle, carpooling platforms have to develop stronger economic incentives that encourage drivers and passengers to adopt the PUDO strategy. The subsidies provided by the platforms to both drivers and passengers, in conjunction with operational costs, must exceed the costs associated with walking time, which is a factor in selecting the PUDO approach. In such circumstances, carpooling platforms are more inclined to provide subsidies, which causes the ESS of the system to shift to point \((1,1,1)\). The pertinent strategy space becomes choose PUDO, choose PUDO, offer subsidies. By adopting this strategy, carpooling platforms can attract a greater number of drivers and passengers to utilize the PUDO strategy, which will improve profitability and enhance convenience for passengers.
Based on the analysis of the PUDO strategy using the EGT model proposed in this study, there are several limitations and shortcomings that need to be further discussed and explored. Firstly, external market conditions and regulatory policies have not been incorporated into the model. These factors play a crucial role in shaping the carpooling landscape and can significantly influence the outcomes of the PUDO strategy. Ignoring these external influences may limit the applicability of the model to real-world scenarios. Secondly, cultural influences on decision-making processes and strategies have not been explicitly addressed. Cultural norms and preferences can vary across regions and can greatly impact individuals’ choices and behaviors in carpooling. Failing to account for cultural factors may limit the model’s ability to capture the nuances and variations in different contexts. Additionally, the model does not consider other important factors, such as technological advancements and infrastructure limitations. Advancements in technology, such as the availability of mobile applications or GPS tracking systems, can significantly enhance the efficiency and effectiveness of carpooling. On the other hand, infrastructure limitations, such as inadequate parking facilities or traffic congestion, can pose challenges to the implementation and success of the PUDO strategy. These factors should be taken into account to provide a more comprehensive understanding of the potential barriers and opportunities in carpooling systems.
5 Conclusions
Carpooling services have garnered widespread popularity globally, primarily due to their environmental-friendliness and convenience for passengers. The PUDO strategy is a novel and efficacious approach that aims to promote the use of carpooling, which is the focal point of this paper. This study delves into the intricate relationships among carpooling platforms, drivers, and passengers in the carpooling system with the PUDO strategy. The primary objective is to resolve the conflicts that arise due to carpooling platforms providing subsidies to passengers and drivers, the reluctance of passengers and drivers to adopt the PUDO strategy, and the inclination to prefer subsidies from carpooling platforms.
The most significant finding of this study is that the most effective strategy for achieving stability in the carpooling system is the ESS, which entails the adoption of the PUDO strategy by both passengers and drivers, coupled with subsidies offered by carpooling platforms. Additionally, this strategy enables the carpooling system to achieve a sustainable and desirable equilibrium state. Moreover, predicated on the time evolution and the enterprise strategy life cycle, the strategy process can be delineated into three distinct stages: the initial stage, the middle stage, and the mature stage. Furthermore, a series of sensitivity analyses are conducted for the three parties. The findings and results have significant implications for transportation managers and carpooling platform supervisors. Firstly, the platforms should offer appropriate subsidies to passengers and drivers as a reward for their adoption of the PUDO strategy. The subsidies provided should exceed the time cost incurred by them. Secondly, the platforms should create smaller intervals between PUDO points to reduce the walking time for passengers when choosing the PUDO strategy. Thirdly, the promotion of the PUDO strategy among drivers and passengers has crucial implications in mitigating traffic pressure and congestion.
The insights obtained from this study may prove beneficial in promoting the practical and robust development of the PUDO strategy in carpooling, thus enhancing the matching rate of carpooling and ultimately improving commuter travel. However, this study is constrained by the absence of comprehensive information on the underlying features of carpooling. Further studies could evaluate the long-term impact of the PUDO strategy and determine the correlation between carpooling parameters and the proposed approach. Nonetheless, future research could continue to investigate the decision-making relationship, conflicts, and interests involved in multiple strategies EGT or other game theory methodologies.
Availability of data and materials
Not applicable.
References
R.W. Hall, A. Qureshi, Dynamic ride-sharing: theory and practice. J. Transp. Eng. 123(4), 308–315 (1997)
F. Bachmann, A. Hanimann, J. Artho, K. Jonas, What drives people to carpool? Explaining carpooling intention from the perspectives of carpooling passengers and drivers. Transp. Res., Part F 59, 260–268 (2018)
J. Cramer, A.B. Krueger, Disruptive change in the taxi business: the case of Uber. Am. Econ. Rev. 106(5), 177–182 (2016)
Y. Dong, S. Wang, L. Li, Z. Zhang, An empirical study on travel patterns of Internet based ride-sharing. Transp. Res., Part C, Emerg. Technol. 86, 1–22 (2018)
X. Liu, H. Titheridge, X. Yan, R. Wang, W. Tan, D. Chen, J. Zhang, A passenger-to-driver matching model for commuter carpooling: case study and sensitivity analysis. Transp. Res., Part C 117, 102702 (2020)
D.J. Fagnant, K.M. Kockelman, Dynamic ride-sharing and fleet sizing for a system of shared autonomous vehicles in Austin, Texas. Transportation 45, 143–158 (2018)
C. Rodier, F. Alemi, D. Smith, Dynamic ridesharing: exploration of potential for reduction in vehicle miles traveled. Transp. Res. Rec. 2542(1), 120–126 (2016)
E. Brown, The ride-hail utopia that got stuck in traffic. Wall St. J. 15 (2020)
J. Wang, X. Wang, S. Yang, H. Yang, X. Zhang, Z. Gao, Predicting the matching probability and the expected ride/shared distance for each dynamic ridepooling order: a mathematical modeling approach. Transp. Res., Part B 154, 125–146 (2021)
S. Dinesh, G. Rejikumar, G.S. Sisodia, An empirical investigation into carpooling behaviour for sustainability. Transp. Res., Part F 77, 181–196 (2021)
A. Fielbaum, X. Bai, J. Alonso-Mora, On-demand ridesharing with optimized pick-up and drop-off walking locations. Transp. Res., Part C 126, 103061 (2021)
T. Puschmann, R. Alt, Sharing economy. Bus. Inf. Syst. Eng. 58(1), 93–99 (2016)
B. Caulfield, Estimating the environmental benefits of ride-sharing: a case study of Dublin. Transp. Res., Part D 14(7), 527–531 (2009)
N. Ta, G. Li, T. Zhao, J. Feng, H. Ma, Z. Gong, An efficient ride-sharing framework for maximizing shared route. IEEE Trans. Knowl. Data Eng. 30(2), 219–233 (2017)
M. Van Engelen, O. Cats, H. Post, K. Aardal, Enhancing flexible transport services with demand-anticipatory insertion heuristics. Transp. Res., Part E 110, 110–121 (2018)
M. Stiglic, N. Agatz, M. Savelsbergh, M. Gradisar, The benefits of meeting points in ride-sharing systems. Transp. Res., Part B 82, 36–53 (2015)
X. Li, S. Hu, W. Fan, K. Deng, Modeling an enhanced ridesharing system with meet points and time windows. PLoS ONE 13(5), 0195927 (2018)
L. Kaan, E.V. Olinick, The vanpool assignment problem: optimization models and solution algorithms. Comput. Ind. Eng. 66(1), 24–40 (2013)
R. Li, L. Qin, J.X. Yu, R. Mao, Optimal multi-meeting-point route search. IEEE Trans. Knowl. Data Eng. 28(3), 770–784 (2015)
M.A. Nowak, Evolutionary Dynamics: Exploring the Equations of Life (Harvard University Press, Harvard, 2006)
T.L. Vincent, J.S. Brown, Evolutionary Game Theory, Natural Selection, and Darwinian Dynamics (Cambridge University Press, Cambridge, 2005)
X. Gao, J. Shen, W. He, F. Sun, Z. Zhang, W. Guo, X. Zhang, Y. Kong, An evolutionary game analysis of governments’ decision-making behaviors and factors influencing watershed ecological compensation in China. J. Environ. Manag. 251, 109592 (2019)
Z. Wang, Q. Wang, B. Chen, Y. Wang, Evolutionary game analysis on behavioral strategies of multiple stakeholders in E-waste recycling industry. Resour. Conserv. Recycl. 155, 104618 (2020)
Z. Dong, X. Yu, C.-T. Chang, D. Zhou, X. Sang, How does feed-in tariff and renewable portfolio standard evolve synergistically? An integrated approach of tripartite evolutionary game and system dynamics. Renew. Energy (2022)
J. Wu, C. Che, Y. Sheng, L. Chen, Q. Shi, Study on government-industry-university-institute collaborative innovation based on tripartite evolutionary game. Chin. J. Manag. Sci. 27, 162–173 (2019)
P. Liu, X. Wei, C. Liu, Tripartite evolutionary game analysis of shared manufacturing by manufacturing companies under government regulation mechanism. Discrete Dyn. Nat. Soc. (2022) https://doi.org/10.1155/2022/7706727
W. Gu, M. Li, C. Wang, J. Shang, L. Wei, Strategic sourcing selection for bike-sharing rebalancing: an evolutionary game approach. Transp. Res., Part E 156, 102522 (2021)
X. Xu, Y. Yang, Tripartite evolutionary game of rail-road intermodal transport system under domination of government. J. Transp. Syst. Eng. Inf. Technol. 21(2), 7–15 (2021)
G. Szabó, G. Fath, Evolutionary games on graphs. Phys. Rep. 446(4–6), 97–216 (2007)
L. Zhong, K. Zhang, Y.M. Nie, J. Xu, Dynamic carpool in morning commute: role of high-occupancy-vehicle (HOV) and high-occupancy-toll (HOT) lanes. Transp. Res., Part B 135, 98–119 (2020)
S.H. Jacobson, D.M. King, Fuel saving and ridesharing in the us: motivations, limitations, and opportunities. Transp. Res., Part D 14(1), 14–21 (2009)
K. Steininger, C. Vogl, R. Zettl, Car-sharing organizations: the size of the market segment and revealed change in mobility behavior. Transp. Policy 3(4), 177–185 (1996)
T. Wu, Q. Shen, M. Xu, T. Peng, X. Ou, Development and application of an energy use and co2 emissions reduction evaluation model for China’s online car hailing services. Energy 154, 298–307 (2018)
T. Zhao, Z. Liu, A novel analysis of carbon capture and storage (ccs) technology adoption: an evolutionary game model between stakeholders. Energy 189, 116352 (2019)
D. Friedman, Evolutionary games in economics. Econometrica 59(3), 637–666 (1991)
A.M. Lyapunov, The general problem of the stability of motion. Int. J. Control 55(3), 531–534 (1992)
P.D. Taylor, L.B. Jonker, Evolutionary stable strategies and game dynamics. Math. Biosci. 40(1–2), 145–156 (1978)
R. Abe, Preferences of urban rail users for first-and last-mile autonomous vehicles: price and service elasticities of demand in a multimodal environment. Transp. Res., Part C 126, 103105 (2021)
C. Liu, W. Huang, C. Yang, The evolutionary dynamics of China’s electric vehicle industry–taxes VS. subsidies. Comput. Electr. Eng. 113, 103–122 (2017)
R. Ma, H. Zhang, The morning commute problem with ridesharing and dynamic parking charges. Transp. Res., Part B 106, 345–374 (2017)
X. Li, X. Ou, X. Zhang, Q. Zhang, X. Zhang, Life-cycle fossil energy consumption and greenhouse gas emission intensity of dominant secondary energy pathways of China in 2010. Energy 50, 15–23 (2013)
Y. Karpenko, I. Kuznetsova, A. Chykurkova, M. Matveyeva, O. Hridin, K. Nakonechna, Formation of the enterprise strategy based on the industry life cycle. J. Ind. Manag. Optim. 12(3), 262–280 (2021)
Funding
This work was funded by the National Natural Science Foundation of China under Grant Nos. 72171172 and 62088101, by the Shanghai Municipal Science and Technology, China Major Project under Grant No. 2021SHZDZX0100, by the Shanghai Municipal Commission of Science and Technology, China Project under Grant No. 19511132101.
Author information
Authors and Affiliations
Contributions
ZY: Conceptualization, Methodology, Visualization, Writing – original draft. LL: Supervision, Writing – review & editing. HZ: Supervision, Writing – review & editing. YM: Writing – review & editing. AY: Writing – review & editing. All authors read and approved the final manuscript.
Corresponding author
Ethics declarations
Competing interests
Prof. Li Li is an editorial board member for Autonomous Intelligent Systems and was not involved in the editorial review, or the decision to publish, this article. All authors declare that there are no other competing interests.
Additional information
Publisher’s Note
Springer Nature remains neutral with regard to jurisdictional claims in published maps and institutional affiliations.
Rights and permissions
Open Access This article is licensed under a Creative Commons Attribution 4.0 International License, which permits use, sharing, adaptation, distribution and reproduction in any medium or format, as long as you give appropriate credit to the original author(s) and the source, provide a link to the Creative Commons licence, and indicate if changes were made. The images or other third party material in this article are included in the article’s Creative Commons licence, unless indicated otherwise in a credit line to the material. If material is not included in the article’s Creative Commons licence and your intended use is not permitted by statutory regulation or exceeds the permitted use, you will need to obtain permission directly from the copyright holder. To view a copy of this licence, visit http://creativecommons.org/licenses/by/4.0/.
About this article

Cite this article
Yan, Z., Li, L., Zhao, H. et al. A tripartite evolutionary game analysis of providing subsidies for pick-up/drop-off strategy in carpooling problem. Auton. Intell. Syst. 3, 7 (2023). https://doi.org/10.1007/s43684-023-00053-7
Received:
Revised:
Accepted:
Published:
DOI: https://doi.org/10.1007/s43684-023-00053-7