
Abstract
Sidi El Barrak is a Tunisian earth dam of height 28 m; it was built in 1999 on a heterogeneous foundation that has a strong dominance of sandy formations. This dam covers an area of 896 km2 and receives about 260 Millions cubic meters of water per year. The foundation of the Sidi El Barrak dam was treated by vibro-compaction over the first 10 meters, to improve the relative density of upper sand layer against the liquefaction risk. Monitoring the behavior of the dam was assured against the hydraulic behavior and topographic auscultation. The recorded peak settlement at the crest level since July 3rd, 2003 until August 2015 was about 18.7 cm. In order to reproduce the behavior of the dam in terms of consolidation, a plane strain numerical model of the dam and soil foundation has been proposed. The simulation of dam behavior using the Mohr–Coulomb model for the material of dike and the sandy layer and by adopting the Soft Soil Model for clay layer led to predicted settlement almost in agreement with measured values. Three options of numerical computation were performed by adopting three constitutive laws of the constitutive materials of the dam and its foundation. The observed behavior of the dam during 15 years (up to date) was successfully predicted by the conducted numerical investigation.
Introduction
Monitoring the behavior of dams during their exploitation constitutes a vital task to detect abnormal behavior (disorders) and to predict their evolution in full life service. The question is to identify the origin of these disorders and to evaluate the stability of dams against some undesirable phenomena such as internal erosion, sliding, settlement of consolidation and liquefaction risk [12].
Several methods exist for the monitoring of dams: statistical methods of treatment monitoring measurements, functional analysis methods, expert approaches and methods based on physical modeling to predict the dam behavior by using of constitutive models of soils. These methods are used for dams to foreseen changes in their behavior. As examples worth mentioning, contributions by Fauchet [13] for the study of the evolution of cracks observed in a weight dam Ternay; the case history of Antinhiac [2] to study the behavior of Rockfill dams with respect to settlement by using a hydroplastic model.
Al Hussein [1] studied the earth dam Flumet (France) in regard to the consolidation process of the foundation by applying a creep soft soil model (SSCM). Bouassida et al. [4] and Karoui and Bouassida [14] focused on the pathology of foundation of Ghezala dam in regard to differential settlement by performing a plane strain modeling with the Plaxis 2D FE code. The observed behavior on site was fairly reproduced by the numerical predictions obtained by the Mohr–Coulomb model. Adopting the plane strain modeling Djebbi and Bouassida [11] investigated the pathology cases studies of Joumine and Sidi Saad Tunisian dams. Klai et al [15] investigated the soft soil model (SSM) to predict the behavior of Tunis soft clay. The observed on site movements of the dams were fairly predicted by performing numerical computations using the Mohr–Coulomb constitutive model for materials of the dike and foundations.
The stored water is mainly intended for agricultural activities in the region and to meet the demand for drinking water in the Great Tunis, Cap Bon, Sousse and Sfax by a transfer of the reservoir water to the Sejnane dam.
The construction of the Sidi El Barrak dam began on January 1st, 1995, and ended on September 1999, which was the date of first filling step of the reservoir of the dam. The normal storage level was reached in March 2001, that is to say 550 days after the first filling of the reservoir. The Ministry of Agriculture proceeded on July 3, 2003, for the installation of topographic markers on the crest and downstream berms of the dam 810 days after the filling up of reservoir. The first inspection of these markers begun on August 3, 2004, by recording the subsidence of the crest level that was of about 2.8 and 18.7 cm in August 2015. The recorded settlement after 4000 days at the elevation 16 m is of the order of 8.5 cm.
This paper investigates the project of Sidi El Barrak dam located in the North West of Tunisia (the governorate of Beja). This dam intercepts the Zouarâa River 18 km from the City of Nefza and 2 km from the Mediterranean Sea. Sidi El Barrak dam was built in the North Water Master Plan to enhance the Tunisian water mastery infrastructure. The dam is spread over an area of 400 hectares with a capacity of 265 million cubic meters of water and a normal retaining height 27 m.
Focuses is made on the study of behavior of the foundation of Sidi El Barrak earth dam in long-term conditions by performing numerical computation. The material characteristics of the foundation and the dam are determined from laboratory test results and in situ collected from the Ministry of Agriculture (BRGM/EDF [5–7]).
Different constitutive models are considered for the materials of earth dam and soil layers, to assess the behavior of the foundation in accordance with the observations and measurements on site during the past few years.
Geotechnical aspects of the foundation of Sidi El Barrak dam
The geological profile of the foundation of Sidi El Barrak dam is heterogeneous and variable both in depth and in plan. The area of the dam is formed by a series of quaternary soils, Neogene and Paleogene [3, 17]. The bedrock consists of Oligocene sandstone bed composed of clay and marl visible on the right bank. On the left bank Mio-Pliocene deposits formed by gravelly sand with clay lenses through which those Oligocene formations are encountered.
The geotechnical survey of the site of Sidi El Barrak dam comprised bore holes pressuremeter tests, and laboratory tests performed on undisturbed samples to identify the parameters of the constitutive materials of the foundation. After the results of laboratory tests, the foundation of Sidi El Barrak dam is composed of three formations. Soil parameters of those formations, i.e. stiffness, compressibility and shear strength, should be determined.
The soil profile of Sidi El Barrak dam is composed by the following formations:
-
A sand layer, characterized by a substantially uniform grain size distribution (Fig. 1) obtained at different depths. The classification is clean, well-graded without fines, geotechnical parameters summarized in Table 1.
Fig. 1 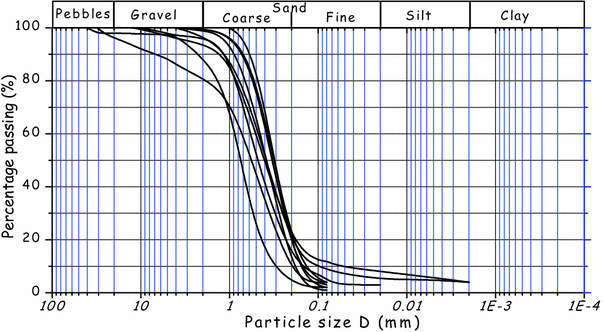
Grain size distributions of upper sand formation of the foundation of Sidi El Barrak dam
Table 1 Physical characteristics of the sands of the foundation of Sidi El Barrak dam -
Figure 2 displays the Atterberg limits of the clay layer underneath the sand formation, classified as very plastic clay, located at different depths throughout the allocated area for the construction of the Sidi El Barrak dam. This clay layer has a low to medium percentage of organic matter (0.4–16%) averaged to 8%. Oedometer tests and pressuremeter data allowed classifying this clay layer with three levels of consistency: stiff clays, fairly consistent and somewhat consistent. The little consistent and compressible clays were located mainly in the area of the bed river. The averaged mechanical characteristics obtained from consolidated drained triaxial tests are a drained cohesion of the order of 10 kPa and a drained friction angle equal to 21°, which confirms that the clay layer underneath the sand formation is over-consolidated.
Fig. 2 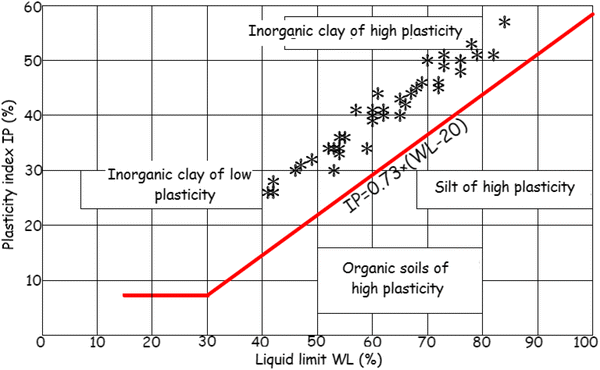
Atterberg limits of the clay layer of foundation of Sidi El Barrak dam
-
The third layer alternates sandy clay and clayey sand. In the bed of the river the most encountered facies are highly plastic sandy clay, having moderate compressibility with compression index of about 0.2. The long-term mechanical properties for this type of facies show a strong over-consolidation, drained cohesion of the order of 63 kPa and a friction angle equal to 23°.


All the test results issued from geotechnical investigation the soil parameters given in Fig. 5 were adopted for numerical computations.
Auscultation of the Sidi El Barrak dam
The Sidi El Barrak dam is equipped for control and follow-up system composed of the following:
-
467 markers installed on the crest and downstream levels to capture the evolution of altimetric and planimetric displacements;
-
six pillars placed on the right and left banks, and
-
eight benchmarks placed on the spillway flood.
These equipments were essentially installed to monitor the horizontal and vertical displacements of the dam.
The settlement at the crest level was monitored by four topographic references (RPS8, RPS10, RPS11 and RPS17) placed as shown in Fig. 3. Figure 4 shows the evolution of recorded settlement along the PQ3 profile at the crest level.

Locations of benchmarks for measuring settlement of Sidi El Barrak dam

Evolution of the settlement on the crest of Sidi El Barrak dam (markers RPS10)
The cumulated maximum settlement during 12 years, from July 2003 to August 2015, is of the order of 187 mm. This settlement represents 0.67% of the height of the dam that is equal to 28 m. Between 2003 and 2008, there was 86 mm increase in settlement, that represents about 46% of the global settlement, the evolution of the settlement then remained stable during the years 2013, 2014 and 2015, at the rate of 12 mm per year. The stabilized settlement that occurred, after 10 years, corresponds to the end of primary consolidation of the foundation. It is, therefore, concluded that observed settlement at the crest at the RPS10 mark is attributed to the foundation of the Sidi El Barrak dam.
Predicting the behavior of the foundation of Sidi El Barrak dam
The adopted geotechnical profile shows that the foundation of Sidi El Barrak dam is composed of three layers (from top to down): first, an alluvial sand layer having variable thickness (12 m at the upstream side and 26 m at the downstream side); second: a plastic clay layer with variable thickness: of about 21 m at the upstream side and 7 m at the downstream side; third: a sandy clay layer of 17 m thickness. Those layers are resting or rigid strata that extends to 50 m depth (Fig. 5).

Numerical modeling of Sidi El Barrak dam
The dike of Sidi El Barrak dam is built in zoned land: the upstream side is composed of a compacted clay and the downstream is a compacted sand and riprap stone at the toe [17].
Three constitutive models are used: the Mohr–Coulomb elastic perfectly plastic model for all layers of the foundation and the dike material with the characteristics presented in Table 2. The elastic–plastic behavior described by the Soft Soil model (SSM) is only used for the clay layer of the foundation. The behavior of material of dike is described by the Hardening Soil model (HSM).
From results of Cone Penetration test (CPT) recorded after vibro-compaction an averaged value is adopted of the Young’s modulus of the alluvial sand layer. The correlation between the Young’s modulus E (MPa) and the tip resistance qc of CPT test proposed by Trofimenkov [16] for sands was adopted. The average tip resistance of the sand layer after treatment by vibro-compaction is of the order of 13.8 MPa. A drained behavior was assumed for the constitutive material of the embankment and foundation layers.
The material characteristics of the dam and the clay layer of the foundation selected for the plane strain numerical modeling with HSM models and SSM are given in Table 3.
Numerical modeling, mesh and boundary conditions
The main objective of numerical simulation is an attempt to reproduce the displacements within the core dam and within the layers the foundation of Sidi El Barrak dam [9, 10]. The geometry of the plain strain numerical model is chosen centered on the body of the dam. The geometry of numerical model shows a thickness of 50 m, and width of 450 m was adopted for the foundation of Sidi El Barrak dam. The generated mesh by Plaxis 2D software (Version 2015.2) is composed of 15 node triangular finite elements. An averaged type of mesh was considered to reduce the computation time. It consists of 4662 triangular finite element corresponding to a total of 37,549 nodes and 55,944 stress points (Fig. 6). It is designed to simulate the step-by-step construction. The existence of an interface between the plastic wall and different layers in the foundation is characterized by a reduction factor (Rinter) of the shear strength for each soil layer. The value chosen for this coefficient is 0.67 for the sand is of the order of 0.5 for the clay (Brinkgreve [8]).

Mesh and boundary conditions
The boundary conditions of the numerical model shown in Fig. 6 are the following:
-
zero vertical and horizontal displacements at the substratum depth;
-
zero horizontal displacement along vertical borders of dam foundation;
-
pressure due to the height of water at the upstream side and
-
on the remaining sides of the border the stress vector is zero (free stress boundary).
The schedule of dam construction was modeled by 14 soil layers applied over 1550 days. The ground water level remains unchanged; it permanently coincides with the upper level of dam foundation. For a static calculation, the existence of a hydrostatic pressure in the upstream shell was assumed, that is to say a general phreatic set to elevation of 26 m. This only generates the external water pressure on the upstream facing of the dam; this step begins after the dam was built and will last 550 days that covers the filling-up of reservoir. The behavior of Sidi El Barrak dam is investigated by using the Plaxis 2D code for the short- and long-term conditions. For each case study the behavior of dike and the foundation is analyzed. This numerical investigation is performed throughout a parametric study by considering different behavior constitutive models.
Three cases of numerical computation were carried out:
-
Case no. 1: All layers of the foundation and the dam body are modeled by the Mohr–Coulomb model,
-
Case no. 2: The dike and the layers of sand and sandy clay of the foundation are modeled by the Mohr–Coulomb model, while for the clay layer of the foundation SSM model was adopted.
-
Case no. 3: The dike is modeled by the hardening soil model and the foundation (including sand, sandy clay and clay layers) by the Mohr–Coulomb model.
Short-term behavior analysis of the dam and foundation
The short-term behavior of dam is predicted during the stage of construction that lasted about 5 years.
Short-term settlement of the dike
Obtained results with the three adopted behavior models are shown in Figs. 7, 8 and 9.

Settlement of the dike before fill up (Computation Case no. 1)

Settlement of the dike before fill up (Computation Case no. 2)

Settlement of the dike before fill up (Computation Case no. 3)
At the end of construction, the settlement due to the self weight of the dam ranges from 0.95 to 1.4 m at the crest level. The maximum predicted settlement is obtained for case no. 3 of numerical computation. However, the lowest settlement prediction was for the second case in which the elasto-plastic behavior model (SSM) was considered for the clay layer of the foundation. At the downstream side along with the reduction in the height of the dam, the settlement decreases and tends to 10 cm where the height of dam equals 8 m. Comparing between the measurements at topographic markers (RPS10, RPS17, RPS22 and RPS27), it is noted that the settlement values are converging for the first and second computation cases. The predicted settlement in the body of the dam is proportional to its height that is equivalent to a surcharge subjected the foundation ranging from 540 kPa below the crest at 150 kPa downstream. The value of settlement are likewise linked to the difference between the thickness of the compressible clay layer in the foundation, which is of the order of 20 m at the upstream side, 13 m below the crest and 7 m downstream side.
Settlement of the foundation
The evolution of settlement of the foundation versus time under the crest of the dam is shown in Fig. 10. For the third numerical computation case the peak value of settlement at the end of construction (after 1650 days) is of the order of 0.74 m. For the second simulation case this settlement is 0.61 m. The difference between the values of the settlement for the three simulation cases is of about 8 cm between the first case and the third case. While this difference is of the order of 5 cm between the first case and second case of numerical computation, and 13 cm between the second case and the third case of calculation.

Settlement of the foundation under the crest before fill up
It is noted for the three numerical computations that the variation of short-term settlement versus time are quite similar. The settlement of the foundation remains in admissible limit regarding the height of the dam and given the applied load on the foundation.
Comparing between measured settlements on the crest of the dam and at the top level of the foundation under the same vertical direction, it is deduced that the settlement of the dike is about 0.76 m for the third computation case, 0.44 m for the first case and is of the order of 0.34 for the second case. From these results it is seen that the choice of constitutive law affects the predictions of settlement. The recorded normalized settlements against of the height of the dam for the three numerical computation cases vary between 2.6 and 1.17%. Those magnitudes confirm the stability of the dike during the construction of Sidi El Barrak dam.
Elastic settlement
In the period of time between the final day of construction stage ended on (09/1999) and the first date of settlement measurements (07/2003) the immediate (elastic) settlement has not been estimated. However, such estimation is feasible from the settlement-time curves displayed in Fig. 11. In fact, by the performed numerical study the period of time between the end of dam construction and the commencement of settlement record was simulated (duration is 1250 days). During this period of time, referring to numerical predictions made by the three cases no. 1, 2 and 3 shown in Fig. 11, the elastic settlements were 9, 1 and 2, respectively.

Evolution of settlement of the crest of the dam after impoundment of the Sidi El Barrak dam
This elastic settlement, by assuming that the primary consolidation was not triggered in compressible layers, can be estimated by the Boussinesq formula as the sum of two components. The first and second elastic settlement components at the axis of the crest of dike correspond to the deformation of the sandy clay layer and the clay layer of thickness H1 and H2, of respective Young moduli E1 and E2 where the induced vertical stress of overlaying layers are ∆σ1 and ∆σ2:
From those predictions the average of elastic settlement as calculated by the Boussinesq’s formula is about 5 cm.
Long-term behavior of the dike
The evolution of settlement of the dike at the upper level versus time is shown in Fig. 11, for the three computational cases. For the third case, the recorded settlement 10,000 days after the filling of the reservoir is of the order of 21 cm, whereas for the same interval of time, the settlement is estimated at 39 cm for the second numerical computation case and 22 cm for the first numerical computation case. Therefore, observed settlement for computation cases 1 and 3 used for the analysis of the behavior of the dike of Sidi El Barrak dam almost led to the same evolution and magnitude of the consolidation (long term) settlement. This permitted to conclude that the magnitude of long-term settlement is almost independent from the adopted constitutive models.
The settlement recorded at the end of the filling up varied from 1.39 to 0.986 m for the three numerical computation cases. A slight heave was observed at the upper level of dam crest that is of about 3.4 cm for the first numerical case, about 3.3 cm for the third numerical case. This heave can be explained by the increase in pore water pressure within the dike associated with the presence of the reservoir at the upstream side.
Further, measurements recorded by markers installed at the upper level of the crest since July 3, 2003, indicated that the magnitude of settlement reached 18.7 cm after the installation of markers to the date of the last auscultation in August 2015 or 12 years (4400 days) later. Comparing these recorded data with predictions by the numerical study (Fig. 12), it is concluded that the results of the second numerical computation case are in good agreement with in situ measurements.

Comparison of in situ measurements and numerical predictions
Therefore, the adoption of SSM suitably simulated the behavior of the clay layer as part of the foundation of the Sidi El Barrak dam. Furthermore, the Mohr–Coulomb model proved much suitable to simulate the behavior of the sand and clay material of the dike. The predictions obtained by Plaxis 2D were confirmed by measurements during the follow-up of Sidi El Barrak dam. Therefore, it is concluded that the long-term stability of this recent earth dam is not compromised, thanks to the suitably predictions obtained by Plaxis software that were found in good agreement with measurements, from the follow-up in proposed.
Conclusions
A plane strain modeling comprising the dike of Sidi El Barrak dam and its foundation was performed to predict the behavior of this recent Tunisian earth dam. Three numerical computation cases were performed with the aim of simulation of the behavior dike and its foundation from the filling of reservoir up to date. The Soft Soil Model was adopted for the clay layer of the foundation and the Mohr–Coulomb was used for the rest of soil layers and materials. Good numerical results in agreement with in situ measurements were obtained.
The Soft Soil Model proved to be the best to study the behavior of the clay layer of the foundation of Sidi El Barrak dam, while the Mohr–Coulomb model was revealed to be suitable for the simulation of the behavior of sand and clay constituents of the dike.
Obtained results from the conducted plane strain numerical investigation showed the great utility of numerical tools to suitably predict the behavior of an earth dam during the stage of construction, especially during their life-service. Predictions made by those numerical simulations represent a high interest when considering future earth dams projects, to interpret the predictions and, consequently, for a better of target preventive solutions.
References
Al Hussein M (2001) Etude de comportement différé des sols et ouvrages géotechnique. Thèse de doctorat, Université Joseph Fourrier-Grenoble I, 23 Octobre 2001. 272
Antinhiac P (1999) Comportement des enrochements mouillés. Le modèle hydroplastique. ESIM et Cémagref
Blanchin M, Michalski Edmond R, Dequidt O, Giafferi Jean L (2002) La foundation du barrage Sidi El Barrak. JNGG 2002, 8 et 9 octobre 2002, Nancy
Bouassida M, Karoui H, Belaid M (2011) Pathology of foundation of Ghezala dam, a Tunisia case history. 15th African Regional Conference on Soil Mechanics and Geotechnical Engineering, pp 63–70
BRGM/EDF (1991) Résultats des essais statique de laboratoire. Rapport d’expertise global. Juin 1991: Annexe 1 A13
BRGM/EDF (1991) Résultats des essais statique de laboratoire. Rapport d’expertise global. Juin 1991: Annexe 14 A44
BRGM/EDF (1991) Résultats des essais statique de laboratoire. Rapport d’expertise global. Juin 1991: Annexe 45 A82
Brinkgreve RBT (2002) Plaxis-Finite Element Code for Soil and Rocks Analysis. Version 8. AA. Balkema, Rotterdam Brookfield
Carrère JA (2000) La modélisation: outil d’aide à l’interprétation des mesures. 20th Int Cong Large Dams 5:1005–1024
Coyne et Bellier (2001) Modélisation des barrages en remblai. Comité Français des grands barrages. Collogue Technique, 10 et 11 Mai 2001, pp 1–25
Djebbi M, Bouassida M (2008) Educating students through understanding the pathology of geotechnical projects. 6th Int Conf Case Histories Geotechn Eng, pp 1–9
El Ouni MR, Guettaya I, Olivier PLE (2013) Evaluation du risque de liquéfaction de la fondation d’un barrage en terre à partir d’essais in situ» Revue française de géotechnique. France, Caluire le 3 Novembre 2013, pp 1–31
Fauchet B (1991) Analyse poroplastique des barrages en béton et de leurs fondations. Rôle de la pression interstitielle. Thèse de doctorat de l’ENPC
Karoui H, Bouassida M (2014) Assessment of the foundation of Tunisia Ghezala Dam. Geotech Geolog Eng 33(1):87–93
Klai M, Bouassida M, Tabchouche S (2015) Numerical modelling of Tunis soft clay. Geotechn Eng J SEAGS & AGSSEA. 46:1–9
Trofimenkov YG (1964) Field methods for testing the structural properties of soils. Building Literature Publishing House, Moscow
Zairi M, Rouis MJ, Helali JE (1999) Evaluation de l’efficacité du vibro-compactage de la fondation du barrage de Sidi El Barrak Tunisie. Annales du bâtiment et des travaux publics. Paris, Juillet–Août 3:31–37
Author information
Authors and Affiliations
Corresponding author
Rights and permissions
Open Access This article is licensed under a Creative Commons Attribution 4.0 International License, which permits use, sharing, adaptation, distribution and reproduction in any medium or format, as long as you give appropriate credit to the original author(s) and the source, provide a link to the Creative Commons licence, and indicate if changes were made.
The images or other third party material in this article are included in the article’s Creative Commons licence, unless indicated otherwise in a credit line to the material. If material is not included in the article’s Creative Commons licence and your intended use is not permitted by statutory regulation or exceeds the permitted use, you will need to obtain permission directly from the copyright holder.
To view a copy of this licence, visit https://creativecommons.org/licenses/by/4.0/.
About this article

Cite this article
Karoui, H., Bouassida, M. Assessment of observed of behavior of Sidi El Barrak Dam (Tunisia). Innov. Infrastruct. Solut. 1, 44 (2016). https://doi.org/10.1007/s41062-016-0044-5
Received:
Accepted:
Published:
DOI: https://doi.org/10.1007/s41062-016-0044-5