
Abstract
Finite element (FE) analyses were performed to explore the prying influence on moment–rotation behaviour and to locate yielding zones of top- and seat-angle connections in author’s past research studies. The results of those FE analyses with experimental failure strategies of the connections were used to develop failure mechanisms of top- and seat-angle connections in the present study. Then a formulation was developed based on three simple failure mechanisms considering bending and shear deformations, effects of prying action on the top angle and stiffness of the tension bolts to estimate rationally the ultimate moment M u of the connection, which is a vital parameter of the proposed four-parameter power model. Applicability of the proposed formulation is assessed by comparing moment-rotation (M–θ r ) curves and ultimate moment capacities with those measured by experiments and estimated by FE analyses and three-parameter power model. This study shows that proposed formulation and Kishi–Chen’s method both achieved close approximation driving M–θ r curves of all given connections except a few cases of Kishi–Chen model, and M u estimated by the proposed formulation is more rational than that predicted by Kishi–Chen’s method.
Introduction
Semi-rigid connections are receiving considerable interest in the research community because of their easy installation in steel frames and energy-dissipating capability under reversal loading (Elnashi et al. 1998; Shen and Astaneh-Asl 1999; Garlock et al. 2003; Pirmoz 2006; Cheol and Young 2007). Understanding the viability of these connections in practice, AISC (2001, 2010) adopted top- and seat-angle connections into the design specifications to transfer only the beam-shear force to the column. However, experimental evidences and the author’s past studies on the connections exposed that besides transferring beam-shear force, this type of connections transferred fairly significant beam-end-moment to the column. When transferring the moment through the top angle to the column, an increase in tensile force occurred in the bolts due to local deformation of the top angle’s vertical leg. This additional tensile force is commonly known as prying force. A few researchers have paid serious attention to this additional force in their mathematical representation of connection behaviour. The most recent stiffness modelling technique that includes individual elements behaviour reformed in equivalent T-stub connection model for both extended end plate connections and angle type of connections following the modelling technique of Weynand et al. (1995) has been adopted in Eurocode 3 (CEN 2005). However, the T-stub model is somehow different in respect to interaction with the actual deformation pattern of true angle type of connections at failure and may loose its efficiency in estimation of connection strength. So, precise understanding about interaction among connection components on moment–rotation behaviour is required to represent a straightforward and accurate mechanical model of the connection.
In this perspective, four-parameter power model (Kishi et al. 2004) of predicting moment–relative rotation characteristic of end plate connection is chosen for studying the model further for top- and seat-angle connections because it is clearly representing its physical meaning and can be implemented in second-order frame analysis. In their three-parameter power model, Kishi and Chen (1990) considered bending and shear deformations of the angle, but disregarded deformation of bolts for deriving the ultimate moment capacity of angle type of connections. To establish a rational prediction model for representing the M–θ r curves of the connections, this effect on connection behaviour needs to be considered (Ahmed and Hasan 2015). Thus, a formulation of determining the ultimate connection moment M u is proposed assuming three types of simple mechanisms of connection failure using the T-stub concept of Eurocode 3 (CEN 1997). The locations of plastic hinges in the failure mechanism of top- and seat-angle connections assumed by three-parameter power model (Kishi and Chen 1990) are revised based on the deformation patterns of the connections reproduced by FE analyses (Ahmed et al. 2001; Ahmed 2002; Pirmoz et al. 2009) and experiments (Azizinamini et al. 1985; Harper 1990). In this formulation, the effects of prying action, bolt stiffness and bending and shear deformations of the tension angle are considered. Replacing M u predicted by the proposed formulation, initial connection stiffness R ki estimated by Kishi–Chen’s formulation (Eq. 3) with modifications for largely deformable connections and shape parameter n obtained by best fitting the predicted M–θ r curves on experimental ones into proposed four-parameter power model, M–θ r relations of top- and seat-angle connections are reproduced. Performance of the proposed prediction model is assessed by comparing the predicted values of M u and M–θ r curves with those of measured by experiments and calculated by FE analysis and Kishi–Chen’s three-parameter power model (Kishi and Chen 1990). It is observed that the proposed four-parameter power model and Kishi–Chen’s three-parameter power model both can generate acceptable M–θ r curves for the given connections except a few connections for Kishi–Chen’s model, and the ultimate connection moments obtained by the proposed method are more rational than those estimated by Kishi–Chen’s model.
FE analysis of connections
FE modelling including mesh discretization, boundary conditions, loading method, and method of static FE analysis using ABAQUS standard of top- and seat-angle connections was discussed elaborately in the author’s previous literatures (Ahmed et al. 2001; Ahmed 2002). In those and other (Pirmoz et al. 2009) research articles, the stress-deformation pattern developed by FE analyses showed that plastic yielding initiated at the toe of the tension angle’s fillet, followed by yielding in the area under the tension bolt head for thinner angles (e.g., for the cases of \({\raise0.7ex\hbox{$ 3$} \!\mathord{\left/ {\vphantom { 38}}\right.\kern-0pt} \!\lower0.7ex\hbox{$ 8$}}^{{\prime \prime }}\) angle thickness), and in the areas of tension bolthole for the cases of thicker angles. Thus, it is noted that as the tension angle thickness increases, the zone of plastic yielding moves toward the centreline of the bolthole of the vertical leg. Shen and Astaneh-Asl (1999) also found similar deformation history of the connections in their experimental programs and observed that plastic deformations were developed in the vertical leg of top-angle and horizontal leg of seat-angle for connections with thinner angles, whereas the plastic deformations were formed at the central line of the column bolts of top-angle’s vertical leg together with shank areas of bolts for relatively thick angles. Simultaneously, FE analysis results showed that the stresses higher than the yield point were generated in the bolt shank near the bolt head. It indicates that the nonlinear behaviour of the connection differs from some assumptions of Kishi–Chen’s power model. With this background, the place of formation of the upper plastic hinge in the top angle’s vertical leg has been revised and an additional plastic hinge is supplied in the tension bolts according to the results of tests (Shen and Astaneh-Asl 1999) and FE analyses (Ahmed et al. 2001; Ahmed 2002; Pirmoz et al. 2009) for the proposed prediction model in determining the ultimate connection moment.
FE analysis results demonstrated that the distance of the prying force acting point from the centerline of bolthole at the ultimate level of loading mostly depended on the thickness of the top angle and gage distance from angle heel to the centerline of bolthole (Ahmed and Hasan 2015). Therefore, it is shown that the distance b of the prying force acting point from the centerline of bolthole is a function of the angle thickness of top angle, t t , in combination with gage distance from angle heel to the centerline of bolt hole, \(g_{t}^{{\prime }}\) (Fig. 4), and expressed as (Ahmed and Hasan 2015)
where a is the distance from the centerline of bolt hole to the top edge of tension angle’s leg adjacent to column flange (Fig. 4).
FE analysis results also showed that prying force Q can be of as much as 2.4 times the shear force V t (i.e., beam flange force) (Ahmed and Hasan 2015), and it will be considered in the calculation of design resistance of tension fasteners and the ultimate connection moment for the proposed model.
Proposed four-parameter power model
Since the inception of semi-rigid connections in steel structural analysis and design, several mathematical models of representing moment–rotation behaviour of semi-rigid connections have been proposed. The linear models were the simplest (Rathbun 1936; Monforton and Wu 1963; Lightfoot and LeMessurier 1974), but they were not viewed as significant improvements over the conventional connection models (rigid and pinned). Thus, the linear models were soon overshadowed by the introduction of bilinear/piece-wise linear models (Tarpy and Cardinal 1981; Lui and Chen 1983; Jones et al. 1980, 1981). Frye and Morris (1975) proposed the polynomial model by using curve-fitting constants. Although the polynomial model was a significant improvement against the drawbacks of linear/bilinear/piecewise linear models, it has an inherent tendency of producing negative stiffness, which makes the model less attractive for the implementation in a computer-based analysis program. Lui and Chen (1986) proposed a multi-parameter exponential model, which was further refined by Kishi and Chen (1986). Kishi and Chen (1990) later made an improvement by introducing a semi-analytical model. The model used a power function similar to those of Richard and Abbott (1975) and Colson and Louveau (1983) and employed three-parameters: initial connection stiffness K i , ultimate moment capacity M u and a shape parameter n. The three-parameter power model is mathematically represented by the following equation whose general shape for different values of n is shown in Fig. 1.

M–θ r curves for three-parameter power model
Inquiring about experimental moment-rotational curves of top- and seat-angle connections from the database (Kishi and Chen 1986), it is found that strain-hardening stiffness exists in the moment–rotational behaviour of the connection. Thus, four-parameter power model that considers strain-hardening connection stiffness is chosen to be modified to construct moment–-rotation relations of these connections. Thus, Kishi’s four-parameter power model (Kishi et al. 2004), using four parameters, such as initial connection stiffness K i , strain-hardening connection stiffness K sh , ultimate moment capacity M u , and a shape parameter n, was developed to predict moment–relative rotation behaviour of extended end plate connections. This model, which was originally proposed by Richard and Abbott (1975) for modelling elasto-plastic stress–strain relation, is modified for predicting moment–rotation characteristics of top- and seat-angle connections and can be expressed as
where θ o is a reference plastic rotation; θ o = M o /(K i −K sh ), in which M o is the referenced connection moment and defined as M o = M u −K sh θ u , where θ u is the rotation produced against M u . Similar to three-parameter power model, initial connection stiffness K i of proposed four-parameter power model is determined using the following equation:
where EI ta is the bending stiffness of the top angle’s vertical leg; \(g_{ 1} = g_{t}^{{\prime }} {-}w_{b}/ 2 { }{-}t_{t} / 2\); \(g_{t}^{{\prime }}\) is the gage distance from the heel to the bolt hole centerline in the top angle leg adjacent to the column flange; w b is the width of bolt head across the flats; d b is the fastener’s diameter; d 1 = d + t t /2 + t s /2; d is the beam depth; t t and t s are the thicknesses of top and seat angles; respectively and shape parameter n is determined by using the best fit the proposed M–θ r curve with that of produced from experiment or FE analysis. Strongly calibrated on experimental and FE analysis moment–rotation curves, strain-hardening connection stiffness is evaluated as K sh = 0.005K i . Hence, Fig. 2 shows the general shapes of M–θ r curves of Eq. 3 with different values of shape parameter n. In one extreme, if n is taken to be infinity, the model reduces to a bilinear curve with the initial connection stiffness K i from the origin and strain-hardening connection stiffness K sh from the reference point (0, M o ) to the ultimate point (θ u , M u ).

M–θ r curves for proposed four-parameter power model
Method of determining ultimate connection moment
Modelling technique
The moment-rotation prediction method proposed by Kishi and Chen (1990) in combining the concept of T-stub model (CEN 1997) is used with refinement based on an improved modelling technique of connection components accounting to revising locations of plastic hinges in top-angle and/or supplying extended plastic hinges in tension bolts and prying action in failure mechanisms to estimate ultimate connection moment of top- and seat-angle connections.
Assumptions
The following assumptions are employed in determination of connection’s ultimate moment capacity for proposed connection model, few of which were applied in Kishi–Chen’s power model (1990):
-
1.
centre of rotation of a deformed connection is located at the intersecting point of the horizontal middle plane and the vertical cross-section at the toe of the fillet of angle leg adjacent to the compression beam flange (point C in Fig. 3);
Fig. 3 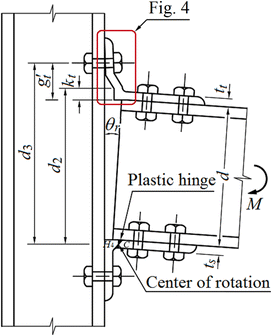
Deformed configuration of top- and seat-angle connection
-
2.
deformations of connection elements are small; additional stresses created due to the deformation of top-angle’s column adjacent leg are ignored;
-
3.
materials of connecting elements are elasto-plastic;
-
4.
one plastic hinge is assumed to form at the angle’s leg adjacent to compression beam flange at the centre of rotation (H 4 in Fig. 4) with other plastic hinges in the tension angle and/or fasteners at the ultimate level of loading.
Fig. 4 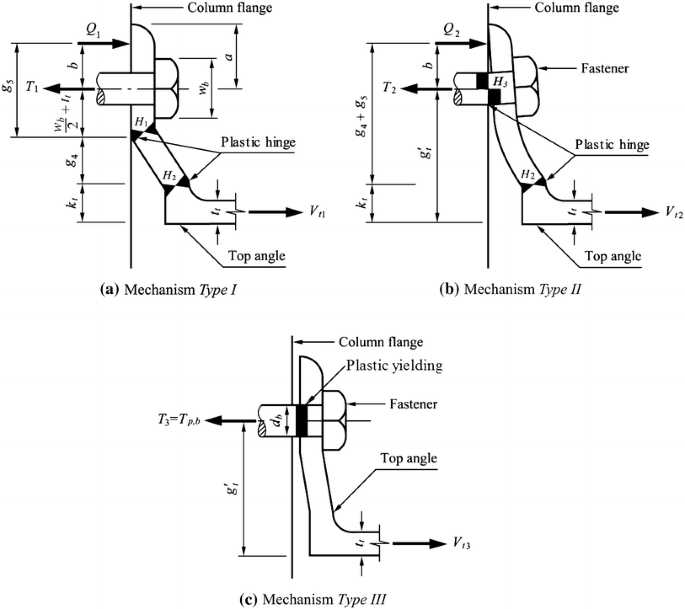
Failure mechanisms of top angle


Failure mechanisms
Following the T-stub model (CEN 1997), three types of mechanisms of connection failure are considered to evaluate the ultimate moment capacity. These mechanisms have been incorporated from deformed shapes of tested connections reported by Azizinamini et al. (1985), Harper (1990) and Shen and Astaneh-Asl (1999), and the places of few plastic hinges are revised from those assumed in the failure mechanism of Kishi–Chen’s power model (Kishi and Chen 1990). The places of plastic hinges are also verified by the deformed shapes and plastic yielding areas of connections obtained from nonlinear FE analyses (Ahmed et al. 2001; Ahmed 2002; Pirmoz et al. 2009). The following three mechanisms at the failure of top- and seat-angle connections are assumed:
Mechanism Type I
Two plastic hinges are assumed to develop in the top angle’s vertical leg, and tension bolts are considered as stiffer members than top angle (as for Kishi–Chen’s model). In this model, the location of formation of the upper plastic hinge is revised from Kishi–Chen’s assumption based on the results obtained from 3D FE analyses (Ahmed et al. 2001; Ahmed 2002; Pirmoz et al. 2009). And it is assumed for this type of mechanism that the prying force contributes to form the upper plastic hinge of the top angle.
Mechanism Type II
One plastic hinge is assumed to form in the top angle’s vertical leg and another in the bolt shank due to the combined action of bending moment and tensile force. This type is considered to cover the case in which yielding occurs simultaneously in the top angle and the tension bolt and prying action contributes to the yielding.
Mechanism Type III
No plastic hinge is assumed to develop in the top angle, and connection failure occurs only by complete plastification of tension bolts. This type is considered to cover the case in which the bolts’ yield strength is less than the bending and shear resistances of the top angle.
These three simple failure mechanisms in the case of the fastening bolts being arranged in one line are shown in Figs. 3 and 4.
In the cases of Type I and Type II mechanisms, it is assumed that the prying force develops in between the centerline of bolt hole and the top edge of the top angle (Ahmed and Hasan 2015), and the prying force and beam flange force (hereinafter, indicated as shear force) are determined considering the location of the prying force and the plastic moment capacity at the plastic hinges of the top angle. The least value of shear force among those estimated from these three mechanisms is taken as the shear resistance of a given connection and is used to evaluate the ultimate moment capacity of that connection.
Moment–shear interaction
Shear resisting forces acting on the plastic hinges of the top angle’s vertical leg corresponding to Type I and Type II mechanisms can be evaluated by applying Drucker’s Moment–shear interaction (Drucker 1956). According to Drucker’s yield criterion (Drucker 1956), yielding of the top angle’s vertical leg occurs under the combined action of bending moment M t and shear force V t when the following condition is satisfied:
where M p,t is the pure plastic moment of the top angle’s vertical leg. According to the maximum shear stress criterion, also known as Tresca’s yield criterion, the pure plastic moment of the top angle is given by
where l t is the width of the top angle across the column, σ y,t is the yield stress of the tension angle and V p,t is the pure plastic shear of the top angle, which can be obtained by
Determination of resisting forces and ultimate moment capacity of connection
Mechanism Type I
Mechanism Type I is characterized by the formation of three plastic hinges as shown in Figs. 3 and 4a.
Applying the work equation and considering moment–shear interaction in the mechanism Type I failure mechanism, the shear force can be found by
where g 4 is the vertical distance between the two plastic hinges involved in the failure mechanism of the top angle (Fig. 4a), which can be found by
in which \(g_{t}^{{\prime }}\) is the gage distance from the heel to the centerline of the fastener’s hole in the top angle’s leg adjacent to the column face, w b is the width of the bolt head across the two opposite flat sides, and k t is the distance from the top angle’s heel to the toe of the fillet.
Combining Eqs. 6 and 7, the relation between M p,t and V p,t can be obtained as
Substituting this relation and Eq. 8 into Eq. 5, a biquadratic equation regarding (V t1 /V p,t ) can be obtained as follows:
The value of V t1 can be easily determined by simple iteration of Eq. 11. A similar equation with the exception of the definition of g 4 is derived by Kishi and Chen (1990).
From the equilibrium condition of the top angle for the mechanism Type I, the tension resistance of the fasteners can be obtained by
in which Q 1 is the prying force for the mechanism Type I. From the condition of plastification of the top angle’s vertical leg at the plastic hinge H 1 (Fig. 4a), the prying force is given by
where g 5 is the distance from the plastic hinge H 1 to the location of the prying force (Fig. 4a) and is defined by
and b is the distance from the centerline of the fastener’s hole to the location of the prying force at the ultimate level of loading. Distance b is investigated beforehand by conducting FE analyses of top- and seat-angle connections and approximated by Eq. 1 with some conservative provision.
The ultimate moment capacity M u1 of the top- and seat-angle connection, obtained by taking moment about the centre of rotation (Figs. 3 and 4a), can be estimated by the following equation:
in which M p,s is the pure plastic moment of seat angle’s leg adjacent to compression beam flange. M p,s can be determined by Eq. 6 employing t s and σ y,s of the seat angle in lieu of t t and σ y,t . d 2 is the distance from the centre of rotation to the plastic hinge H 2 (Fig. 3), which can be found by
Mechanism Type II
Mechanism Type II is shown in Figs. 3 and 4b. Considering the moment–shear interaction effect for this mechanism, the plastic yielding of the top angle’s vertical leg at the plastic hinge H 2 (Fig. 4b) provides
where distances g 4, g 5 and b can be determined from Eqs. 9, 14 and 1, respectively; T 2 is the tension resistance of the fastener and Q 2 is the prying force developed in mechanism Type II.
Combining Eqs. 10 and 17 with Drucker’s moment–shear interaction Eq. 5, the condition of plastification of the top angle (Fig. 4b) can be written in the following form:
where T p,b is the axial tensile resisting capacity of the bolts’ shank, but not the threaded area of the shank because yielding of tension fasteners occurs at the shank area near the fastener’s head due to bending of the shank (explained above), which is given by
where \(n_{t}^{{\prime }}\) is the number of fasteners in the tension angle’s leg adjacent to the column, A b is the cross-sectional area of fastener's shank and σ y,b is the yield stress of fastener’s material.
Substituting the nondimensional values μ = (g 4 + g 5)/t t and η = 1 + T p,b b/M p,t into Eq. 18, the following equation for shear resistance of the top angle can be obtained:
where V t2 can be determined from Eq. 20 by a simple iterative procedure. The tension resistance of the fastener is given by
By applying Eq. 21 and substituting M p,t in lieu of M t in Eq. 17, the prying force developed in the tension fasteners can be expressed with some conservatism as
Taking the moment of all forces developed in the plastic hinges for mechanism Type II about the centre of rotation, the ultimate moment capacity of the connection can be obtained by
where M p,b is the pure plastic moment of the fasteners, which ignoring the interaction with the axial force, is given by
where d b is the fastener diameter.
Mechanism Type III
This failure mechanism is shown in Figs. 3 and 4c. For mechanism Type III, it is assumed that the top angle is stronger than the fasteners, which causes plastic yield of the tension fasteners first and allows top angle’s vertical leg to move away from the column flange. This indicates that the prying force Q 3 for mechanism Type III will be diminished at the ultimate level of loading. Therefore, the value of the shear force cannot reach the value of the shear capacity of the top angle and can be given by
where T 3 is the axial resisting force of the tension fasteners for mechanism Type III, and T p,tb is the axial net tensile resisting capacity of the bolts and can be determined by using Eq. 19 by substituting A tb in place of A b ; where A tb is the net tensile area of the fasteners’ threaded area.
Taking moments of the fasteners’ resisting forces and seat angle’s bending resistance about the centre of rotation, the ultimate moment capacity for mechanism Type III can be found by
in which d 3 is the distance between the centre of rotation and the centerline of the tension fasteners (Fig. 3),and is given by
Assessment of proposed prediction model
Two experiments identified as A1 and A2 and tested by Azizinamini et al. (1985), one experiment nominated as Test 3 and tested by Harper (1990) and sixteen advanced FE analysis performed by Ahmed (2002) are used to assess the proposed formulation of determining M u and M–θ r relation prediction model of top- and seat-angle connections. In the article (Ahmed and Hasan, 2015), the effective geometrical properties of connections shown in Fig. 1 and Table 1 and mechanical properties of materials of connection components demonstrated in Table 2 are implemented to predict M–θ r relations using proposed prediction model, three-parameter power model and FE analysis using ABAQUS (Ahmed 2002).
The summary of calculation results of the proposed method of determining M u is shown in Table 1. This Table shows that the proposed formulation predicts larger ultimate moment capacity than that of three-parameter power model because of revision of the vertical gage distance between the two plastic hinges developed in top angle for test connection models A1 and Test 3 identified as Mechanism Type I and very closely approximated with the results of experiments and FE analyses (Table 1; Fig. 5a, c). It is also able to decrease the ultimate moment capacity of connections A2, FE1, FE2 and FE4–FE11 (Table 1) and significantly for many of them (FE1, FE2, FE4, FE7, FE10 and FE11) which are defined as Mechanism Type II because of consideration of bolt stiffness and prying action in the proposed prediction model, and shows best fit with the experimental (Fig. 5b) and FE analysis results (Fig. 5d, e, g–o). Although M–θ r curve estimated by FE analysis of connection model FE9 shows little stiffer behaviour near the points of yielding zone than that of the proposed connection model (Fig. 5l) for considering curve fitting shape parameter n in Eq. 3, this parameter could not make M–θ r curve rotate shapely near the yielding zone for the weak connections. Proposed model estimated little higher n values for weaker connections, but it is much less than 2 to get sharp rotation at the yielding zone of moment-rotation curves (Fig. 2).


Proposed model verification comparing M–θ r relations among proposed model, FE analysis and/or experiment and three-parameter power model
Connections considering special treatment
The simple linear relation for g 4 in Eq. 9 with respect to the change of tension angle thickness could cause negative values of g 4 in some cases of connections with very short gage g t ′ and/or very thick tension angle thickness. For such cases, gage g 4 should be considered as zero and the shear-resisting force of the connection must not exceed the pure plastic shear resistance of the tension angle. In contrast, connections with long gage distance g t ’ of thin angles deflect a lot at the ultimate load and the proposed prediction model using the assumption of small deformation leads to very conservative estimation of connection element forces. It is observed that shear resisting forces of top angle using both Kishi–Chen three-parameter power model and the proposed model differ greatly (by nearly half for the connection models FE3 and FE13) from the FE analysis results. This phenomenon is shown in Fig. 6 for connection FE13. These connections can be treated as especial cases, and resisting forces should be determined considering large deformation (i.e., include additional resisting forces due to shear and bending deformation) of top angle’s vertical leg by introducing the nondimensional parameter g 4/t t .

Comparison between results of FE analysis and proposed model assuming both small and large deformation criteria
Comparison shown in Fig. 6 between FE analysis results and calculation of proposed prediction model assuming small deformation criteria shows that shear force calculated by the proposed prediction model (denoted by blue squire symbol and a blue solid Trendline constructed through these results) demonstrates very conservative values with respect to the results of FE analysis for connections with g 4/t t > 4.4 because of large deformation of the top angle’s vertical leg occurring at the ultimate level of loading. For these connections of large deformation, the vertical distance between plastic hinges H 1 and H 2 (Fig. 4a) becomes much closer than the length of gage g 4 shown in Mechanism Type I. Thus, it can be recommended that for connections with long gage distance \(g_{t}^{{\prime }}\) (i.e., the ratio g 4/t t is greater than 4.4), design resistances of connection components should be defined considering large deformation of tension angle by readjusting gage distance g 4. Gage g 4 is readjusted based on the FE analysis results shown in Fig. 6 (with solid green circles) and it can be approximated for the cases when g 4/t t > 4.4 by
The influence of moment–shear interaction for the shear resistance calculation of the tension angle with long gage \(g_{t}^{{\prime }}\) (of mechanism Type I) can be evaluated using \(\bar{V}_{t1}\), where \(\bar{V}_{t1}\) is the ratio between the shear forces introduced in Eq. 11. Ignoring moment–shear interaction (Eq. 8 with the value M p,t in lieu of M t ), the following relationship for mechanism Type I can be obtained from Eq. 11:
Employing the values of \({{g_{4} } \mathord{\left/ {\vphantom {{g_{4} } {t_{t} }}} \right. \kern-0pt} {t_{t} }}\) from Eq. 29 calculated for each given values of \(\bar{V}_{t1}\) from 0 to 1, the curve imposing the influence of moment–shear interaction on shear force for mechanism Type I is shown in Fig. 7. It is observed that for \({{g_{4} } \mathord{\left/ {\vphantom {{g_{4} } {t_{t} \ge 4}}} \right. \kern-0pt} {t_{t} \ge 4}}\) the reduction of V t1 due to the moment–shear interaction is less than 0.5%. Therefore, it can be concluded that the influence of moment–shear interaction can be neglected for \({{g_{4} } \mathord{\left/ {\vphantom {{g_{4} } {t_{t} \ge 4}}} \right. \kern-0pt} {t_{t} \ge 4}}\), and substituting M p,t and \(g_{4}^{{\prime }}\) in place of M t and g 4, respectively and ignoring moment–shear interaction, the shear force can be found from Eq. 8; this yields

Influence of moment–shear interaction on shear resistance of top angle for Mechanism Type I
Then, the ultimate moment capacity M u1 of the top- and seat-angle connection considering deformation configuration into account can be obtained by Eq. 15 replacing \(g_{4}^{{\prime }}\) in place of g 4. It allows the proposed model to predict ultimate moment capacity much closer to FE analysis results than that of three-parameter power model (Table 1; Fig. 5f, p).
It is obvious from Fig. 5 that the M–θ r curves predicted by the proposed prediction model and the three-parameter power model have good agreement with FE analysis and/or experimental moment-rotation curves except FE3 and FE13 connections for three-parameter power model. In addition, the proposed prediction model estimates closer values of ultimate moment capacity of top- and seat-angle connections to those measured in experiments and calculated by FE analysis than that of predicted by three-parameter power model (Table 1). The proposed prediction model is also able to estimate shear-resisting force V t of top angle and tensile resisting forces T of fasteners, which are also compared with FE analysis results in Table 1. The comparison shows that resisting forces of the top angle and tension fasteners estimated by the proposed prediction model are in closer tolerances compared to FE analysis and/or experimental results than those of predicted by three-parameter power model.
Alike ultimate moment capacity of the connections, large deformation of the top angle is also need to be accounted for estimating initial connection stiffnesses of the connections with long gages (\(g_{t}^{{\prime }}\)) like FE3 and FE13 connections. Initial connection stiffness considering large deformation can be estimated using Eq. 4 by readjusting the gage g 1 which denotes as \(g_{1}^{{\prime }}\) after correction and replaced in this equation in lieu of g 1. \(g_{1}^{{\prime }}\) is defined like \(g_{4}^{{\prime }}\) using Eq. 28 for the cases of g 4/t t > 4.4 in the following equation:
The calculation results of the proposed prediction model in Fig. 5f, p show that refined values of initial connection stiffness for FE3 and FE13 connections (considering large deformation) correspond better accuracy than three-parameter power model predicted values comparing with FE analysis results. However, the proposed M–θ r curves deviate from FE analysis results of FE3 and FE13 connections at the points of large rotations (Fig. 5f, p) because of considering constant strain-hardening stiffness K sh in Eq. 3. But FE analyses results of these connections show increasing strain-hardening stiffness at similar rotations of M–θ r curves (Fig. 5f, p). Initial stiffnesses of all the connections estimated by the proposed model are shown in Table 2.
Prediction of shape parameter
To predict moment–rotation curves of top- and seat-angle connections efficiently, it is necessary to readjust the Kishi–Chen formulation (Kishi and Chen 1986) of shape parameter n for the proposed mechanisms. The equation for determining the shape parameter n of top- and seat-angle connection is evaluated using the following procedure:
-
The value of n is determined against each test and/or FE analysis by the best fitting of predicted M–θ r curve with that of the test and/or FE analysis as shown in Fig. 5.
-
The values of n produced for all tests and/or FE analyses are then plotted against log 10 θ o (Fig. 8a, b). The expression of estimating shape parameter n is assumed to be a linear function of log 10 θ o (Fig. 8a) for Mechanism Type I and nonlinear function of log 10 θ o for Mechanism Type II obtained by first-order and fourth-order nonlinear regression analysis from the n−log 10 θ o graph, respectively, to have the best fit with the proposed prediction model.
Fig. 8 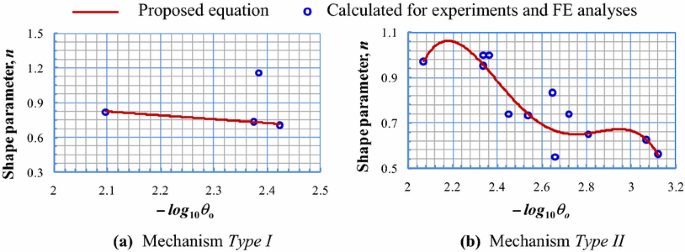
Verification of proposed equation of shape parameter comparing with experimental and FE analysis curve fitting n values

The above procedure results in empirical equations for estimating the design values of shape parameter n of top- and seat- angle connections and they are expressed, respectively, as for the connections of Mechanism Type I and Type II:
Figure 8a, b illustrates the distribution of n values of calculated M–θ r curves by Eq. 32 for Mechanism Type I and Eq. 33 for Mechanism Type II, respectively, compared with experimental and FE analysis results and both equations show the very satisfactory results for most of the connections (Table 2).
Conclusions
Investigating the places of plastic hinge formation by conducting 3D finite element analyses and considering the failure modes indicated by available experimental studies, three simple failure mechanisms were assumed for top- and seat-angle connections. Using these simple mechanisms of connection failure, a method of estimating the ultimate moment capacity has been proposed for top- and seat-angle connections. The performance of the proposed prediction model along with three-parameter power model was verified by comparing the ultimate moment capacity and M–θ r characteristics predicted by the proposed model and three-parameter power model with experimental and FE analysis results. The assessment of the proposed model reveals that the proposed model show better level of accuracy (with very small differences) in predicting M–θ r relations for most of the connections than that of three-parameter power model; in addition, the proposed prediction model demonstrates much better performance in estimating the ultimate moment capacity of the connections and initial connection stiffness for the cases of largely deformable connections than that of three-parameter power model. Therefore, the performance of the proposed prediction model has been improved by the refinement of three-parameter power model.
Abbreviations
- a :
-
Distance between the centerline of bolt hole and the top edge of tension angle's leg adjacent to column flange
- A b :
-
Cross-sectional area of bolt shank
- A tb :
-
Net tensile cross-sectional area of bolt’s threaded zone
- b :
-
Distance between the centerline of bolt hole and the prying force acting point at the ultimate level of loading
- d :
-
Beam depth
- d b :
-
Bolt diameter
- d 1 :
-
Distance defined as d + t t/2 + t s/2
- d 2 :
-
Distance from the centre of rotation to the plastic hinge H 2 (Fig. 3)
- d 3 :
-
Distance between the centre of rotation and the centerline of the tension fastener (Fig. 3)
- EI ta :
-
Bending stiffness of the top angle's vertical leg
- M u 1, M u 2, M u 3 :
-
Ultimate moment capacities of the connection for mechanisms Type I, Type II, Type III, respectively
- \(g^{\prime}_{t}\) :
-
Gage distance from angle heel to the centerline of bolt hole
- g 1 :
-
Gage defined as \(g^{\prime}_{t} - w_{b}/2 - t_{t} /2\)
- g 4 :
-
Vertical distance between the two plastic hinges involved in the failure mechanism of tension angle (Fig. 4a)
- g 5 :
-
Distance from the plastic hinge H 1 to the location of the prying force (Fig. 4a)
- K i :
-
Initial connection stiffness
- K sh :
-
Strain-hardening stiffness
- k t :
-
Distance from the angle’s heel to the toe of the fillet
- l t :
-
Width of the tension angle
- M o :
-
Referenced connection moment
- M :
-
Connection moment
- M p,b :
-
Pure plastic moment of bolts
- M p,s :
-
Pure plastic moment of seat angle adjacent to the compression beam flange
- M p,t :
-
Pure plastic moment of top angle adjacent to the tension beam flange
- M t :
-
Bending moment
- M u :
-
Ultimate moment capacity of the connection
- n :
-
Shape parameter
- \(n^{\prime}_{t}\) :
-
Number of fasteners in the tension angle’s leg adjacent to the column
- Q 1 and Q 2 :
-
Prying forces for mechanisms Type I and Type II, respectively
- Q :
-
Prying force
- t s :
-
Thickness of the compression angle
- t t :
-
Thickness of the tension angle
- T 1, T 2 and T 3 :
-
Resisting forces of tension bolts for mechanisms Type I, Type II and Type III, respectively
- T p,b :
-
Axial tensile capacity of bolt shank
- T p,tb :
-
Axial tensile capacity of bolt considering net cross-sectional area of threaded zone
- V p,t :
-
Pure plastic shear of the tension angle
- V t :
-
Shear force (i.e., beam flange force)
- V t1, V t2 and V t3 :
-
Shear forces for mechanisms Type I, Type II and Type III, respectively
- w b :
-
Width of bolt head across the two opposite flats
- θ :
-
Nondimensional relative rotation
- θ o :
-
Reference plastic rotation
- θ r :
-
Relative connection rotation
- σ y,b :
-
Yield stress of bolt’s material
- σ y,s :
-
Yield stress of the compression angle
- σ y,t :
-
Yield stress of the tension angle
References
Ahmed A (2002) Finite element analysis and modeling of M–θ r relation for connections with angles. PhD Dissertation, Department of Civil Engineering and Architecture, Muroran Institute of Technology, Muroran, Japan
Ahmed A, Hasan R (2015) Effect and evaluation of prying action for top- and seat-angle connections. Int J Adv Struct Eng 7(2):159–169
Ahmed A, Kishi N, Matsuoka KG, Komuro M (2001) Nonlinear analysis on prying of top- and seat-angle connections. J Appl Mec JSCE 4:227–236
American Institute of Steel Construction (2001) Manual of steel construction, load and resistance factored design, AISC, Chicago, I and II(2)
American Institute of Steel Construction (2010) Prequalified connections for special and intermediate steel moment frames for seismic applications, AISC358-10, Chicago
Azizinamini A, Bradburn JH, Radziminski JB (1985) Static and cyclic behavior of semi-rigid steel beam-column connections. Structural research studies, Department of Civil Engineering, University of South Carolina, Columbia, S. C., March
CEN (1997) Annex J, Design of Steel Structures − Part 1-1: Joints in building frames. Comite Europeen de Nomalisation, Brussels
CEN (2005) Design of steel structures—Part 1-8: design of joints, S.1.:s.n., Brussels, Belgium
Chen WF, Kishi N (1989) Semi-rigid steel beam-to-column connections: data Base and Modeling. J Struct Eng ASCE 115(1):105–119
Cheol MY, Young MK (2007) Cyclic behavior of bolted and welded beam-to-column joints. Int J Mech Sci 49:635–649
Colson A, Louveau JM (1983) Connections incidence on the inelastic behavior of steel structures. Proceedings of the Euromech Colloquium, p 174
Drucker DC (1956) The effect of shear on the plastic bending of beams. J Appl Mech 23(4):509–514
Elnashi AS, Elghazouli AY, Danesh-Ashtiani FA (1998) Response of semi-rigid steel frames to cyclic and earthquake loads. J Struct Eng 124(8):857–867
Frye MJ, Morris GA (1975) Analysis of flexibly connected steel frames. Can J Civil Eng 2(3):280–291
Garlock M, Ricles James M, Sause R (2003) Cyclic load tests and analysis of bolted top- and-seat angle connection. J Struct Eng 129(12):1615–1625
Harper WL (1990) Dynamic response of steel frames with semi- rigid connections. Structural research studies, Department of Civil Engineering, University of South Carolina, Columbia, S. C., May
Jones SW, Kirby PA, Nethercot DA (1980) Effect of semi-rigid connections on steel column strength. J Constr Steel Res 1(1):38–46
Jones SW, Kirby PA, Nethercot DA (1981) Modeling of semi-rigid connection behavior and its influence on steel column behaviour. In: Howlett JH, Jenkins WM, Stainsby R (eds) Joints in Structural Steelwork. Pentech Press, London, pp 5.73–5.78
Kishi N, Chen WF (1986) Data base of steel beam-to-column connections. Structural Engineering, Report No. CE-STR-86-26, School of Civil Engineering, Purdue University, West Lafayette, IN
Kishi N, Chen WF (1990) Moment- rotation relations of semi-rigid connections with angles. J Struct Eng ASCE 116(7):1813–1834
Kishi N, Komuro M, Chen WF (2004) Four-parameter power model for M-θ r curves of end-plate connections. Connections in steel structures V—behaviour, strength & design. In: Proceedings of the fifth international workshop, Amsterdam, The Netherlands, June 3–4
Lightfoot E, LeMessurier AP (1974) Elastic analysis of frameworks with elastic connections. J Struct Div ASCE 100(6):1297–1309
Lui EM, Chen WF (1983) Strength of H-columns with small end restraints. J Inst Struct Eng Lond 61B(1):17–26
Lui EM, Chen WF (1986) Analysis and behavior of flexibly jointed frames. Eng Struct J Buttersworth UK 8:107–118
Monforton AR, Wu TS (1963) Matrix analysis of semi-rigidly connected frames. J Struct Div ASCE 87(6):13–42
Pirmoz A (2006) Evaluation of nonlinear behavior of bolted connections under dynamic loads. MS thesis, Tehran (Iran): KN Toosi University
Pirmoz A, Khoei AS, Rezapour EM, Daryan AS (2009) Moment-rotation behaviour of bolted top-seat angle connections. J Constr Steel Res 65:973–984
Rathbun JC (1936) Elastic properties of riveted connections. Trans. ASCE, Paper No.1933, 101:524–563
Richard RM, Abbott BJ (1975) Versatile elastic-plastic stress-strain formula. J Eng Mech Div ASCE 101(4):511–515
Shen J, Astaneh-Asl A (1999) Hysteretic behavior of bolted-angle connections. J Constr Steel Res 51:201–218
Tarpy TS, Cardinal JW (1981) Behavior of semi-rigid beam-to-column end plate connections. In: Howlett JH et al (eds) Joints in structural steelwork. Pentech Press, London, pp 23–225
Weynand K, Jaspart JP, Steenhuis M (1995) The stiffness model of revised Annex J of Eurocode 3. In: Bjorhovde R, Colson A, Zandonini R (eds) Connections in steel structures III—proceedings of the 3rd international workshop on connections in steel structures
Author information
Authors and Affiliations
Corresponding author
Rights and permissions
Open Access This article is distributed under the terms of the Creative Commons Attribution 4.0 International License (http://creativecommons.org/licenses/by/4.0/), which permits unrestricted use, distribution, and reproduction in any medium, provided you give appropriate credit to the original author(s) and the source, provide a link to the Creative Commons license, and indicate if changes were made.
About this article

Cite this article
Ahmed, A. Prediction of moment–rotation characteristic of top- and seat-angle bolted connection incorporating prying action. Int J Adv Struct Eng 9, 79–93 (2017). https://doi.org/10.1007/s40091-017-0150-4
Received:
Accepted:
Published:
Issue Date:
DOI: https://doi.org/10.1007/s40091-017-0150-4