
Abstract
The present study aims to elucidate the possible sources of uranium and thorium content in the Campanian–Maastrichtian phosphorites from the Duwi Formation in the Nile Valley and Red Sea by conducting facies analysis and sequential leaching method. Nile Valley samples were collected from the El-Sibaiya East area, while those of the Red Sea were collected from two locations: Hamadat and Zug El Bahar. The petrographic investigation revealed that the Sibaiya East phosphorites exhibit peloidal bioclastic phospharenite–phospharudite microfacies, while Hamadat and Zug El Bahar phosphorites display peloidal bioclastic phosphalutite and silicified peloidal bioclastic phospharenite microfacies, respectively. Besides, U–Th bearing accessory minerals, such as zircon and monazite occur in Sibaiya East phosphorites. Thorium is present in Zug El Bahar phosphorites as minute accumulations associating apatite and quartz. Moreover, uranium is found with vanadium and iron as fine patches in the Sibaiya East phosphorite, and as small disseminations associated with Ca and Si in the Hamadat phosphorite. The X-ray diffraction shows that the investigated phosphorites are essentially built up of hydroxyl apatite Ca5(PO4)3(OH) and quartz SiO2. To accurately evaluate the bioavailability and mobility of uranium and thorium in the investigated phosphorites, it was necessary to identify the overall concentration and the various chemical forms of these elements by a five-step sequential leaching technique. The results indicate that Th and U are more abundant in the Red Sea phosphorites than in the Nile Valley phosphorites. Furthermore, Th is not bio-available and it is mostly found in the residue as Th-bearing minerals. Uranium, unlike Th is bio-available and fractionates among all fractions, indicating that U accumulation is the result of various diagenetic processes.
Introduction
The primary ingredients used to make phosphoric acid and phosphate fertilizers are phosphorites, which also have significant levels of U and other toxic trace elements. Therefore, U, Th, and other radioactive elements (226Ra,210Po, 210Pb, and 40K) are frequently present in phosphate rock-based P-fertilizers (El Afifi et al. 2009; Attallah et al. 2019; Qamouche et al. 2020). Furthermore, concerns about the environment arise from the high Th and U concentration in these deposits (Long et al. 2012). More attention has been paid to the presence of uranium in phosphate rocks that could potentially serve as a supply of uranium for the manufacturing of nuclear fuel (El Hwaiti et al. 2014).
Phosphate rocks are classified into two types: (1) sedimentary origin, which is the world’s main source of P (85% mined to manufacture fertilizers) and is formed from organic residues and (2) uncommon type, which is genetically related to igneous rocks of volcanic and carbonatitic origin and only marginally to metamorphic rocks (e.g., Roselli et al. 2009; Cordell and White 2011). The composition of these rocks shows slight to extreme variation from one deposit to another. Sedimentary marine phosphate deposits of the Upper Cretaceous and Eocene times contain almost the world’s phosphate rock reserves (Mohammed et al. 2022). In recent decades, the phosphate deposits of North Africa (Tunisia, Algeria, and Morocco), in addition the Middle East countries including Egypt have been intensively studied as they possess considerable resources of sedimentary phosphorites that experienced a gradual evolution during the Upper Cretaceous to Eocene (Kechiched et al. 2020). Igneous phosphate rock reserves are significant in Canada, Brazil, Finland, South Africa, Russia (U.S. Geological Survey 2017). Most of the worldwide phosphorite deposits are sedimentary origin and vary in the composition of their gangue materials, but generally fall into one of the three categories: siliceous, clayey, and calcareous ores (e.g., Abou El-Anwar et al. 2017; Bouabdallah et al. 2019; Farouk et al. 2020; Mousa et al. 2021). The compositions of these rocks vary from one deposit to another and vary even within the same deposit. Apatite shows varies ionic substitutions, whereas calcium in the structure can be substituted by Na+, Mg2+, Sr2+, Mn 2+, U4+, Th4+, Cd2+, and (REE3+) (Slansky 1980; Nathan 1984; Mac Mullan et al. 2011; Rustom et al. 2019). This can explain the trace element (e.g., REEs, Cd, and Th) enrichment in phosphorites (Jarvis et al. 1994). These trace elements may be either adsorbed onto the particle surfaces of Fe and Mn oxides, clay minerals, calcite, and organic matter or may be influenced by the occurrence of some heavy detrital minerals, such as monazite (Nathan 1984; Prévôt 1990; Jarvis et al. 1994; Bouabdallah et al. 2019).
The Egyptian phosphorites of economic significance occur in three important localities as follows: (1) from Safaga to Quseir along the Red Sea coastal area in the Central Eastern Desert, (2) along the Nile Valley from Idfu to Qena (near Sebaiya and El Mahammid, at Gabel Abu Had and Wadi Qena), and (3) at Abu Tartur plateau between the Kharga and Dakhla Oases in the Western Desert (Aita et al. 2013). Phosphorites in Egypt are almost sedimentary epicontinental marine and considered a potential source of uranium, with an average of about 70 ppm U and range from 50 to 250 ppm U, which is 15–66 times greater than that of Earth crust which is reported by Turekian and Wedepohl (1961) as 2.7 ppm (Finch et al. 1973; El-Arabi and Khalifa 2002).
Unlike uranium, in North Africa and Middle East, thorium has a more systematic distribution with low concentration. The phosphorites of Egypt in the Red Sea region have an intermediate value (from 1.12 to 5.89), and the lower values (from 0.6 to 2.3 ppm) were reported in the Nile Valley phosphorites (El Kammar and El Kammar 2002).
The mechanism by which the U and Th are enriched and accumulated in the phosphate ores is still debated and attributed to several reasons, such as; (1) Phosphate ores, which are considered as old marine fossiliferous carbonate deposits, are found in the chemical form of calcium phosphates [Ca3(PO4)2]. Uranium occurs naturally in two valences; the tetravalent U4+ and hexavalent U6+ forms. Uranyl ion (U6+) in seawater is reduced to U4+ before being emplaced in marine apatite, and then replaces Ca2+ as both of them have identical radius (Al-bassam 2007; Howari et al. 2016; Qamouche et al. 2020) The same procedure is also used for Th4+, with an ionic radius (0.102 nm) approaching to Ca2+ (0.099 nm) ionic radius. (2) Uranium and Th show no correlation with the major oxides, such as Ca or P. Therefore, U and Th concentrations may be attributed to organic matter adsorbing U and Th or by diagenetic process (Baturin 1971; Hassan and El Kammar 1975; Aita 2005; Negm 2014). Bouabdallah et al (2019) considered the possibility of U leaching by infiltrated waters.
Radiometrically, many studies were carried on the Nile Valley and Red Sea phosphorites (e.g., Zidan 2002; Negm 2014; Bishady et al. 2019). The mean value of eU reaches 85 ppm in the Sebaiya East phosphorites, and 68 ppm in the Red Sea phosphorites (Zidan 2002). In contrast, their Th content does not exceed 3 ppm. Consequently, their calculated activity concentrations are higher than the recommended values of UNSCAR (e.g., Issa et al. 2015).
In this contribution, many studies conducted on phosphate rocks from three areas in the Nile Valley (Sibaiya East area) and the Red Sea (Hamadat and Zug El Bahar areas), including field, petrography, mineralogy using Scanning Electron Microscope (SEM), and five-step sequential leaching procedure. The current study aims to adequately explain the source and variation of U and Th concentrations in the sedimentary marine phosphorites of the Duwi Formation, to trace U and Th behaviors in the three deposits, as well as to recognize the diagenetic processes that cause the accumulation of U and Th in these rocks.
Geology and lithostratigraphy
The Upper Cretaceous Duwi Formation and its lateral equivalents occurs as thin widespread shallow-marine deposits trending east–west belt spanning the middle latitudes of Egypt (Glenn and Arthur 1990). ENE–WSW faulting trend is prevailing in the Mesozoic sediments. These trend play an important role in controlling the configuration of the depositional basins in the area during Mesozoic. The phosphate deposits of Egypt are best developed in the Red Sea, Nile Valley and Kharga (El Shazly et al. 1979; Glenn et al. 1979). In the late Cretaceous times, the Red Sea region including the study area witnessed a particularly widespread transgression of the sea to the El Quseir area (Cherif 1975). Sediments belonging to this transgression are assigned in Egypt by the following rock units from base to top: Quseir variegated shale (Campanian), Duwi phosphate and Dakhla shale (Campanian–Masstrichtian).
The major phosphate rocks were formed in the Late Campanian to Early Masstrichtian as a part of the southern epicontinental shelf of the Neo-Tethys because west–southwest-blowing winds yielded an outpouring regime from the deeper Neo-Tethys Ocean onto the shelf areas (e.g., Powell and Moh’d 2011; Farouk et al. 2020). However, Egyptian phosphate deposits were generated in basins or swells that were created on stable shelf areas, primarily covering the Egyptian land southward up to the latitude of 24° N (Said 1962; Philobbos 1996; Zahran 2020).
The Egyptian phosphate rocks of the Duwi Formation (Campanian–Maastrichtian age) unconformably overly the variegated shale of the Quseir Formation (Santonian–Campanian) conformably underly the marine shales and marls of the Dakhla Formation (Maastrichtian–Middle Paleocene) (Baioumy and Tada 2005). The Duwi Formation is often composed of alternating beds of phosphate, oyster limestone, marl, shale, and sandstone. It is classified into three members (lower, middle, and upper) (Philobbos 1969) and the thickness of this formation exceeds 65 m (Baioumy et al. 2007). The Quseir Formation is mainly composed of clay intercalated with siltstones and conglomeratic phosphatic bed, while the Dakhla Formation with open marine facies is composed of marly limestone and shale with subordinate brownish sandstone. The Duwi Formation phosphorite samples were collected from the lower phosphate-bearing member in three locations: the Red Sea (the Hamadat and Zug El Bahar areas) and the Nile Valley (the Sibaiya East area) (Fig. 1).

Geologic map of Egypt with the locations of the studied areas, (modified after Spanderashvilli and Mansour 1970)
The Sibaiya East area is located on the Eastern bank of the Nile River as a part of the Idfu-Qena region and is bounded by latitudes of 25° 10ʹ–25° 15ʹ N and longitudes of 32° 35ʹ–32° 40ʹ E. Highlands from the east and a low-topographic limestone plateau from the west surround the studied area. It covers an area of about 0.90 km2 with a length of 1.1 km and a width of 0.8 km.
The Hamadat and Zug El Bahar areas are bounded by longitudes of 34° 00′–34° 20′ E and latitudes of 25° 40ʹ–26° 00″ N and located along the western shore of the Red Sea, representing landmarks in the Central Eastern Desert of Egypt. The Precambrian basement rocks of the Arabian Nubian Shield in the Eastern Desert of Egypt are unconformably overlain by a 500–700 m-thick section of the Upper Cretaceous–Middle Eocene strata (Khalil and McClay 2009). These sediments occur in Cretaceous sub-basins with axes trending mainly NW–SE and N–S. These basin-shaped en-echelon synclines are occupied by four fault blocks: Gihania, Gebel Atshan, Zug El Bahar, and Gebel Hamadat blocks (Abd El-Wahed et al. 2010; Aita et al. 2013).
The Sibaiya East area the Duwi Formation is composed mainly of phosphate beds intercalated with shale, marl, oyster limestone, and chert bands. It unconformably overlies the fluvial shale sequence of the Middle Campanian Qusier shale (Fig. 2) and conformably underlain by the deep marine shales and marls of the Late Maastrichtian to Early Paleocene Dakhla shale. The Duwi Formation is distinguished by the productive phosphorite bed divided into three horizons (A, B, and C) from the base to the top (Negm 2014). The lower horizon (A) represents a high economic phosphorite bed (approximately 3 m thick) (Fig. 3a, b), while the middle horizon (B) and upper horizon (C) are similar in thickness (approximately 0.5 m thick) and are not economically significant.

Composite lithostratigraphic section of Duwi Formation in the Sibaiya East area, Nile Valley, modified after El-Naggar (1966)

A Site location map (after Negm 2014) showing the location of collected samples, B Field photograph showing the lower phosphate-bearing Member of the Duwi Formation in the Sibaiya East area
The Hamadat and Zug El Bahar areas Phosphate beds of the investigated phosphorites are found interlayered with marl, shale, limestone, and sandstone interbeds. Figures 4 and 5A show the composite lithostratigraphic section of the Duwi Formation and the location of collected samples in the Red Sea region, respectively. The phosphorite samples are from the lower phosphate-bearing member approximately 0.8 m thick (Fig. 5B, C). It is divided into three small scale shallowing upward cycles, each of which is made up of mudstone, marl, bioturbated glauconitic marl, and limestone that grades upwards into hard phosphorite limestone ledge and is typically terminated by a radioactive phosphorite bed up to 40 cm thick.

Composite lithostratigraphic section of the Duwi Formation in the Red Sea region (modified after Aita et al. 2013)

A Geological map of Zug El Bahar–Hamadat area, Southwestern El Qusier (after Bosworth et al. 2021), B, C field photograph showing the phosphorite bed of the lower phosphate-bearing member of the Duwi Formation and the location of collected samples in the Zug El Bahar area, and the Hamadat area, respectively
Materials and methods
Eighteen representative samples were collected from the lower phosphate-bearing member of the Duwi Formation, distributed as, eight samples representing the Nile Valley phosphorites and ten samples representing the Red Sea phosphorites. Eighteen thin sections were prepared and examined by transmitted light polarized microscope (Olympus BX53) attached with digital camera for the petrographic study, and classified according to classification of Slansky (1980). The obtained phosphorites were gently crushed until they passed through a 0.125 mm sieve. Microscopic examination reveals that this size is sufficient for the release of the majority of particles. After grinding, quartering, and sieving the phosphorite samples into the sand-size fraction (63 µm), heavy minerals were separated by bromoform (sp. gr. 2.87 g/cm3) and the separation of zircon from the heavy fraction was carried out using methylene iodide (sp. gr. 3.33 g/cm3). The bulk composition of the phosphorite samples was determined by X-ray diffraction (XRD) techniques. The XRD patterns was obtained using Malvern Panalytical Empyrean X-ray diffractometer with CuKα1 radiation (λ = 1.5418 Å) operating at a tube voltage and current of 40 kV and 30 mA, respectively. Diffraction patterns were recorded in the range between 5º and 75º (2θ), and were compared with existing patterns in powder diffraction files (PDF).
U–Th-bearing accessory minerals picking up (zircon and monazite) was performed under a binocular microscope. Then, these minerals were examined by a scanning electron microscope (SEM Model Philips XL 30) connected with the EDX micro-analyzer at the Rock Studies Department, Nuclear Materials Authority of Egypt. The double thin sections (30 µm) were also investigated by SEM in order to recognize the modes of occurrence of uranium and thorium and their relations with the surrounding minerals.
P2O5 content (wt%) in the investigated samples was determined using the titration method, while Th and U contents (ppm) were determined by the XRF technique at the laboratories of Nuclear Materials Authority of Egypt. An energy dispersive X-ray fluorescence (EDXRF model NEX CG) was used and dried powdered samples (< 200 mesh) were supplied to minimize the mineralogical effect and reduce the extraneous scattering of X-ray, then mixed and compressed with boric acid. Tracking of thorium and uranium distribution was carried out using the five-step sequential leaching technique (Tessier et al. 1979), in which one gram of each grinded sample was weighted into a 40 ml PVC tube. The exchangeable fraction is obtained by extracting the samples with 8 ml of 1 M MgCl2 at neutral pH for 1 h. While the leaching of the carbonate-bound fraction is carried out using 8 ml of 1 M Na-acetate (adjusted to pH 5) for 5 h. Furthermore, the leaching of Fe–Mn oxy-hydroxides-bound fraction is carried out by 0.04 M hydroxylamine–HCl. Then, the mixed components are heated to 85 °C with stirring for two hours. The organic-bound fraction is extracted with 3 ml of 0.02 M HNO3 and 5 ml of 30% H2O2 (adjusted to pH2 with HNO3). The residual fraction is completely digested with a mixture of HF–HCI/HNO3. The recovery of Th and U ranges between 95 and 100% in each leaching step.
Results
Petrography and facies analyses
In the present study, the phosphorite samples belonging to the lower phosphate member of the Duwi Formation in Sebaiya East area are made up of phosphatic lithoclasts represented by interstitial phosphatic peloids (up to 500 µm in size) having different shapes, such as oval, subrounded, and irregular. The phosphatic lithoclasts and phosphatic bioclasts including teeth, and bone fragments represent about 73% of the volume of the whole rock. The collophane pellets represent about 63% of the phosphatic grains, which have dark brown color due to the associated hydrocarbon materials and are isotropic in cross-polarized light with pelletal structure (Fig. 6A). Bone fragments and teeth with sizes up to 1500 µm display a variety of shapes, including subangular, elongated, and prismatic forms. They are hazy in appearance, have a uniform internal structure, and are primarily composed of apatite that shows distinctive parallel extinction and represents about 10% of the Sibaiya East samples (Fig. 6B). The shell fragments are found embedded in calcitic matrix. The cement material is essentially made of fine neomorphic microspar with granular sparry calcite patches (Fig. 6C). Microcrystalline calcitic matrix represents about 10–30% of the whole rock, while carbonate matrix is found mixed with silica. The petrographic study suggests that the silica cementation which is recorded as microcrystalline silicate showing a mosaic pattern with tortuous contact may be followed by the carbonate cementation (Fig. 6D). According to the aforementioned findings, Sibaiya East samples show typical peloidal bioclastic phospharenite–phospharudite microfacies.

The Sibaiya East phosphorites showing: A peloidal bioclastic phospharenite–phospharudite, B collophane pellets (CP) and peloids cemented by carbonate. C Bone fragment embedded in carbonate matrix. D Silicate and carbonate cement
Zug El Bahar phosphorites are mainly composed of siliceous peloidal bioclastic phospharenite microfacies (Fig. 7A). The framework component is shown as follows: (1) phosphate particles account for approximately 65% of the total and are composed of subrounded to elongated structureless granules represent the phosphatic peloids with size up to 150 µm (Fig. 7B). Because of the organic matter, these particles have a dark brown color. (2) Bioclasts are shell and bone fragments that make up about 5% of the Zug El Bahar samples. (3) Detrital quartz grains and iron oxides patches and clots are the non-phosphate components (Fig. 7C). (4) Phosphorites are distinguished by the presence of authigenic silicate cement and the lack of carbonate (Fig. 7D). The authigenic silicate cement is composed of cryptocrystalline to microcrystalline secondary spherulitic quartz and accounts for approximately 30%. Less than 10% of the examined phosphorites detrital quartz, present as matrix as polycrystalline grains embedded in the groundmass, or equant microcrystals in cement. Apatite has been replaced in bones by iron oxides. Besides, zircon (Fig. 7E) and monazite (Fig. 7F) crystals are found in the investigated phosphorites as minute crystals showing high interference color, embedded in the cement, indicating their detrital origin because of their heterogeneity and eroded nature, which could reflect different source rocks and/or variable diagenetic history (El-Sankary and Mahdy 2006).

The Zug El Bahar phosphorites showing: A silicified peloidal bioclastic phospharenite facies, B subrounded and irregular peloids, shell and bone fragments embedded in silicified matrix, C detrital quartz grains (Qz) in the investigated phospharenite, D polycrystalline quartz and authigenic silica spherules (silica overgrowth) present as matrix, E subhedral zircon crystal imbedded in the silicate matrix, F subrounded monazite grain embedded in the silicate matrix and cement
Hamadat phosphorites are typical peloidal bioclastic phosphalutite microfacies (Fig. 8A). They contain the least amount of phosphate pellets (approximately 60%), which are between 50 and 100 µm in size. The percentage of bone fragments is roughly 5% (Fig. 8B). About 35% of the rock composition in these phosphorites is made up of matrix, which is mostly silicate and carbonate. Muscovite, sparry calcite, and detrital quartz grains make up the majority of the non-phosphate components (Fig. 8C–E). It is important to note that organic materials are identified in the Hamadat samples as smeared graphite (Fig. 8F).

The Hamadat phosphorites showing, A peloidal bioclastic phosphalutite, B subrounded and ovulitic peloids and fractured and partially phosphatized bone fragment, C phosphatic components embedded in micritic matrix, D detrital muscovite and quartz grains scattered into the silicate and carbonate matrix, E sparry calcite embedded in the silicate matrix, F organic matter showing smeared texture
The X-ray diffraction shows that the investigated phosphorites are essentially built up of hydroxyl apatite Ca5(PO4)3(OH) and quartz SiO2 (Fig. 9A–C). Dolomite grains are commonly associated with the phosphatic phase in the Sebaiya East phosphorites(Fig. 9A).

X-ray diffractograms for the studied phosphorites of A Sibaiya East (Sample S2), B Zug El Bahar (Sample Z1), and C Hamadat (Sample H1)
Forms of thorium and uranium in the investigated phosphorites
To identify the forms of Th and U in the examined phosphorites, the geochemical analysis was conducted to the recorded detrital grains and the thin section of the investigated phosphorites as well by using SEM. As a result, zircon and monazite were recorded. Their non-stoichiometric forms and the presence of Ca and P with high concentrations in their EDX analyses are due to the diagenetic cementation of the investigated phosphorites.
-
(A)
Zircon (ZrSiO4) It was recorded in the Sibaiya East phosphorites within the carbonate cement as subhedral grains (Fig. 10A, B). The photomicrograph of the separated zircon crystals is shown in Fig. 10C.
Fig. 10 
A, B EDX and BSE images, C photomicrograph of zircon mineral, the Sibaiya East phosphorites
-
(B)
Monazite (Ce,La,Nd,Th)(PO4) It was recorded in the Sibaiya East phosphorites associated with apatite as bright patches (Fig. 11A, B).
Fig. 11 
EDX and BSE images of monazite mineral, the Sibaiya East phosphorites
-
(C)
In addition, thorium and uranium were recorded associated with different cementing materials in the investigated phosphorites, where in Zug El Bahar samples, U and Th were associated with the silicate cement in the form of minute disseminations. The EDX data show the content of Th and U in these disseminations (Fig. 12). In the Sibaiya East phosphorites, uranium was found associated with ferruginous cement as tiny patches. The composition of them is revealed by the EDX in Fig. 13. In Hamadat phosphorites, U was recorded associated with Si and Fe as inclusions in apatite. The EDX data show their concentrations in Fig. 14.
Fig. 12 
EDX and BSE images of disseminated Th and U in Zug El Bahar phosphorites
Fig. 13 
EDX and BSE images of uranium patches in Sibaiya East phosphorites
Fig. 14 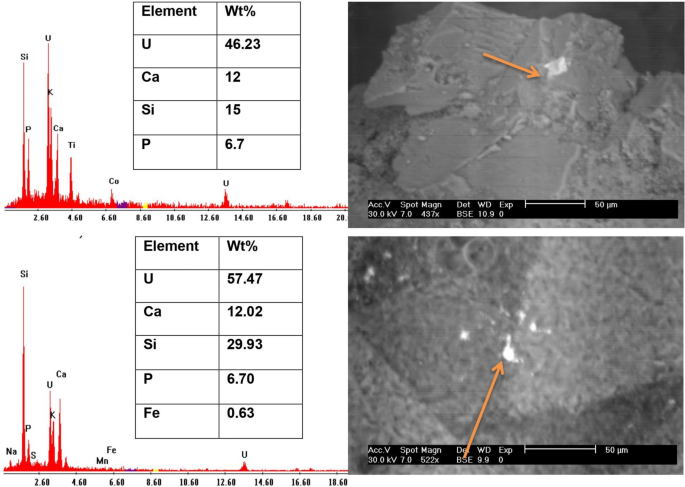
EDX and BSE images disseminated uranium in Hamadat phosphorite


Geochemistry of P, U, and Th
Apatite is predominantly the source of phosphorus concentration in the analyzed samples (Table 1). The P2O5% content of the studied phosphorites in the Sibaiya East ranges from 21.3 to 31% with an average of 27%. This value matches the average (27.6%) given by Bishady et al. (2019). It ranges from 18 to 29% with an average of 26.6% in the Hamadat area, while the highest content of P2O5 is recorded in the Zug El Bahar, which ranges from 29 to 33.4% with an average of 30.9%.
The uranium content in the Sibaiya East ranges from 23 to 44 ppm with an average of 35.5 ppm, which is lower than that given by Bishady et al. (2019). In the Hamadat area, U ranges from 40 to 50 ppm with an average of 44 ppm, which is lower than the average value (54.5 ppm) given by El Kammar and El Kammar (2002). The highest uranium content was recorded in the Zug El Bahar area, which ranges from 38 to 57 ppm, with an average of 47 ppm. On the other hand, the least content of thorium is detected in the Sibaiya East (average = 0.68 ppm), in Hamadat the average content of thorium is 5.2 ppm, while Zug El Bahar samples show the highest thorium concentration (average = 10.2 ppm) (Table 1).
Fractionation of thorium and uranium
Sediments include heavy metals in a variety of chemical forms. In terms of mobility, bioavailability, and potential toxicity, they exhibit diverse behaviors (Li et al. 2000). Their distribution is based on cation exchange, specific adsorption, precipitation, complexation, and pH value in the soil. Metal mobility and bioavailability decrease with extraction sequence order, and hence the strength of the chemical reagents needed in extraction increases with sequence. The bioavailability of heavy metals diminishes in the following order, depending on their relative mobility in various chemical forms: exchangeable > carbonate > Fe–Mn oxy-hydroxides > organic > residual (Tessier et al. 1979). With rising acidity, metals included in the carbonate/adsorbed phases become more mobile and readily available due to the leaching of carbonate and liberation of metal, in contrast to those bound to the exchangeable fraction, which are always available. The sediment components hold metals associated with the reducible and oxidizable fractions more tightly than these two fractions. The remaining fraction is thought to represent the inert phase in which metals are incorporated into the crystalline minerals. (Tessier et al. 1979). This makes the metals in the residual fraction unavailable to the bio-system (Li and Thornton 2001).
-
(i)
The exchangeable fraction (soluble)
In this step, the reagent does not attack organic materials, silicates, or metal sulfides. Weakly sorbed metal species, particularly those kept on the soil surface by relatively weak electrostatic contacts, and those that can be released by ion-exchange processes, would be removed in this step.
-
(ii)
The carbonate-bound fraction (acid soluble)
According to Gleyzes et al. (2002), trace metals recovered from soil and sediments with sodium acetate (1 M) adjusted to pH 5 may have been particularly sorbed to low energy sites on the surfaces of clay minerals, organic matter, and oxide minerals. As a result, heavy metals retrieved within this fraction are weakly bound and can be released under acidic circumstances (pH 5).
-
(iii)
The Fe–Mn oxy-hydroxides fraction (reducible)
Iron and manganese oxides are effective metal scavengers. Dissolution of some or all metal-oxide phases can be accomplished by adjusting the Eh and pH of reagents by adding 0.04 M hydroxylamine–HCl to the residue. Then, the mixed components are heated to 85 °C with stirring for two hours.
-
(iv)
The organic fraction (oxidizable)
Organic matter plays a crucial role in metal distribution and dispersion via chelating and cation exchange processes. A interaction between a metal ion and an organic ligand produces species that can be precipitated directly or adsorbed on soil materials during this phase.
-
(v)
The residual fraction
The majority of this fraction is made up of primary and secondary minerals with metals in their crystalline lattices. Their decomposition is accomplished through digestion with strong acids such as HF, HClO4, HCl, and HNO3.
Based on the above idea, the results of sequential leaching conducted on Th and U from the studied rocks are shown in (Tables 2 and 3). The sequential leaching data demonstrates that the recovery of Th and U elements ranges from 95 to 100% in each leaching step. The obtained data indicates that Th is mostly present in the residual state (Table 2), with smaller amounts being present in the exchangeable, carbonate, and Fe–Mn-hydroxide-bound fractions. Uranium, on the other hand, presents challenges in speciation due to its multivalent nature (U4+ and U6+) and is therefore fractionated among all fractions (Fig. 15). The highest quotient of U is determined in the exchangeable form from the Zug El Bahar (41%) and the Sibaiya East (37%) phosphorites, while the lowest quotient is measured in the Hamadat samples (29%). Besides, U is present in appreciable quantities as organic forms, distributed as, 30% in the Hamadat, 26% in the Zug El Bahar, and 19% Sibaiya East phosphorites.

A Speciation of uranium in the studied phosphorites, B–D Average partition recovery of uranium in the Sibaiya East, Zug El Bahar, and Hamadat phosphorites, respectively
In addition, the sequential leaching data show that the highest quotient of carbonate-bound uranium belongs to Hamadat phosphorites (18%), followed by Sibaiya East (15%), and the Zug El Bahar (12%). The presence of Fe–Mn-hydroxide-bound U (24% in the Sibaiya East, 19% in the Hamadat and 18% in the Zug El Bahar phosphorites, respectively). The minor quotient of uranium (5% in the Sibaiya East, 4% in the Hamadat, and 3% in the Zug El Bahar phosphorites) is bounded to the residual fraction, also U is incorporated into the apatite structure as a result of U4+replacing Ca2+ by substitution mechanism (Altschuler 1980; McClennan 1980).
Discussion
The high content of U associated with phosphorites increases the economic significance of these deposits (Ewing and Wang 2002; Buccione et al. 2021). Many scholars have offered various explanations for the high concentrations of U and Th in phosphate rocks, including the possibility that U4+ and Th4+ can replace Ca2+ in the apatite lattice due to their similar ionic radii (Altschler 1980). North Africa phosphorites vary in their U and Th content which is attributed to the replacement process in apatite, whereas the average concentration of U in Moracco, Algeria, and Tunisia is 135.4, 47.5, and 28.3 ppm, respectively. In contrast, Th exists in lower concentrations, whereas the average concentration of Th in Algeria, Tunisia, and Moracco is 17.7, 9, and 3.5 ppm, respectively (Qamouche et al. 2020). The average U and Th contents in ppm of various phosphorites from Egypt and other countries are listed in Table 4. The physico-chemical controls, which prevailed during the secondary uptake of U, vary because the media is organic rich. Phosphorite provides appropriate conditions for the fixation of soluble uranium during its reduction from the hexavalent to the tetravalent state. As such, uranium accumulation is primarily determined by the concentration of uranium in groundwater and the time of exposure to that water. The uranium exchange between phosphate particles and groundwater is controlled by the Eh of the groundwater (Weinberg and Cowart 2001). Based on this possibility, U only enters the apatite crystal lattice in the tetravalent form, which requires the oxidation hexavalent form (U6+) of the uranium in the water to be reduced. Besides, some studies have demonstrated that U in carbonate apatite (Tzifas et al. 2017) and synthetic fluorapatite (Luo et al. 2009) occurs often in the form of U(IV) compounds. Another idea argues that organic matter plays a crucial role in the accumulation of Th and U in the phosphate rocks by adsorbing on its surfaces (Aita 2005). Diagenesis played a critical role in phosphogenesis (Muscente et al. 2015), during which the phosphate mineral phase transformed as the thermodynamically unstable authigenic apatite phases, including octacalcium phosphate (OCP) and hydroxyapatite (HAP), would eventually transform into carbonate fluorapatite (CFA) (Yang et al. 2022). The fluctuation in major and trace element abundance is related to a change in the environmental state of deposition (seawater content) (Boulemia et al. 2021). Also, the enrichment of the trace elements, REEs and uranium was assumed to take place during diagenesis as the intensive post-depositional diagenetic processes, which can be explained by fractionation with seawater or continental fluids at low temperature, under crystal-chemical, control involving substitution mechanism and the context of “extensive” or “late” diagenesis (El Kammar and El Kammar 2002). This led to the liberation of uranium from the apatite lattices and migration to the phosphorite beds (Aita et al. 2013; Abou El-Anwar et al. 2017).
Metals are transported in supergene settings by many methods, which are influenced by the existing physico-chemical conditions. Sequential (or selective) leaching is a typical method for identifying the forms of metal hence it was used in the speciation of U and Th in the investigated phosphorites. The first stage in determining how much uranium and thorium can be recovered is identifying the chemical forms, or partitioning, of those metals in phosphate rocks. Because metals exist in diverse forms and have varying potentials for recovery, several factors, such as the type of metal conditions, influence whether a metal can be recovered or not. To explore these physico-chemical forms, better comprehend the factors that affect element recoverability, and provide insight into the mechanisms of retention and release involved in migration and decontamination, sequential leaching techniques have been largely utilized (Cabral and Lefebvre 1998; Hisham and Randa 2009).
Accordingly, thorium occurs often in the residual state in the studied samples based on sequential leaching. This remaining fraction is thought to be a representation of the non-reactive phases where metals enter the crystal lattice of crystalline mineral phases. (Tessier et al. 1979). Therefore, Th in the residual fraction can be interpreted as a result of the immobile nature of its tetravalent state under supergene environments. However, extremely acidic environments have been demonstrated to facilitate the mobility and removal of Th (Cortizas et al. 2002). Nevertheless, metals in the remaining fraction are unavailable to the bio-system. The phosphorites of the Red Sea region show the highest concentration of Th, up to 12 ppm for the Zug El Bahar area and 8.5 ppm for the Hamadat area, while the Sibaiya East area in the Nile valley shows the least Th (up to 2.7 ppm). The microscopic study and EDX data display the dominance of fine dissemination of Th in Zug El Bahar, zircon and monazite in both of the Hamadat and Sibaiya East phosphorites. It can be attributed to the predominance of thorite and uranothorite minerals in the surrounding rocks and stream sediments (El Kammar et al. 2020). These findings conforms well with El-Sankary and Mahdy (2006), who suggest that winnowing and strong bottom currents in the shallow-marine habitats of the Western Desert phosphorite basin resulted in the concentration of heavy detritus within phosphorites. This implies that Th is not bio-available and its concentration in these rocks is mostly related to some accessory minerals, suggesting a low risk of Th-containing fertilizers (Vogel et al. 2020).
The exchangeable form is more mobile than other forms and can release its metal load by reducing pH, making it a sensitive indication of mobility and bioavailability. Uranium is fractionated among all fractions and occurs in the exchangeable form in the majority of samples (ranging from 29 to 41% in the investigated phosphorites). Carbonates can be employed as accumulators for U, which is typically compatible with the presence of uranium within the carbonate cement in the Hamadat phosphorites. According to the availability of carbonate cement, uranium can be fractionated in the following order: Hamadat > Sibaiya East > Zug El Bahar. Besides, the presence of Fe–Mn-hydroxide-bound U cannot be avoided and is ascribable to the ferrugination process. This causes adsorption of U on the surface of iron oxides in the investigated phosphorites whereas Fe(II) is considered as an important reducing agent for U(VI) depending on the chemical conditions in the aqueous solution (Regenspurg et al. 2009). The adsorption via surface complexation of some trace elements including uranium and vanadium take place on goethite under different pH conditions (Peacock and Sherman 2004).
The sequential leaching displays the existence of a relatively high quantity of the organic-bound U, which is also enhanced by the presence of organic materials in these phosphate rocks. Besides, the residual fraction remaining after the sequential leaching contains the least U present in the samples, suggesting that the majority of uranium is not hosted in the apatite structure. This agrees with the findings of Aswathanarayana (1985) who concluded that the organic materials in permeable rocks are the favored conditions for uranium precipitation. Uranium presence in the Nile Valley and Red Sea phosphorites can be due to the post-depositional processes (Hassan and El Kammar 1975).
Conclusion
The present study was carried out on the phosphorites of the Nile Valley (Sibaiya East area) and the Red Sea (Hamadat and Zug El Bahar areas) to elucidate the natural distribution of both uranium and thorium.
-
The petrographic study revealed diversity in composition and the presence of three main microfacies: (1) peloidal bioclastic phospharenite–phosphrudite facies, which characterize the Sibaiya East phosphorite; (2) silicified peloidal bioclastic phospharenite microfacies, which characterize Zug El Bahar phosphorites; and (3) peloidal bioclastic phosphalutite microfacies, which characterize the Hamadat phosphorite.
-
The mineralogical investigation revealed the presence of U- and Th-bearing minerals such as zircon and monazite in the Sibaiya East phosphorites. In additions, Th is present in the Zug El Bahar as minute accumulations scattered in the silicate matrix. Moreover, U is also present as fine dissemination associated with V in the Sibaiya East phosphorites, and associated with Ca and Si in the Hamadat phosphorites
-
Several diagenetic processes played the master role in the distribution of U and Th in the investigated phosphorites, where their occurrence is controlled by the type of cementing material and matrix. Thorium was recorded in the Hamadat phosphorites, where the silicate cement and matrix were dominant. In contrast, U was found associated with the ferruginous and carbonate cements in the Sibaiya East and Zug El Bahar phosphorites.
-
The sequential leaching data conform well with the mineralogical study. It indicated that U and Th are more abundant in the Red Sea phosphorites when compared to the Nile Valley phosphorites.
-
Th is not bio-available and mostly exists in the residual state with minor contribution of the other fractions. Its presence seems to be controlled by the terrigenous influx to the depositional basins.
-
On the contrary, U exhibits various behaviors. Then, the idea that apatite structure is the only component of U accumulation via substitution mechanism in phosphate rocks, is not proved as U in the exchangeable form represents only about 3–5% of the total U content. Uranium fractionates among all fractions and frequently occurs in an exchangeable form (the exchangeable form of uranium represents more than one third of the total uranium content). However, numerous other processes, including adsorption by organic matter, early and post diagenetic processes led to the their enrichment and concentration. The various diagenetic process causes accumulation of about 60% of total U content.
Data availability
The data and materials used in this study are available on request with the corresponding author and are not available publicly due to ongoing research.
References
Abd El-Wahed M, Ashmawy M, Tawfik H (2010) Structural setting of Cretaceous pull-apart basins and Miocene extensional folds in the Quseir-Umm Gheig region, northwestern Red Sea, Egypt. Lithosphere 2(1):13–32
Abou El-Anwar E, Mekky H, Abd El Rahim S, Aita S (2017) Mineralogical, geochemical characteristics and origin of Late Cretaceous phosphorite in Duwi Formation (Geble Duwi Mine), Red Sea region, Egypt. Egypt J Petrol 26:157–169
Ahmed EA (1986) Chemical characterization of francolite from Red Sea and Nile Valley phosphorite deposits. Bull Fac Sci Assiut Univ 15(2):83–101
Aita SK (2005) Geology and radioactivity of phosphate bearing rocks, northeastern Sinai, Egypt. Ph.D. Thesis, Fac of Sc., Cairo Univ., p 162
Aita SK (2015) Uranium mobilization from Campanian-Maastrichtian phosphatic rocks, Ain Giffara Formation, Gabal El Hefhuf locality, Bahariya Oasis, Western Desert, Egypt. Sedimentol Egypt 22:111–122
Aita SK, Abdallah SA, Darwish MM (2013) Geological setting and radioactivity of the Campanian phosphorite of the Duwi Formation in Gehania Area, Southwestern El Quseir, Red Sea Coast, Egypt. Sedimentol Egypt 21:119–130
Al-bassam KS (2007) Uranium in the iraqi phosphorites. Iraqi Bull Geol Min 3(2):13–31
Al-Hawaiti M, Tardio J, Reynolds H, Bhargava S (2014) Selectivity assessments of a sequential leaching procedure for potential trace metals’ mobility and bioavailability in phosphate rocks from Jordan phosphate mines. Soil Sediment Contam 23:417–436
Altschuler ZS (1980) The geochemistry of trace elements in marine phosphorites, part I: characteristic abundances and enrichment. SEPM Publ 29:19–30
Ames LL (1959) The genesis of carbonate apatite. Econ. Geol., Dututh. USA, pp 827–841
Aswathanarayana U (1985) Principles of nuclear geology. Oxonian press, pvt. Ltd., New Delhi, pp 1–397
Attallah MF, Metwally SS, Moussa SI, Soliman MA (2019) Environmental impact assessment of phosphate fertilizers and phosphogypsum waste: elemental and radiological effects. Microchem J 146:789–797
Baioumy H, Tada R (2005) Origin of late cretaceous phosphorites in Egypt. Cretaceous Res 26:261–275
Baioumy H, Tada R, Gharaie MHM (2007) Geochemistry of Late Cretaceous phosphorites in Egypt: Implication for their genesis and diagenesis. J Afr Earth Sci 49:12–28
Baturin GN (1971) Stage of phosphorite formation on the ocean floor. Nat Phys Sci 232:61–62
Bishady AM, Farag NM, Mira HI, El Sawey EH, Negm SH (2019) A contribution to the geochemistry of El Sibaiya phosphorites, Nile Valley, Egypt. Nucl Sci Sci J 8:39–59
Bosworth W, Khalil SM, Ligi M, Stockli DF, McClay KR (2021) Geology of Egypt, The Northern Red Sea, pp 344–369
Bouabdallah M, Elgharabi S, Horchani-Naifer K, Barca D, Fattah N, Ferid M (2019) Chemical, mineralogical and rare earth elements distribution study of phosphorites from Sra Ouertane deposit (Tunisia). Afr Earth Sci 157:103505
Boulemia S, Hadji R, Hamimed M (2021) Depositional environment of phosphorites in a semiarid climate region, case of El Kouif area (Algerian–Tunisian border). Carbon Evapor 36(3):1–15
Buccione R, Kechiched R, Mongelli G, Sinisi R (2021) REEs in the North Africa P-bearing deposits, paleoenvironments, and economic perspectives: a review. Minerals 11:214. https://doi.org/10.3390/min11020214
Cabral AR, Lefebvre G (1998) Use of sequential extraction in the study of heavy metal retention by silty soils. Water Air Soil Poll 102:329–344
Cherif OH (1975) Tectonique et sédimentation des basins sédimentaries du Sinai nord et du Golfe de Suez pendant le Secondaire. Bull Inst d’Egypte. 54:40
Cordell D, White S (2011) Peak phosphorus: clarifying the key issues of a vigorous debate about long-term phosphorus security. Sustainability 3:2027–2049
Cortizas AM, Varela EP, Rebolo RP (2002) Distribución de algunos elementos metálicos (Cr, Mn, Ni, Cu, Zn, Pb, Th) y arsénico en dos suelos policíclicos podsólicos. Edafología 9(1):85–102
El Aassy IE, Botros NH, Shahata MR (1992) Geology and uranium distribution in the phosphorite beds, Gabal Qabeliat, southwestern Sinai (new occurrence). In: Proc. 3rd Conf. Geol. Sinai. Develop., Ismailia, pp 209–216
El Afifi EM, Hilal MA, Attallah MF, El-Reefy SA (2009) Characterization of phosphogypsum wastes associated with phosphoric acid and fertilizers production. J Environ Radioact 100:407–412
El Arabi AEGM, Khalifa IH (2002) Application of multivariate statistical analyses in the interpretation of geochemical behaviour of uranium in phosphatic rocks in the Red Sea, Nile Valley and Western Desert, Egypt. J Environ Radioact 61(2):169–190
El Kammar A, El Kammar M (2002) On the trace elements composition of the Egyptian phospharenite. A new approach. In: 6Th inter. Conf. of the Arab world, Cairo Univ., pp 227–244
El Naggar ZR (1966) Stratigraphy and classification of type Esna Group of Egypt. AAPG Bull 50(7):1455–1477
El-Sankary M, Mahdy AI (2006) The heavy minerals associating phosphorites of the western desert of Egypt: possible supplier of trace elements and provenance indicator. In: Proceedings of the 7th international conference on geochemistry, Faculty of science, Alexandria University, Alexandria, Egypt, 6–7 Sept. VII, pp 15–30
El Shazly EM, Salman AB, Aly MM, El Aassy IE, El Rakaiby MM (1979) Discovery of phosphates in the Northern Eastern Desert, Egypt. Ann Geol Survey Egypt, V.IX
El-Kammar A, El-Wakil M, Abd El-Rahman Y, Fathy M, Abdel-Azeem M (2020) Stream sediment geochemical survey of rare elements in an arid region of the Hamadat area, Central Eastern Desert, Egypt. Ore Geol Rev 117:103287. https://doi.org/10.1016/j.oregeorev.2019.103287
Ewing RC, Wang L (2002) Phosphates as nuclear waste forms. Rev Miner Geochem 2002(48):673–699
Farouk S, Ahmad F, Baioumy H, Lehmann B, Mohammed IQ, Al-Kahtany K (2020) Geochemical characteristics of carbonaceous chalk near the Cretaceous/Paleogene transition, central Jordan: strong metal enrichment of redox-sensitive and biophile elements from remineralized calcitic plankton. Mar Petrol Geol 120:104535
Finch WI, Butler AP, Armstrong FC, Weissenebron AE (1973) Nuclear fuels-uranium. US Geol Surv Prof Paper 820:456–468
Geological Survey (2017) Mineral commodity summaries, 2017. Phosphate Rock. U.S. Geological Survey. https://doi.org/10.3133/70180197
Germann K, Bock WD, Schroter T (1985) Properties and origin of upper Cretaceous Campanian phosphorites in Egypt. Sci Geol Memoir 77:23–33
Glenn CR, Arthur MA (1990) Anatomy and origin of Cretaceous phosphorite-greensand giant, Egypt. Sedimentology 37:123–154
Glenn CR, Mansour SEA (1979) Reconstruction of the depositional and diagenetic history of phosphorites and associated rocks of the Duwi Formation (late Cretaceous) Eastern Desert, Egypt. Ann Geol Surv Egypt IX:388–407
Gleyzes C, Tellier S, Astruc M (2002) Fractionation studies of trace elements in contaminated soils and sediments: a review of sequential extraction procedures. Trends Anal Chem 21:451–467
Hassan F, El Kammar AM (1975) Environmental conditions affecting the accumulation of uranium and rare earth’s in Egyptian phosphorites. Egypt J Geol 19(2):169–178
Hisham KF, Randa ME (2009) Environmental geochemistry for heavy metals and uranium potentiality in oil shale sediments, Quseir, Red Sea, Egypt. J Appl Sci Res 5(8):914–921
Howari F, Goodell P, Salman A (2016) Metallogenic evolution of uranium deposits in the Middle East and North Africa deposits. J Afr Earth Sci 114:30–42
Issa SA, Mostafa AM, Lotfy AM (2015) Radiological impacts of natural radioactivity in phosphate rocks from El-Sibaiya and Red Sea coast mines, Egypt. J Radioanal Nucl Chem 303:53–61
Jarvis I, Burnett WC, Nathan J, Almbaydin FSM, Attia AKM, Castro LN, Flicoteau R, Hilmy ME, Husain V, Quitwanah AA, Serjani A, Zanin Y (1994) Phosphorite geochemistry: state-of-the-art and environmental concerns. Eclogae Geol Helv 87:643–700
Khalil SM, McClay KR (2009) Structural control on syn-rift sedimentation, northwestern Red Sea margin, Egypt. Mar Pet Geol 26(6):1018–1034
Li XD, Thornton I (2001) Chemical partitioning of trace and major elements in soil contaminated by mining and smelting activities. Appl Geochem 16:1639–1706
Li XD, Shen ZO, Way WH, Li YS (2000) Chemical partitioning of heavy metal contaminants in sediments of pearl River Estuary. Chem Spec Bioavail 12:17–25
Long KR, Gosen BSV, Foley NK, Cordier D (2012) The principal rare earth elements deposits of the United States: a summary of domestic deposits and a global perspective. Non-renewable resource issues. Springer, Dordrecht, pp 131–155
Luo Y, Hughes JM, Rakovan J, Pan Y (2009) Site preference of U and Th in Cl, F and Sr apatites. Am Mineral 94:345–351
Mac Mullan P, McMahon G, McCarthy G (2011) Detection of basic calcium phosphate crystals in osteoarthritis. Jt Bone Spine 78:358–363
Nathan Y (1984) The mineralogy and geochemistry of phosphorite. Phosphate Min 8:275–291
McLennan SM (1980) Geochemistry of Archean shale from the Pilbara Supergroup, Western Australia. Geochim Cosmochem Act 47(7):1211–1222
Mohammed IQ, Farouk S, Mousa A, Lawa FA (2022) Lithofacies types, mineralogical assemblages and depositional model of the Maastrichtian-Danian successions in the Western Desert of Iraq and eastern Jordan. J Afr Earth Sci 186:104397
Mousa AK, Al-Dulaimi SI, Mohammed IQ (2021) Microfacies analysis of the late Maastrichtian-Danian phosphatic succession in the H3-trebeel district, western desert of Iraq. Iraqi J Sci 62(4):1188–1203
Muscente AD, Hawkins AD, Xiao S (2015) Fossil preservation through phosphatization and silicification in the Ediacaran Doushantuo Formation (South China): a comparative synthesis. Paleogeogr Palaeocl 434:46–62
Negm SH (2014) Radioactivity and geochemical studies of the Nile Valley phosphorites, Egypt. PhD thesis, Faculty of Sciences, Minufiya University, p 152
Peacock CL, Sherman DM (2004) Vanadium (V) adsorption onto goethite (FeOOH) at pH 1.5 to 12: a surface complexation model based on initio molecular geometries and EXAFS spectroscopy. Geochim Cosmochim Acta 68:1723–1733
Philobbos ER (1969) Geology of the phosphate of the Nile Valley. Ph.D. Thesis, Assuit University, Egypt
Philobbos E (1996) The phosphatic sediments of the Nile Valley and Eastern Desert in the view of the Upper Cretaceous–Lower Tertiary sedimentation tectonics. Geol Soc Egypt 2:313–352
Powell J, Mohd B (2011) Evolution of cretaceous to eocene alluvial and carbonate platform sequences in central and south Jordan. Geoarabia 16(4):29
Prévôt L (1990) Geochemistry, petrographie, genesis of cretaceous-eocene phosphorites: the gnatour deposits (Morocco): a type example. Memoires Societé Géologique Francaise, pp 158–230
Qamouche K, Chetaine A, Elyahyaoui A, Moussaif A, Touzani R, Benkdad A, Asmil H, Laraki K, Marah H (2020) Radiological characterization of phosphate rocks, phosphogypsum, phosphoric acid and phosphate fertilizers in Morocco: an assessment of the radiological hazard impact on the environment. Mater Today Proc 27:3234–3242. https://doi.org/10.1016/j.matpr.2020.04.703
Roselli C, Desideri D, Meli MA (2009) Radiological characterization of phosphate fertilizers: comparison between alpha and gamma spectrometry. Microchem J 91(2):181–186
Rrgenspurg S, Schild D, Schafer T, Huber F, Mamstrom ME (2009) Removal of uranium(VI) from the aqueous phase by iron(II) minerals in presence of bicarbonate. Appl Geochem 24:1617–1625
Rustom LE, Poellmann MJ, Johnson AJW (2019) Mineralization in micropores of calcium phosphate scaffolds. Acta Biomater 83:435–455
Said R (1962) The geology of Egypt. Elsevier, Amsterdam, p 377
Scholten LC, Timmermans CWM (1995) Natural radioactivity in phosphate fertilizers. Fertil Res 43(1):103–107
Slansky M (1980) Géologie des phosphates sédirnentaires, Thèse de doctorat 3ème cycle. Mémoires Bureau De Recherches Géologiques et Minières, pp 114 l-92
Spanderashvilli GI, Mansour M (1970) The Egyptian phosphorites. In: Moharram O (ed) Studies on some mineral deposits of Egypt, pp 89–06
Tessier APGC, Campbell PG, Bisson MJAC (1979) Sequential extraction procedure for the speciation of particulate trace metals. Anal Chem 51(7):844–851
Turekian KK, Wedepohl KH (1961) Distribution of the elements in some major units of the earth’s crust. Geol Soc Am Bull 72:175–33192
Tzifas IT, Glasmacher UA, Misaelides P, Godelitsas A, Gamaletsos PN, Goettlicher J, Francoso de Godoy D (2017) Uranium-bearing francolites present in organic-rich limestones on NW Greece: a preliminary study using synchrotron radiation and fission track techniques. J Radioanal Nucl Chem 311:465–472
U.S. Geological Survey (2017) Tungsten statistics. In Kelly TD, Matos GR (eds) Historical statistics for mineral and material commodities in the United States: U.S. Geological Survey Data Series, p 140. https://doi.org/10.3133/ds140
UNSCEAR (2000) Sources and effects of ionizing radiation. In: UNSCEAR 2000 Report to the General Assembly, with Scientific Annexes; United Nations Scientific Committee on the Effects of Atomic Radiation: Vienna, Austria
Vogel C, Hoffmanna M, Taubea M, Krügerb O, Baranc R, Adama C (2020) Uranium and thorium species in phosphate rock and sewage sludge ash based phosphorus fertilizers. J Hazard Mater 382:121100. https://doi.org/10.1016/j.jhazmat.2019.121100
Weinberg JM, Cowart JB (2001) Hydrogeologic implications of uranium-rich phosphate in northeastern Lee County. In: Missimer TM, Thomas MS (eds) Geology and hydrogeology of Lee County, Florida. Florida Geological Survey Special Publication No. 49, pp 151–165
Yang H, Xiao J, Xia Y, Zhao Z, Xie Z, He S, Wu S (2022) Diagenesis of Ediacaran–early Cambrian phosphorite: comparisons with recent phosphate sediments based on LA-ICP-MS and EMPA. Ore Geol Rev 144:104813
Youssef MI (1965) Genesis of bedded phosphates. Econ Geol 60:590–600
Zaghloul ZM, Abdel Aziz A (1961) Studies of the radioactivity of the phosphate deposits at Central Kharga Oasis. In: 4th Arab. Sci. Conf., Cairo
Zahran E (2020) 3D-modeling and lithostratigraphic correlation of the subsurface upper cretaceous Duwi phosphates at Wadi Ash-Shaghab, East Sibaiya area, southern Egypt. Solid Earth Sci 5:94–102
Zidan IH (2002) Geological, mineralogical and geochemical studies of Abu Tartur Area. Western Desert, Egypt; Al Azhar University, Cairo
Acknowledgements
We thank gratefully the Chief-Editor Prof. James W. LaMoreaux and the three reviewers for helpful us and constructive suggestions. The authors would like to express their deep sense of gratitude and profound thanks to Prof. Dr Ibrahim El Aassey for the critical reviewing of this manuscript. Special thanks extend to Prof. Dr. Hamed I. Mira the president of Nuclear Materials Authority, and Prof. Dr.Tarek Fahmy Mohammaden for their fruitful discussion of the manuscript. Many thanks also extend to Prof. Dr Sherif Farouk (Egyptian Petroleum Research Institute, Egypt), Dr Mahmoud El Sayed, Dr Zinab Shalaby and Dr Sameh Negm (NMA) for their help.
Funding
Open access funding provided by The Science, Technology & Innovation Funding Authority (STDF) in cooperation with The Egyptian Knowledge Bank (EKB).
Author information
Authors and Affiliations
Contributions
A. Carried out all the sampling and Field work. B. Carried out the lab work, wrote the main manuscript text, and prepared the figures. C. D. Carried out some lab work. E. Help in writing the manuscript. F. G. Help in lab work. All authors reviewed the manuscript
Corresponding author
Ethics declarations
Conflict of interest
The authors declare no competing interests.
Ethical approval
The conducted research is not related to either human or animals use.
Additional information
Publisher's Note
Springer Nature remains neutral with regard to jurisdictional claims in published maps and institutional affiliations.
Rights and permissions
Open Access This article is licensed under a Creative Commons Attribution 4.0 International License, which permits use, sharing, adaptation, distribution and reproduction in any medium or format, as long as you give appropriate credit to the original author(s) and the source, provide a link to the Creative Commons licence, and indicate if changes were made. The images or other third party material in this article are included in the article's Creative Commons licence, unless indicated otherwise in a credit line to the material. If material is not included in the article's Creative Commons licence and your intended use is not permitted by statutory regulation or exceeds the permitted use, you will need to obtain permission directly from the copyright holder. To view a copy of this licence, visit http://creativecommons.org/licenses/by/4.0/.
About this article

Cite this article
Aita, S.K., Abdel-Azeem, M.M., Abu Khoziem, H.A. et al. Tracking of uranium and thorium natural distribution in the chemical fractions of the Nile Valley and the Red Sea phosphorites, Egypt. Carbonates Evaporites 39, 32 (2024). https://doi.org/10.1007/s13146-024-00931-y
Accepted:
Published:
DOI: https://doi.org/10.1007/s13146-024-00931-y