
Abstract
We investigated the growth–temperature relationship in plants using a quantitative perspective of a recently derived growth functional. We showed that auxin-induced growth is achieved by the diffusion rate, which is almost constant or slowly ascending in temperature, while the diffusion rate of fusicoccin (FC)-induced growth increases monotonically with temperature for the entire temperature range (0–45) °C, although for some concentrations of indole-3-acetic acid (IAA), “super-diffusion” takes place for unperturbed growth. We also calculated the cross-correlations and the derivative of cross-correlations for elongation growth (rate) and pH as a function of time delay (lag) parameterised by temperature for artificial pond water (APW) control conditions (endogenous growth) and exogenous IAA and FC that were introduced into the medium. Dimensionality analysis revealed that discontinuities in the cross-correlation derivative corresponded to H+ ion kinetics, which attained definite numerical values that were approximately proportional to the (logarithm of) proton secretion rates (or relative buffer acidification). Furthermore, three types of experiments were compared: for abraded coleoptiles, coleoptile segments and intact growing seedlings. From the cross-correlation analysis, it was found that the timing of IAA and FC-induced proton secretion and growth matched well. Unambiguous results concerning the canvas constituting acid growth hypothesis were obtained by cross- and auto-correlation analysis: (1) for abraded coleoptiles, because of the lowering of the cuticle potential barrier, auxin-induced cell wall pH decreased simultaneously with the change in growth rate; no advancement or retardation of pH (proton efflux rate) or growth rate took place, (2) exogenous protons were able to substitute for auxin thus causing wall loosening and growth, (3) although the underlying molecular mechanisms differ vastly, a potent stimulator of proton secretion, the fungal toxin FC, promoted growth that was similar to auxin, although of an elevated intensity; as for auxin—no advancement or retardation took place.
Introduction
Over millions of years of evolution, plants have adapted to changing environmental conditions and different types of climate. Temperature is one of the main factors that affects their growth and development; however, its effect on plants is difficult to examine in detail because virtually every biological process has an inherent optimum temperature at which it occurs most effectively. This optimum value not only depends on the species, organs and tissues but also depends on the stage of the development of the organism (Awasthi et al. 2015). Both supra- and sub-optimal temperature stresses are the factors that may cause structural damage, interfere with metabolism and consequently weaken growth and reduce plant vigour or lead to cell death (Hasanuzzaman et al. 2013; Awasthi et al. 2015).
Different plant species developed mechanisms which allow them to survive at extreme temperatures (Hasanuzzaman et al. 2013) and to be able to conduct photosynthesis and maintain their development, though in limited degree. These mechanisms in the case of cold shock for crop plants include: reorganising the membrane structure by increasing the proportion of polyunsaturated fatty acids and maintaining large reservoir of ATP and NADPH, which allows them to preserve or even stimulate the synthesis of more reduced compounds playing a role in osmoregulation (Guy 1999). The ability to tolerate high temperatures, in turn, can be achieved by reducing the absorption of solar radiation, owing to special forms on the cuticle surface which reflect light, hairs on the leaves, a greater thermal stability of enzymes, elevated transpiration, as well as increased content of saturated fatty acids in the lipid membrane or through the biosynthesis of heat-shock proteins—HSPs (Iba 2002; Hasanuzzaman et al. 2013; Awasthi et al. 2015). Most plants have a high capacity to adapt to a particular temperature range and can change the optimum temperature to conduct photosynthesis. As little as several hours of exposure can provide a level of acclimatisation for most plants (Iba 2002; Yamori et al. 2014).
Plants evolve within the universal constraints that are imposed by the plant cell wall, thereby dynamically equilibrating the turgor pressure inside the wall (Lintilhac 2014). It is now widely believed that cell enlargement is the result of interacting effects of turgor pressure, mechanical strength of cell wall microfibers and wall loosening due to various biochemical factors including auxin (Lüthen 2015), fusicoccin (Antipova et al. 2003), expansin (Cosgrove 2000a), etc. At the lowest level, the description of cell/plant organ evolution may be expressed in terms of the biophysics and mechanics of the cell wall during growth. Cell extension growth in turgid plant cells/organs is brought about by the loosening of the structure of the growth-restraining cell walls, which results in the relaxation of wall tension and concomitant water uptake (Schopfer 2001). However, the biochemical mechanism of this wall loosening reaction has not yet been fully elucidated. Numerous proteins have been recognised as catalysts, in particular cell wall polysaccharides or the expansin family, which cause stretch-dependent creep in acidified cell walls by breaking intermolecular non-covalent bonds (Cosgrove 1999, 2000b).
Primary wall extension growth (“diffusive growth”) is fundamental to plant morphogenesis and the evolution of shape. A permanent increase in volume must be accompanied by some kind of stress relaxation; otherwise the enlarged cells would tend to shrink to the original size through elastic interactions. Therefore, a viscoelastic stress relaxation response is required (we cite after Lintilhac 2014; Metraux and Taiz 1978; Dorrington 1980; Taiz 1984; also Haduch-Sendecka et al. 2014, Eqs. 6.1–6.3 and the comment therein). A number of scientists proposed certain models to describe interplay between the physical variables in this biological event, i.e. cell expansive growth. Wei and Lintilhac (2003, 2007) suggested a different approach to model stress relaxation behaviour. While agreeing with the fact that the source of the tensile stress is turgor pressure, they implied that stress relaxation in plant cell walls (at critical pressure) should be treated as a binary switch—a mechanism that may be appropriate in short-term growth processes (Zajdel et al. 2015), which may be caused by low-amplitude, high-frequency (e.g. osmotic) pressure fluctuations like those in pollen tubes. In a recent paper by Pietruszka and Haduch-Sendecka (2015), a solitary frequency f 0 ≈ 0.066 Hz was determined via the detrended fast Fourier transform (FFT) of the wall pressure power spectrum, which revealed a strict periodicity for growing lily pollen tubes—data measured in a pressure probe experiment by Benkert et al. (1997) and reanalysed by Zonia and Munnik (2011). A distinct proposal, which also led to quasi-discrete energy levels that resembled a binary switch in the case of periodic growth of pollen tubes, in which asynchronous growth dynamics were achieved through an anharmonic potential at constant turgor pressure condition, was put forward independently by Pietruszka (2013a).
In spite of the extensive efforts to explain the effect of the temperature response of plants, the subject seems to be insufficiently appreciated and, in this context, studies of plant cell/organ are rarely reported in the current literature. Usually, focus is put on growth/development/elongation as a function of temperature, but the plots of such temperature dependence are infrequently presented. Only a few papers in which temperature response is treated as a key issue can be mentioned (see the next paragraph). It was suggested that cell growth, especially cell elongation, has a high Q 10 factor (which is a measure of the rate of change of a biological or chemical system as a consequence of increasing the temperature by 10 °C), which indicates that this is a chemically rather than physically controlled phenomenon (Went 1953). In the above context, we will show that physical (temperature) constraints act through chemical reactions to direct growth.
Temperature is one of the most important factors that determines plant growth, development and yield (Yan and Hunt 1999). It is clear that the accurate indication of plant temperature response is a prerequisite to successful crop management. All biological processes respond to temperature and several models have been proposed (ibid.). Among others, the standard density function of beta distribution using only three cardinal numbers was proposed by Yan and Hunt (1999). This approach delivered a universal scaling function, although the parameters were not of the kind of ‘fine-tuning’ parameters that are somehow rooted in any accompanying microscopic model. The short-term temperature response of coleoptile and hypocotyl elongation growth based on the principle of Central Limit Theorem for several species (barley, wheat, millet, bean, and pumpkin) was also considered by Lewicka and Pietruszka (2008), though this approach seems less reasonable.
Empirical elongation/growth studies usually include the notion of temperature implicitly, while some of them intentionally consider the effect of temperature on elongation growth (Karcz and Burdach 2007), which in this study exhibited a clear maximum at 30 °C in maize and an upward shift of the maximum in the presence of indole-3-acetic acid (IAA) and fusicoccin (FC). High (supra-optimal) temperatures also promoted auxin-mediated hypocotyl elongation in Arabidopsis. Gray et al. (1998) showed that Arabidopsis seedlings that were grown in the light at a high temperature of 29 °C exhibited dramatic elongation of the hypocotyls compared with seedlings that were grown at 20 °C. These results strongly supported the contention that growth at a high temperature promoted increase in auxin levels and that endogenous auxin promoted cell elongation in intact plants. For the record, besides the above-mentioned papers, we can include recent surveys on the growth–temperature relation in plants such as Pietruszka et al. (2006, 2007), Pietruszka (2009), Lewicka and Pietruszka (2010), in which the preliminary phenomenological models were supported by experiments. The latter studies lacked the molecular context, which—to some extent—we supplement in this work.
Many models have been developed in the growth area and we mention only a few of them. A hormone model of primary root growth in which the wall extensibility is determined by the concentration of a wall enzyme (unspecified by the authors), whose production and degradation are assumed to be controlled by auxin and cytokinin, was proposed by Chavarria-Krauser et al. (2005). Additionally, the role of new class of plant hormones, strigolactones (SLs), was postulated in this process (de Saint Germain et al. 2013; Marzec and Muszynska 2015). More recently, Pietruszka (2012) formulated a biosynthesis/inactivation model for enzymatic wall loosening factors or non-enzymatically mediated cell evolution based on the Lockhart (1965) type of equation. In that work, the physiology and biochemistry of the growth process were related using analytical equations and acquired high-fidelity factors with the empirical data. In addtion, in the same context of biosynthesis, biological growth as a resultant effect of three forms of energy (mechanical, thermal and chemical) and their individual couplings was summarised in the form of an elegant theoretical framework by Barbacci et al. (2013). They described biological growth as the resultant effect of three forms of energy and their couplings (denoted M/T, M/C and T/C—M for mechanical, T for thermal and C for chemical). For each energy, each couple of intensive and extensive variables was linked by one component of Tisza’s matrix. However, this elegant derivation requires many parameters (13) and externally controlled turgor pressure P and temperature T to retrieve, e.g. the data that are extracted from the Proseus and Boyer (2008) experiment (see Fig. 5 in Barbacci et al. 2013).
The rapid growth of plants requires an optimal temperature (e.g. Lewicka and Pietruszka 2006; Hasanuzzaman et al. 2013; Pietruszka 2015a). The growth of plant cells and organs is slowed down below or above this temperature. The latter statement implies that an optimum must exist at the crossover temperature region if one observes slow growth at both the high- and low-temperature ends. At this temperature, it may be presumed that at least one major factor of the wall-extension governing parameters (couplings) must change significantly. For the purposes of this approach, we may call it the effective “diffusion rate” k 2. For practical, e.g. agricultural use, the value of the parameter may have a major significance. We believe that the proposal that is included in this paper and in Zajdel et al. (2015) may form a new base for crop system simulation packages through the included software (ibid.).
In this study, we considered plant enlargement in the context of the reactions that link the process to cell wall biosynthesis. Excellent overviews have been given by Kutschera (2001), Fry (2004), Cosgrove (2005), Boyer (2009) and quite recently by Lintilhac (2014) and Braidwood et al. (2014). However, the steps in wall assembly and the specific chemistry that controls the rates of enlargement are still lacking an analytical background. Here, we covered this broad problem in some measure by considering the temperature dependence of the factors that are related to the cell wall biosynthesis.
Materials and methods
Materials
The manuscript is mostly built upon the experimental data that originated from Karcz and Burdach (2007) paper. Briefly, these experiments were carried out with 10-mm-long segments cut from the 4-day-old coleoptiles of maize (Zea mays L.) 3 mm below the tip in usual growth conditions. The experiments were carried out for 7 h each and measurements were taken every 15 min. The raw individual values were retrieved by us using a GetData Graph digitiser and are collected in SI Tables 1–3 for re-analysis. The experimental data that were obtained using this routine were used in the fitting procedure to interrelate the elongation growth data of the coleoptile segments and the growth functional at a constant temperature (Fitexex program, Python code in Zajdel et al. 2015). The definite problems in the datasets that were used for the analysis are presented and discussed later.
We based partially our analysis on the data that were published by Peters et al. (1998) and Lüthen et al. (1990) in which the abrasion technique was used. For the cross-correlation analysis, we digitised Figs. 3, 4 and 5, which are presented therein, respectively.
Finally, for comparison, we present the results of some measurements (lasting 48 h each), which were performed by our group on intact growing maize seedlings using a CCD camera (SI Fig. 4). Seeds of maize were grown in the dark at 27 °C; 4-day-old seedlings about 2.5 cm long were chosen for the experiment. The experiment was carried out simultaneously in both chambers for APW (first chamber for control) and for the changing growth factor IAA and FC with concentrations at the following intervals: 0.5 × 10⁻⁷–10−5 M, which were introduced into the second chamber from the beginning of experiment. The fluid volume in both chambers equaled 30 ml and there were three seedlings in each chamber. The seedlings of maize were grown in dim green light. A constant temperature was maintained at about 25 °C, and pH, which was changed by the soaked part of the seedlings and the root system, was measured by two pH meters (in each chamber independently) using a CPI-501 pH/ion meter. The images were recorded by a Hama Webcam AC-150 every 30 min. The relative elongation of the marked coleoptile segments (initially 1-cm-long fragments indicated by ink spots) was calculated from the length and time measurements, using the formula (l f − l i)/l i, where l i is the initial length and l f is the final length. This method allowed for simultaneous measurements of growth and H+ efflux. The OriginPro 8.5.1 software (Microcal) was used to perform the calculations and to create the graphs for all of the cases.
Methods
Relative elongation growth formula
For mathematical analysis, we used the data collected in SI Tables 1–3 (presented in SI Figs. 1–3) for the double-exponent growth functional that was derived in Pietruszka (2012, 2013b) and further elaborated in detail for practical use in Zajdel et al. (2015) for the relative (volumetric) growth rate
where A, B, C and D are positively defined coefficients that are constant in time. The coefficients C = C(T) and D = D(T) = k 2(T) = 1/τ 2 are, in principle, temperature (T) dependent. A particular time t = t i stands for the inflection point (corresponding to the maximum in growth rate) of the sigmoid-like growth curve (Pietruszka 2012, Fig. 8a). In the present analysis, the effective diffusion rate, which involves net transport to the wall k 2(T), was our main interest since it can be directly inferred from the fits. Its value depends on dimensionality such as [D] = 1/s and, therefore, can be compared between diverse species and in different experimental conditions. Note, that the coefficient k 2 = D (diffusion rate) should not be confused with the diffusion constant D that is defined in the Fick’s 1st law.
To prepare the temperature-dependent data for further analysis, additional (intermediate) data points were obtained through linear interpolation (moving average)—SI Table 4–6.
For the analysis we also used the probability density function of the beta distribution, also called the Euler integral of the first kind (Polyanin and Chernoutsan 2011) for the interval 0 ≤ x ≤ 1 and shape parameters α, β > 0. The beta function is a power function of the variable x and of its reflection (1 − x)
and has a normalisation constant B = B(α, β). The use of beta distribution was already suggested by Yan and Hunt (1999) for temperature-dependent plant growth. The coexistence curve (Fig. 3, ibid.) that is presented by the authors also strongly supported the use of the beta function in this study. The results of the fitting procedure for the growth process amplitude C = C(T) are related to the beta function (Eq. 2) in the following way
where c T is a constant. The lower index “pH” in Eq. (3) should be read “at constant pH”, which is valid for preparation of strict experimental conditions (Hager 2003). The rescaled value of temperature T belongs to a (0, 1) interval. A universal scaling can be expected in the form of a coexistence curve (Stanley 1971, Fig. 1.8; Yan and Hunt 1999, Fig. 3; Pietruszka 2015a).
Fitting Eq. (1) to the experimental data provides the initial parameters A, B, C, D and t i on the condition that the proper unit scaling was done. We had already delivered (Zajdel et al. 2015) the physiological explanation of these parameters, although the interpretation of parameter C was still lacking. At that time, we could only assign a process “amplitude” meaning to coefficient C. Now, in the context of present analysis, it seems that parameter C = C(T), if dependent on temperature, is biologically meaningful. It can successfully be described in temperature context by the Euler beta function or equivalently by pH changes in the apoplast (Pietruszka 2015a), which lead to proton extrusion into the wall compartment and subsequently—in accordance with the “acid growth hypothesis” (Hager 2003)—viscoplastic wall extension. In this way, temperature, which is connected to the rate of chemical reactions (Q10 factor) or pH, attributed to plasma membrane PM H+ activity, can be introduced into the growth functional Eq. (1). This equation faithfully reproduces experimental results with the determination coefficient attaining an extremely high value in the majority of cases, especially when biological experiments are taken into account: R 2 ~ 0.9998 (see SI Tables 4, 6). In conclusion, C ≡ C(T; α, β) ~ C(pH) and D, which were recognised earlier as “diffusion rates”, reflects the rate of the flow of the ions. Coefficient A ~ (P − Y) and parameter B ≥ 0 as yet have no interpretations. Henceforth, we will consider only the C(T) and k 2 = D(T) coefficients.
The previous paragraph requires an additional comment. According to Fick’s 2nd law, the diffusion rate gives the relation between the temporal concentration derivative (accumulation) and the spatial concentration distribution (gradient) of a solute species in a given medium/solvent (e.g. water) is denoted by D and has units (m2/s). The effective diffusion rate k 2 as referred to in this paper is by its nature the reciprocal of the process characteristic time constant τ 2, which has unit (s) [and so k 2 is in (1/s) units]. According to the model constitutive equation, Eq. (1), D is exactly 1/τ 2. Given that the origin of D is semi-phenomenological, although rooted in processes that are ultimately governed by thermodynamic processes such as diffusion, and considering the fact that the relative volumetric change (according to Eq. 1) is very complex in its origin, we propose that k 2 (=D) be denoted as an effective diffusion rate.
Cross-correlations
In signal processing, cross-correlation is a measure of the similarity of two waveforms as a function of a time lag that is applied to one of them. This is also known as a sliding dot product or sliding inner product. For continuous functions f and g, the cross-correlation is defined by the integral
where \( f^* \) denotes the complex conjugate of f and τ is the time lag. Note, that the cross-correlation is maximum at a lag equal to the time delay (maximum located at lag equal zero means no time delay). Similarly, for discrete functions (like the experimental data points that are usually analysed), the cross-correlation is defined as:
This is the definition that is used in this work (here: \( f^* \) = f). Auto-correlation is obtained if f equals g. The cross-correlation derivative (over time delay τ) is defined as follows (see also “Appendix”)
Results and discussion
For discussion purposes, we have omitted the details of the derivation of Eq. (1), which can be found elsewhere (Pietruszka 2012; Zajdel et al. 2015). Instead, we only cover the subsequent thought leaps that lead to the temperature dependent C and D coefficients (fit parameters) in Eq. (1).
Effective diffusion rates
First, let us recall (Pietruszka 2012) the first-order differential equation for n(t)
which is the actual concentration of WLF (wall loosening factor) solution that was inserted into the truncated form (for constant turgor P) of the Ortega (1985) equation. In Eq. (7) the diffusion rate k 2, which is the rate of the change of WLF concentration in the cell wall at a given temperature, is the most interesting for our problem. The coefficient k 1, which originates from the external pool in the model calculations (it may be also interpreted as a ‘biosynthesis’ coefficient), is incorporated into the remaining coefficients of Eq. (1).
With the usual assumption that both cell wall extension and water uptake must occur concomitantly, and the overpressure (e.g. by tissue impact) dependence of the yield threshold Y = Y[n(t)]—in the first approximation—may be neglected, we arrived at the double-exponent solution
where n 0 = n(t = 0). Note, the relevant, but not mutually interacting, coupling strengths (k) must be taken into account when extending the model (Pietruszka 2012). Next, we recall that the plots that are presented in Fig. 2 (ibid.) exhibit pronounced changes with respect to the ‘coupling constant’ strength (effective diffusion rate k 2) in contrast to the lesser reactions that are caused by a change in turgor pressure. The interpretation from the analytic expression (ibid.) follows that for the volumetric extension to be effective, it must be preceded by pressure-induced relaxation processes in the cell wall due to WLFs interaction with the wall constituting polymers (Schopfer 2008; Geitmann and Ortega 2009), otherwise growth is less successful since the wall is more ‘rigid’ and not susceptible to the changes in pressure.
We must also bear in mind that the model involves the biosynthesis of WLFs in the cell at a steady rate of k 1 and the partial inactivation of such created WLFs at a rate of k 2. Note that k 2 = k 2(T) can in general be temperature dependent as is shown in Fig. 7 in Pietruszka (2010). The advantage of the proposal expressed by Eq. (1) is that by preserving the appropriate (strict) experimental conditions during measurements of changing volume V(t), the set of k 2 values that is obtained may return important information about the diffusion and interaction strengths on the molecular level. The regulatory role of endogenous WLF chemical activity is shown in Figs. 1 and 2 and it is especially pronounced in Fig. 2a, in which a sharp Gaussian peak is located. It should be pointed out that the obtained diffusion rate k 2 that was obtained cannot be directly linked to the growth rate, since the increase in volume can also be built into the coefficient C = C(T), which serves as nonlinear, temperature-dependent growth amplitude in Eq. (1). Note that the greater the k 2, the more substantial the decrease of the initial concentration of n 0 and the quicker the decrease of the actual ‘growth factor’.

a Endogenous growth (APW) amplitude coefficient C as a function of temperature (solid squares); artificial pond water (APW) incubation medium. Temperature interval (0–40) °C corresponds to (0–1). A maximum at 30 °C (Euler beta function fit plus β-spline interpolation). The calculated data points and error bars—see SI Table 4. The fit parameters calculated from Eq. (2) are indicated in the chart. The goodness of fit: χ 2 = 0.0003 and the determination coefficient R 2 = 0.94. b Exogenous growth (IAA) amplitude coefficient C as a function of temperature (solid squares); auxin (IAA) introduced into the incubation medium after 2 h. Temperature interval (0–45) °C corresponds to (0–1). A maximum at 30 °C (Euler beta function fit plus β-spline). The calculated data points and error bars—see SI Table 5. The fit parameters calculated from Eq. (2) are indicated in the chart. The goodness of fit: χ 2 = 0.00018 and the determination coefficient R 2 = 0.97. c Exogenous growth (FC) amplitude coefficient C as a function of temperature (solid squares); fusicoccin (FC) introduced into the incubation medium after 2 h. Temperature interval (0–45) °C corresponds to (0–1). A maximum at 30 °C (Euler beta function fit plus β-spline). Calculated data points and error bars—see SI Table 6. The fit parameters calculated from Eq. (2) are indicated in the chart. The goodness of fit: χ 2 = 0.00065 and the determination coefficient R 2 = 0.86. The use of beta distribution (Euler beta function fit) was already used by Yan and Hunt (1999) for temperature-dependent plant growth

a The effective diffusion rate k 2 of endogenous growth calculated from the growth functional, Eq. (1), for coleoptiles of maize that was grown at different temperatures (solid squares) and fitted to the Gauss function (solid line). a Interpolated by Microcal Origin: T 1 = 14.6 °C and T 2 = 38.16 °C; half-widths w 1 = 0.12 ± 0.03 and w 2 = 0.73 ± 0.49. The values of the diffusion rate k 2 at low and high temperatures are diminished due to metabolic changes (see the text). The calculated data points and error bars—see SI Table 4. Fit parameters: χ 2 = 0.09056 and determination coefficient R 2 = 0.95. Excluded area at temperatures exceeding 40 °C: see dense (red) pattern due to high error values (SI Table 4). Arrow pointing to the upper local maximum at T 2. b Interpolated by DAVE (Azuah et al. 2009): T 1 = 15 °C and T 2 = 34.9 °C. In the sub-optimal temperature range (T < T 1), plasmalemma is supposed to be in crystalline phase, in the optimal range (T 1 < T < T 2)—in semi-liquid phase, while in the supra-optimal range (T > T 2)—in liquid phase. In a–c sub- and supra-optimum temperatures are excluded for fundamental (biochemical) reasons, which is apparently reflected in the increasing number of errors that were obtained in the computer code (SI Table 4–6). Rescaling of abscissa in A–C: (0–40) °C is corresponding to (0–1). b The effective diffusion rate k 2 for exogenous IAA calculated from growth functional, Eq. (1), for coleoptiles of maize that was grown at different temperatures (solid squares). Calculated data points and error bars from SI Table 5. The horizontal (blue) line represents—for optical reference only—a constant diffusion rate for k 2 = 1.86 × 10⁻⁴ s−1 for the (8–40) °C) interval. Excluded areas at temperatures below 8 °C and exceeding 40 °C—sparse and dense pattern, respectively, due to the high error values (SI Table 5). A local minimum appears at about 30 °C (arrow). The diffusion rate starts increasing above this value and reaches the maximum at 40 °C. Then the diffusion rate decreases. Alternatively, the inset shows the linear interpolation for the non-excluded data. C The effective diffusion rate k 2 for exogenous FC calculated from growth functional, Eq. (1), for coleoptiles of maize that was grown at different temperatures (solid squares). Calculated data points and error bars from SI Table 6. Solid (red) line represents a linearly ascending diffusion rate for the (0–40) °C interval. Linear model—slope (a) and intercept (b) are shown in the legend. Indicated confidence bands (dashed lines) at a confidence level α = 0.05. The local minimum (20 °C) and the local maximum (35 °C) are indicated by the arrows. The latter may be connected with the respective “phase transitions” that take place in the cell wall (see text). Excluded areas at temperatures exceeding 40 °C—dense pattern due to the high error values that were calculated by the computer code (SI Table 6)
Based on the results from this paper, it was shown that the ‘k 2 factor’ decisively influences cell/organ volume. By adding a biochemical substance that causes a similar effect (such as WLF), one should observe shifts of the peak in Fig. 2a. Hydroxyl radicals (OH)− are capable of unspecifically cleaving cell wall polysaccharides in a site-specific reaction (Schopfer 2001). Cell wall loosening, which underlies the elongation growth of plant organs, is controlled by apoplastically produced OH− that “attacks the load-bearing cell wall matrix polymers” (ibid.).
The molecular factors in the scenario outlined above can be exemplified by:
-
The dependence of extension on the concentrations of ascorbate/H2O2 and Cu2+ or Fe2+ [used for generating OH− in the isolated cell walls of maize coleoptiles (Fig. 3, Schopfer 2001)],
Fig. 3 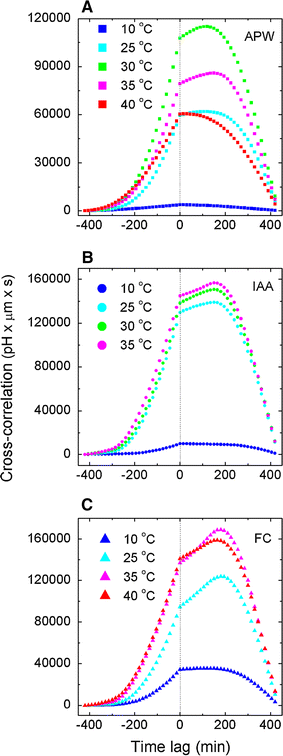
Cross-correlations of pH and elongation growth as a function of time lag τ, Eq. (5), for APW (endogenous growth), exogenous IAA and FC. Analysis based on the raw data that are presented in Figs. 1–5 in Karcz and Burdach (2007). The time retardation (advancement) of the maximum with respect to a zero time delay is clearly visible. Note a (red line) plot for APW at 40 °C that resembles the ideal cross-correlation of a step function and a rectangular triangle—the meaning is that growth and acidification takes place almost simultaneously (without retardation), which may be caused by the amplified diffusion at high (T 2) temperature (Fig. 1a). Maxima located at positive abscissa values correspond to the retardation of the medium pH
-
The dependence of extension on pH (Fig. 4, ibid.),
Fig. 4 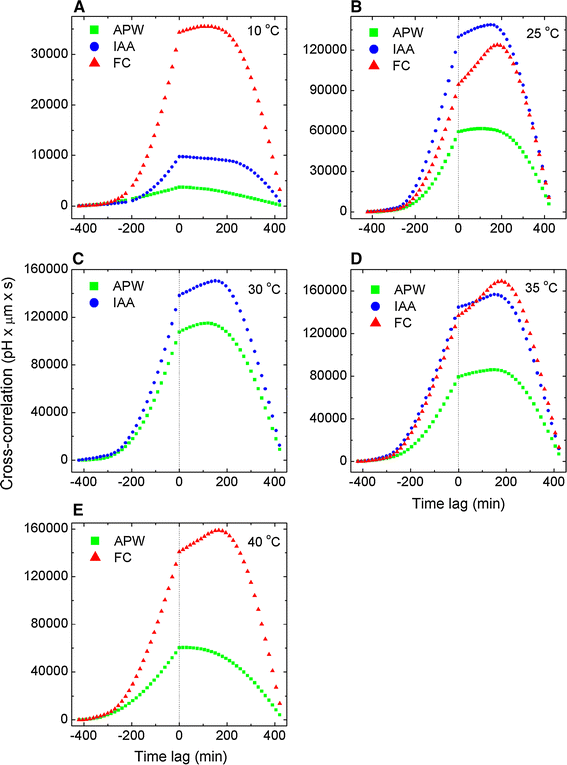
Cross-correlations of pH and elongation growth as a function of time lag τ parameterised by temperature for APW (endogenous growth), exogenous IAA and FC. Data as in Fig. 3. The time retardation (advancement) of the maximum is clearly visible. The prevailing role of FC at sub- and supra-optimal temperatures is evident. Maxima located at positive abscissa values correspond to the medium pH retardation
-
The inhibition of auxin-induced elongation growth by Mn-based chemicals (Fig. 9, ibid.).


The implications of our proposal are also supported by a clearly visible shift in the Porter and Gawith (1999) study, Fig. 1.
For further discussion we call to mind the results of Lewicka and Pietruszka (2006). We want to especially draw the reader’s attention to the comparison of Fig. 6 (ibid.), which shows three characteristic phases (crystalline, semi-liquid and liquid) to the endogenous growth amplitude coefficient C from Eq. (1), which is presented in Fig. 1a in the present work. From the biomechanical point of view, cell membranes are equipped with ionic pumps and channels, water channels and ligand receptors (Berg et al. 2002). The optimal phase of endogenous growth begins in the semi-liquid phase, and presumably corresponds to the peak of the Gauss curve that is located at the phase boundary at about 16 °C in the present work (Fig. 2A) and a “jump” above 16 °C in Fig. 1a. Then, the endogenous auxin activates H+-ATPase, the acidification of the cell walls and their loosening. Simultaneously, the in-flow of K+ ions takes place through the reduction of the water potential thereby filling up the plant interior and pulling behind water molecules. At this temperature end, we encounter a kind of a ‘phase transition’ from a crystalline to semi-liquid phase. Low temperatures cause membrane depolarisation and K+ loss, water efflux and growth inhibition. Furthermore, at 0 °C the reservoir of liquid water becomes nearly empty due to the crystallisation into the ice phase. At high temperatures, another transition from a semi-liquid to a liquid phase occurs (arrow pointing at a local maximum at 38 °C, Fig. 2a), thus causing the malfunction of ionic and water channels as well as ionic pumps (and hence the fits for k 2 become inexact, which can be observed at temperatures above 40 °C in Fig. 2a). In effect, we are dealing with ionic leakage, a secondary water stress and consequently the cessation of growth. Moreover, the auxin receptor proteins change the conformation and functionality, which causes the deceleration and termination of growth. The processes that are described are reflected in Figs. 1a–c and 2A–C in this paper. Further research should address how the magnitude of the related biophysical variables and specific chemical reactions that are responsible for the optimum growth are affected by temperature (and pH) within the cell. It seems that under sufficient water supply conditions, the growth rate of plant cells or organs can be optimally maintained either by changing the environmental temperature or by fine-tuning the system through pH-dependent biochemical reactions (Pietruszka 2015a). The difficulty lies in finding the chemical potential-dependent essential reaction(s) that are responsible for the modification of C and D coefficients. Determination of such reaction(s) can be an important contribution to the problems of food production in areas of sub- and supra-temperatures, in which pH-induced biochemical factors can compensate for the non-optimal growth temperatures of the environment (ibid.).
Moreover, the descriptions of experimental datasets (SI Figs. 1–3; SI Table 4–6) that were concluded in coefficients C and D were even better than those that can be provided by the generalised logistic (six parameters) Richards function (Richards 1959), which is the most flexible of the classical growth equations. This is mostly due to the fact that, besides fewer number of parameters, the parameters that are used in the double exponential function that is proposed by us (Pietruszka 2012) has a real biochemical and biophysical underpinning. Additionally, it seems that parameter C = C(T), if dependent on temperature, is biologically meaningful when described by the Euler beta function (Yan and Hunt 1999). Coefficient C can also designate pH changes in the apoplast and hence, proton extrusion into the wall (Pietruszka 2015a).
We considered the temperature-dependent effective diffusion rate with specific applicability to the cell wall loosening factors and the application of Euler beta distribution to the amplitude C of the growth functional, Eq. (1). It was shown that the endogenous/exogenous growth amplitude C = C(T) is realistically reproduced by the Euler beta function as a function of temperature (see also Fig. 1 in Hasanuzzaman et al. 2013 where the schematic illustration of the effect of temperature on major physiological processes of plants is shown), while the temperature-dependent endogenous diffusion rate D = k 2(T) is reasonably represented by the Gauss distribution (for endogenous auxin) or linear function (for exogenous auxin of fusicoccin). In the context of temperature, the diffusion rate k 2 = k 2(T) and the amplitude C, which describe active H+ transport into the wall, provide a measure of the thermal energy efficiency of growth. We showed that the localisation of the endogenous growth maximum is essentially determined by temperature (or equivalently by pH, through the plasma membrane H+-ATPase), and that the cumulative action of C and k 2 coefficients essentially contribute to growth. It also seems that the localisation of optimum growth is mainly determined by temperature (or pH)-dependent C coefficient. From our model calculations the maximum value of endogenous growth amplitude C (Fig. 1a) is lower than for both ‘exogenous cases’ (IAA and FC, Fig. 1b, c) suggesting different mechanism for proton kinetics, and temperature-dependent increase in growth.
The main limitation of our early ‘temperature approach’ to plant cell/organs growth was that it did not account for the important role of the biochemical reactions that are involved in the cell wall building processes. The present study extends our previous proposals into new territory. The strongly predicative (temperature dependent) semi-empirical Eq. (1) permits the leading factors in plant cell/organ growth to be fine-tuned, the implications of which may be helpful for climatic (or soil pH) impact studies on plant growth mentioned in the Introduction. Our results also suggest that at least for some special experimental conditions (abraded samples like in Lüthen et al. 1990), the timings of growth and proton efflux match, while the interaction that is expressed by cross-correlations is much stronger for fusicoccin than for auxin. This issue is, however, discussed beneath.
Cross-correlation analysis
Some crucial arguments against the acid growth theory of auxin action (Kutschera and Schopfer 1985) have been reinvestigated by simultaneous measurements of proton fluxes and the growth of Zea mays L. coleoptiles by Lüthen et al. (1990). Among others, it was found that (a) the timing of auxin and fusicoccin-induced (FC) proton secretion and growth matches well and (b) the equilibrium external pH in the presence of IAA and FC are lower than previously recorded and below the so-called “threshold-pH”. It was concluded that the acid growth theory correctly describes the incidents that occur in the early phases of auxin-induced growth. This subject was investigated next and the results are summarised in Table 1 and Figs. 3, 4, 5, 6, 7, 8, 9, 10 and 11. To save space, the description of our results is partially located in the figure captions.

Relative buffer acidification due to proton efflux. Cross-correlations derivative of elongation growth and pH as a function of time lag τ, Eq. (6), parameterised by temperature for APW (endogenous growth), exogenous IAA and FC. Data as in Fig. 4. Discontinuities (jumps) in the cross-correlation derivative at τ = 0 correspond approximately to the (logarithm of) H+ ions activity for maize coleoptile segments—numerical values are indicated in the legends

Relative buffer acidification due to proton efflux. The cross-correlation derivative of elongation growth and pH as a function of time lag τ (min) parameterised by temperature for APW (endogenous growth), IAA and FC. Analysis based on the raw data in Figs. 1–5 in Karcz and Burdach (2007). Discontinuities (jumps) in the cross-correlation derivative approximately correspond to the (logarithm of) the activity of H+ ions—numerical values are indicated in the legends

Cross-correlation derivative as a function of time (at zero lag) summarising proton efflux kinetics for APW, IAA and FC from Figs. 5, 6. Unavailable input data at 15 and 20 °C for all considered cases and at 30 °C for FC and at 40 °C for IAA, in the original paper by Karcz and Burdach (2007). For fitting purposes, we accepted the temperature scale (0–1) that corresponds to (0–40) °C. The fitting functions, for better visualisation: beta-Euler for APW and IAA, and linear for FC (compare with Figs. 1a, b, 2C, respectively)

Cross-correlations, Eq. (5), calculated for the kinetics of a IAA-induced growth rate and proton efflux rate (solid dots) and b action of FC on growth rate and proton secretion rate (solid triangles) for both parameters measured simultaneously as presented in Figs. 4, 5 by Lüthen et al. (1990). Note that the timings for each plot almost coincide and the cross-correlation intensity for FC is about two times stronger than for IAA

Auto-correlations, f = g in Eq. (5), calculated for the kinetics of IAA-induced growth rate (a) and proton efflux rate (b) and action of FC on growth rate (c) and proton secretion rate (d) for both parameters measured simultaneously as presented in Figs. 4, 5 by Lüthen et al. (1990). Note, that auto-correlations deliver almost identical results (vertical scale neglected), both for fusicoccin (FC) and auxin (IAA) action. This result can be treated as a convincing argument for the “acid growth hypothesis”, which is applicable not only for FC but for IAA as well. Growth rate and proton efflux rate coincide for both FC and IAA and can be used interchangeably

Cross-correlation, Eq. (5), calculated for the simultaneous measurement of the medium pH of 52 abraded maize coleoptile segments in 5 mL of aerated medium and the relative growth rate of a representative stack of four of them as presented in Fig. 3 by Peters et al. (1998). Curve maximum corresponding to the maximum of growth rate after addition of IAA

Cross-correlations, Eq. (5), calculated for the kinetics of a IAA-induced growth rate and proton efflux rate, and b action of FC on the growth rate and proton secretion rate for both parameters measured simultaneously (by the authors) (SI Fig. 5) on intact growing maize seedlings for different, but identical for IAA and FC, concentrations (control means APW). The retardation (shift of a maximum), which is clearly visible for FC, may be due to the lower proton diffusion rate to the buffer for the ‘intact seed’ experiment
Cross-correlations of pH and elongation growth as a function of time delay τ, Eq. (5), for APW (endogenous growth), exogenous IAA and FC are shown in Fig. 3. A similar plot, which is parameterised by temperature, is presented in Fig. 4. The analysis was based on the raw data that were presented in Figs. 1–5 in Karcz and Burdach (2007). The time retardation (advancement) of the maximum with respect to a zero time delay is clearly visible (see also SI Table 7 for the values that were obtained).
The cross-correlation derivative of elongation growth and pH as a function of time lag τ, Eq. (6), which was parameterised by temperature, for APW (endogenous growth), exogenous IAA and FC, are shown in Figs. 5, 6 and collected in Fig. 7. The discontinuities (representing the relative buffer capacity acidification, which are approximately proportional to proton efflux rate) in the cross-correlation derivative at τ = 0 correspond to the H+ ions activity for maize coleoptile segments (see also SI Table 8 for the values that were obtained).
Apparently, there are some general problems with the Karcz and Burdach (2007) data because they did not use abraded coleoptiles like Lüthen et al. (1990). Instead, they infused the coleoptile cylinders with a solution. That appears to work to a certain degree as was indicated by the ±nominal pH drops. It may well be that the responses in this system are a bit more sluggish than in abraded coleoptiles. This might affect the meaningfulness of any cross-correlation analysis. However, this does not seem to be the case. The abraded coleoptiles in Lüthen et al. (1990) or the coleoptile segments in the transducer experiments in Karcz and Burdach (2007) simply provide us with different cross-correlation output. The response is more or less delayed as is shown in Figs. 3, 4, 8 and 10. Although such data does not deliver unambiguous claims related to (time lags in) the acid growth hypothesis, they can probably be useful in analysing the influence of the cuticle potential barrier. This task can presumably be further accomplished by Monte Carlo simulations of the efflux of thermal protons as a function of the properties of such a barrier or by solving Nernst-Planck equation. This is due to the fact that the height (width) of a barrier, which is dependent on cuticle properties, should be reflected in the time delays that are obtained in a cross-correlation analysis. The latter remark should at least hold for an ideal-experiment model analysis.
Another problem with the Karcz and Burdach (2007) data is the fact that auxin and FC were added very early in the pH drop kinetics. There is a very careful analysis of such pH drops (Peters and Felle 1991) that describes what goes on in a well-performed pH drop experiment very well. Basically these authors, to clarify discrepancies between the earlier Lüthen et al. (1990) and Kutschera and Schopfer (1985) papers, found that the pH of excised coleoptile segments first rises to pH 6.5 (RT—reversal time), and then gradually falls to an AE phase (acid equilibrium of about pH 4.8 in maize), which is achieved about 4 h after excision. When auxin is added, the pH will drop to 4.2 with a time course that matches the growth response well. This pattern is also well visible in Fig. 4 in Karcz and Burdach (2007). However, as they apply the auxin very early (after 2 h), they always see the auxin effects on a large background of the still ongoing endogenous pH drop. By contrast, in Peters and Felle (1991), auxin was added at the acid equilibrium, thus, making the pH drop much more clearly visible.
To resolve these discrepancies, we analysed the experimental results that are presented in Figs. 4 and 5 in Lüthen et al. (1990). We accepted the apparently unattractive outcomes, which are presented in Figs. 8, 9, with amazement. In Fig. 8, the cross-correlation of the growth rate and proton efflux rate is calculated for IAA and FC-induced growth. First, we noted that the timings for each plot matched well and the cross-correlation intensity for FC was several times stronger than for IAA. No time delay was observed. Second, the triangular shape of both curves and the location of both maxima at zero lag brought to mind the definition of auto-correlation [the cross-correlation of a signal with itself at different points in time, i.e. Eq. (6) for f = g], which is the most striking feature of this—otherwise known—result. This means that cell wall pH and growth rate are strictly co-regulated (strongly correlated) in growing shoot tissue. This observation led us to perform the auto-correlation analysis that is presented in Fig. 9. A comparison of the auto-correlation plots in Fig. 9a with b for the auxin-induced growth rate and proton efflux rate and Fig. 9c with d for fusicoccin revealed a remarkable similarity of both pairs of plots (a, b) and (c, d). This means that primary (diffusive) wall growth rate and proton efflux rate can be in some way identified, which can be expressed symbolically by the formula
although in actual applications a proportionality constant should be established. As an aside, this result strongly supports the foundations that were recently accepted for the derivation of the equation of state (EoS) and the equation of time evolution for plants by Pietruszka (2015a, b). Note that the latter outcome was obtained for abraded coleoptiles by Lüthen et al. (1990)—in other approaches the epidermal cuticle constitutes a strong barrier for H+ ions. Departures from this ideal picture are shown in Fig. 10, in which time delays and plot deformations are present as a result of transient changes after the addition of IAA.
Since some of our cross-correlation results are parameterized not only by APW (control), auxin and fusicoccin (Figs. 3, 4) but also by temperature, the role of IAA and FC in proton efflux kinetics in temperature-dependent increase in growth can be further investigated either by Monte Carlo simulations for thermal protons (Konefal and Pietruszka 2015), or analytical methods based on Nernst-Planck equation (Lewicka and Pietruszka 2015). The advantage of these projects lies in direct comparison of the expected theoretical outcomes with definite results obtained in this work (see the time lags observed in Figs. 3, 4 and their absence in Figs. 8, 9).
Correlation analysis of the data in consideration implies that the kinetics of proton efflux during plant growth depends on the medium (APW, IAA or FC) and temperature (Figs. 3, 4, 5, 6, 7). The analyzed experiments showed that both IAA and FC stimulated growth in a broad temperature range and that these processes are strongly correlated with the kinetics of proton efflux. In spite of experimental conditions (APW, IAA or FC) correlations of proton efflux with elongation growth for maize at 10 °C is observed; however, at this low temperature growth for FC is about 3.5 times more pronouncedly correlated with proton extrusion than for IAA (Fig. 4a). Using APW as growth medium we note that the correlation maximum of the proton efflux and growth increase for Zea mays L. segments is at about 30 °C. Then correlation (for APW) decreases about two times at 40 °C (Fig. 4c, e). For FC, in turn, the strongest correlation was observed at 35 °C (Fig. 4c). For IAA, used as growth medium, the increase of correlation was observed along with temperature in the investigated temperature range (Fig. 3). The correlation was about two times stronger for IAA than at the corresponding temperature for APW, in Fig. 4a, b, d. Besides, we concluded that for all treatments FC causes the strongest correlation, with the only exception for temperature about 25 °C in Fig. 4. It is important to note the asymmetry of all plots with respect to time lag equal to zero and the existence of local maxima, showing the time delay between growth and proton efflux, which may also depend on the experimental conditions.
The correlation relations described above are also reflected in Figs. 5, 6 and 7 showing the time (lag) derivative of cross-correlations. In this context the maximum of the proton efflux for maize coleoptile segments growing in APW (~509.3 pH μm/s s) was obtained for 30 °C. In addition, 30 °C was the optimal value for IAA (~685.6 pH μm/s s). Thus, the optimum temperature common for the proton efflux is about 30 °C for APW and IAA. However, for FC the rate of proton efflux increases for the entire (probed) temperature range, and the maximum was observed at 180 min. (SI Table 7) and was equal 582.4 pH μm/s s (Fig. 6e). Note, that at low temperatures (10 °C) the proton efflux rate (~211.2 pH μm/s s) is about three times greater (~70.2 pH μm/s s) than for IAA (Fig. 6a). A characteristic departure lies at 25 °C (broadly accepted as the optimum growth temperature for maize) where IAA stimulation of the proton efflux is more pronounced than FC by 35.11 % (Fig. 6b).
It has to be noted that IAA treatment varies a large number of signalling pathways and genes expression, i.e. in case of Arabidopsis 24 h exposure for 1 µM IAA resulted in identification of 276 genes that were upregulated in comparison to non-treated plants (Goda et al. 2004). Whereas analysis focused on the Arabidopsis, hypocotyl treated with 5 µM picloram (4-amino-3,5,6-trichloropicolinic acid, synthetic auxin) revealed increased expression of 65 and 3544 genes after 30-min and 2-h treatment, respectively (Chapman et al. 2012). Among identified genes, the ARF (auxin response factor), AUX/IAA (auxin/indole-3-acetic acid) and SAUR (small auxin upregulated RNA) transcripts were present (Goda et al. 2004; Chapman et al. 2012). Each mentioned gene family plays a crucial role in auxin signalling and promote the expression of other genes that may be involved in cell growth and development. Moreover, exogenous auxin changes the polarity of PIN (PIN-FORMED) proteins that act as auxin exporters, which facilitates formation of auxin maxima and increases the cellular response to auxin treatment (Sauer et al. 2006).
One of the auxin-related mechanisms involved in cell growth is proton efflux dependent on H+-ATPase activity. The molecular basis of IAA–H+-ATPase interactions remains unclear, but some data indicated that IAA induced phosphorylation of the H+-ATPase (Hayashi et al. 2010). Using specific antibodies against the catalytic domain of AHA2 (Arabidopsis H+-ATPase2) and phosphorylated threonine-947 in AHA2 it was showed that Arabidopsis hypocotyl sections treated with IAA exhibited higher level of phosphorylated Thr-947, in comparison to the control plants. In the next stage, the phosphorylated H+-ATPase binding the 14-3-3 protein that increase the catalytic activity of the H+-ATPase (Takahashi et al. 2012). Since the similar mechanisms was described for FC, that also elevated H+-ATPase activity via phosphorylation of Thr-947 in AHA2 (Kinoshita and Shimazaki 2001), this regulation might be universal during cell elongation in plants.
Finally, for comparison, the results of an ‘intact seedling’ experiment for maize are shown in Fig. 11 (see also SI Figs. 4, 5). Note, that elongation growth and pH are cross-correlated for auxin and fusicoccin showing the time lag in the majority of cases for FC. For this kind of experiment, the correlation strength is, at least in some cases (concentration 10−7), more intense for auxin.
It seems that investigating the “acid growth hypothesis” and resolving mounting controversies is impossible using solely biological experiments today. This could be explored further using modelling such as that shown in this work. Paradoxically, in the case of this work, the experimentum crucis for a biological problem belonged to mathematical analysis. Further development of biological science and knowledge is also possible trough an interdisciplinary team providing a broader point of view, essential to create the synergy of knowledge.
Conclusion
As we know the molecular mechanisms of fusicoccin and auxin differ: (1) 14-3-3 protein interaction with the ATPase in the case of FC and (2) TIR1 and/or ABP1 binding and an unknown signalling pathway in the case of auxin. However, the H+-efflux mechanism by which auxin and fusicoccin cause the promotion of growth may be effectively similar at the level of primary wall tissues. At this lowest (molecular) level, an auto-correlation analysis of Lüthen et al. (1990) data led us to the conclusion that the primary wall growth rate and H+-efflux rate coincide.
Author contribution statement
Aleksandra Haduch-Sendecka: data aquisition and analysis. Mariusz Pietruszka: analyzed data, conceived and wrote the paper.
References
Antipova OV, Bartova LM, Kalashnikova TS, Obroucheva NV, Voblikova VD, Muromtsev GS (2003) Fusicoccin-induced cell elongation and endogenous fusicoccin-like ligands in germinating seeds. Plant Physiol Biochem 41:157–164
Awasthi R, Bhandari K, Nayyar H (2015) Temperature stress and redox homeostasis in agricultural crops. Front Environ Sci 3:1–24
Azuah RT, Kneller LR, Qiu Y, Tregenna-Piggot PLW, Brown CM, Copley JRD, Dimeo RM (2009) DAVE: a comprehensive software suite for the reduction, visualization, and analysis of low energy neutron spectroscopic data. J Res Nat Inst Stand Technol 114:341
Barbacci A, Lahaye M, Magnenet V (2013) Another brick in the cell wall: biosynthesis dependent growth model. PLoS ONE 8:e74400
Benkert R, Obermeyer G, Benturp F-W (1997) The turgor pressure of growing lily pollen tubes. Protoplasma 198:1–8
Berg JM, Tymoczko JL, Stryer L (2002) Biochemistry. Freeman & Company
Boyer JS (2009) Cell wall biosynthesis and the molecular mechanism of plant enlargement. Funct Plant Biol 36:383–394
Braidwood K, Breuer C, Sugimoto K (2014) My body is a cage: mechanisms and modulation of plant cell growth. New Phytol 201:388–402
Chapman EJ, Greenham K, Castillejo C, Sartor R, Bialy A, Sun TP, Estelle M (2012) Hypocotyl transcriptome reveals auxin regulation of growth-promoting genes through GA-dependent and-independent pathways. PLoS ONE 7:e36210
Chavarria-Krauser A, Jaeger W, Schurr U (2005) Primary root growth: a biophysical model of auxin-related control. Funct Plant Biol 32:849–862
Cosgrove DJ (1999) Enzymes and other agents that enhance cell wall extensibility. Annu Rev Plant Physiol Plant Mol Biol 50:391–417
Cosgrove DJ (2000a) Loosening of plant cell walls by expansins. Nature 407:321–326
Cosgrove DJ (2000b) Expansive growth of plant cell walls. Plant Physiol Biochem 38:109–124
Cosgrove DJ (2005) Growth of the plant cell wall. Nat Rev 6:850–861
de Saint Germain A, Ligerot Y, Dun EA, Pillot JP, Ross JJ, Beveridge CA, Rameau C (2013) Strigolactones stimulate internode elongation independently of gibberellins. Plant Physiol 163:1012–1025
Dorrington K (1980) The theory of viscoelasticity in biomaterials. In: Vincent JFV, Currey JD (eds) The mechanical properties of biological materials. 34th symposium of the society of experimental biology
Fry SC (2004) Plant cell wall metabolism: tracking the careers of wall polymers in living plant cells. New Phytol 161:641–675
Geitmann A, Ortega JK (2009) Mechanics and modelling of plant cell growth. Trends Plant Sci 14:467–478 (review)
Goda H, Sawa S, Asami T, Fujioka S, Shimada Y, Yoshida S (2004) Comprehensive comparison of auxin-regulated and brassinosteroid-regulated genes in Arabidopsis. Plant Physiol 134:1555–1573
Gray WM, Ostin A, Sandberg G, Romano CP, Estelle M (1998) High temperature promotes auxin-mediated hypocotyls elongation in Arabidopsis. Proc Natl Acad Sci USA 95:7197–7202
Guy C (1999) Molecular responses of plants to cold shock and cold acclimation. J Mol Microbiol Biotechnol 1:231–242
Haduch-Sendecka A, Pietruszka M, Zajdel P (2014) Power spectrum, growth velocities and cross-correlations of longitudinal and transverse oscillations of individual Nicotiana tabacum pollen tube. Planta 240:263–276
Hager A (2003) Role of plasma membrane H+-ATPase in auxin-induced elongation growth: historical and new aspects. J Plant Res 116:483–505
Hasanuzzaman M, Nahar K, Fujita M (2013) Extreme temperature responses, oxidative stress and antioxidant defense in plants. In: Vahdati K, Leslie C (eds) Abiotic stress—plant responses and applications in agriculture
Hayashi Y, Nakamura S, Takemiya A, Takahashi Y, Shimazaki KI, Kinoshita T (2010) Biochemical characterization of in vitro phosphorylation and dephosphorylation of the plasma membrane H+-ATPase. Plant Cell Physiol 51:1186–1196
Iba K (2002) Acclimative response to temperature stress in higher plants: approaches of gene engineering for temperature tolerance. Annu Rev Plant Biol 53:225–245
Karcz W, Burdach Z (2007) Effect of temperature on growth, proton extrusion and membrane potential in maize (Zea mays L.) coleoptiles segments. Plant Growth Regul 52:141–150
Kinoshita T, Shimazaki KI (2001) Analysis of the phosphorylation level in guard-cell plasma membrane H+-ATPase in response to fusicoccin. Plant Cell Physiol 42:424–432
Konefal A, Pietruszka M (2015) Monte Carlo simulation of proton efflux by a cuticle potential barrier (in preparation)
Kutschera U (2001) Stem elongation and cell wall proteins in flowering plants. Plant Biol 3:466–480
Kutschera U, Schopfer P (1985) Evidence against the auxin-growth theory of auxin action. Planta 163:483–493
Lewicka S, Pietruszka M (2006) Theoretical search for the growth-temperature relationship in plants. Gen Physiol Biophys 25:125–136
Lewicka S, Pietruszka M (2008) Central limit theorem and the short-term temperature response of coleoptiles and hypocotyls elongation growth. Acta Soc Bot Pol 77:289–292
Lewicka S, Pietruszka M (2010) Generalized phenomenological equation of plant growth. Gen Physiol Biophys 29:95–105
Lewicka S, Pietruszka M (2015) H+-efflux time delay and the role of cuticle potential barrier (in preparation)
Lintilhac P (2014) The problem of morphogenesis: unscripted biophysical control systems in plants. Protoplasma 251:25–36
Lockhart JA (1965) An analysis of irreversible plant cell elongation. J Theor Biol 8:264–275
Lüthen H (2015) What we can learn from old auxinology. J Plant Growth Regul 34:702–707
Lüthen H, Bigdon M, Böttger M (1990) Reexamination of the acid growth theory of auxin action. Plant Physiol 93:931–939
Marzec M, Muszynska A (2015) In silico analysis of the genes encoding proteins that are involved in the biosynthesis of the RMS/MAX/D pathway revealed new roles of strigolactones in plants. Int J Mol Sci 16:6757–6782
Metraux J, Taiz L (1978) Transverse viscoelastic extension in Nitella. 1. Relationship to growth rate. Plant Physiol 61:135–138
Ortega JKE (1985) Augmented growth equation for cell wall expansion. Plant Physiol 79:318–320
Peters WS, Felle H (1991) Control of apoplast pH in corn coleoptile segments. I: The endogenous regulation of cell wall pH. J Plant Physiol 137:655–661
Peters WS, Lüthen H, Böttger M, Felle H (1998) The temporal correlation of changes in apoplast pH and growth rate in maize coleoptile segments. Aust J Plant Physiol 25:21–25
Pietruszka M (2009) Self-consistent equation of plant cell growth. Gen Physiol Biophys 28:340–346
Pietruszka M (2010) Exact analytic solutions for a global equation of plant cell growth. J Theor Biol 264:457–466
Pietruszka M (2012) A biosynthesis/inactivation model for enzymatic WLFs or non-enzymatically mediated cell evolution. J Theor Biol 315:119–127
Pietruszka M (2013a) Pressure-induced cell wall instability and growth oscillations in pollen tubes. PLoS ONE 8:e75803
Pietruszka M (2013b) Special solutions to the Ortega equation. J Plant Growth Regul 32:102–107
Pietruszka M (2015a) pH/T duality—equation of state for plants. Front Plant Sci (in review). arXiv:1505.00327
Pietruszka M (2015b) pH/T duality—equation of evolution for plants. Front Plant Sci (in review)
Pietruszka M, Haduch-Sendecka A (2015) Pressure-induced wall thickness variations in multi-layered wall of a pollen tube and Fourier decomposition of growth oscillations. Gen Physiol Biophys 34:145–156
Pietruszka M, Lewicka S, Pazurkiewicz-Kocot K (2006) Thermodynamics of irreversible plant cell growth. Acta Soc Bot Pol 75:183–190
Pietruszka M, Lewicka S, Pazurkiewicz-Kocot K (2007) Temperature and the growth of plant cells. J Plant Growth Regul 26:15–25
Polyanin AD, Chernoutsan AI (2011) A concise handbook of mathematics, physics and engineering science, CRC Press
Porter JR, Gawith M (1999) Temperatures and the growth and development of wheat: a review. EurJ Agronom 10:23–36
Proseus TE, Boyer JS (2008) Calcium pectate chemistry causes growth to be stored in Chara carolina: a test of the pectate cycle. Plant Cell Environ 31:11147–11155
Richards FJ (1959) A flexible growth function for empirical use. J Exp Bot 10:290–300
Sauer M, Balla J, Luschnig C, Wiśniewska J, Reinöhl V, Friml J, Benková E (2006) Canalization of auxin flow by Aux/IAA-ARF-dependent feedback regulation of PIN polarity. Genes Dev 20:2902–2911
Schopfer P (2001) Hydroxyl radical-induced cell-wall loosening in vitro and in vivo: implications for the control of elongation growth. Plant J 28:679–688
Schopfer P (2008) Is the loss of stability theory a realistic concept of stress relaxation-mediated cell wall expansion during plant growth? Plant Phys 147:935–936
Stanley HE (1971) Introduction to phase transitions and critical phenomena. Oxford University Press
Taiz L (1984) Plant cell expansion: regulation of cell wall mechanical properties. Ann Rev Physiol 35:585–657
Takahashi K, Hayashi KI, Kinoshita T (2012) Auxin activates the plasma membrane H+-ATPase by phosphorylation during hypocotyl elongation in Arabidopsis. Plant Physiol 159:632–641
Wei C, Lintilhac P (2003) Loss of stability—a new model for stress relaxation in plant cell walls. J Theor Biol 224:305–312
Wei C, Lintilhac PM (2007) Loss of stability: a new look at the physics of cell wall behavior during plant cell growth. J Theor Biol 283:113–121
Went FW (1953) The effect of temperature on plant growth. Annu Rev Plant Physiol 4:347–362
Yamori W, Hikosaka K, Way DA (2014) Temperature response of photosynthesis in C3, C4, and CAM plants: temperature acclimation and temperature adaptation. Photosynth Res 119:101–117 (review)
Yan W, Hunt LA (1999) An equation for modelling the temperature response of plants using only the cardinal temperatures. Annals Bot 84:607–614
Zajdel P, Haduch-Sendecka A, Pietruszka M (2015) Application of the effective analytical formula of growth functional to quantitative description of growth of plant cells and organs (Plant Methods, in review). Python code “fitexex—application of exp(exp()) function for plant physiology”. https://github.com/pawelzajdel/fitexex
Zonia L, Munnik T (2011) Understanding pollen tube growth: the hydrodynamic model versus the cell wall model. Trends Plant Sci 16:347–352
Author information
Authors and Affiliations
Corresponding author
Additional information
Communicated by U. Feller.
Electronic supplementary material
Below is the link to the electronic supplementary material.
Appendix
Appendix
The cross-correlation of continuous functions f and g is defined in Eq. (4). By assuming f ≡ pH(t) and g ≡ u(t) (μm), the cross-correlation derivative (over time delay τ) can be calculated explicitly as follows:
where \( u^\prime \) is a growth rate.
Rights and permissions
Open Access This article is distributed under the terms of the Creative Commons Attribution 4.0 International License (http://creativecommons.org/licenses/by/4.0/), which permits unrestricted use, distribution, and reproduction in any medium, provided you give appropriate credit to the original author(s) and the source, provide a link to the Creative Commons license, and indicate if changes were made.
About this article

Cite this article
Pietruszka, M., Haduch-Sendecka, A. Effective diffusion rates and cross-correlation analysis of “acid growth” data. Acta Physiol Plant 38, 53 (2016). https://doi.org/10.1007/s11738-016-2068-z
Received:
Revised:
Accepted:
Published:
DOI: https://doi.org/10.1007/s11738-016-2068-z