
Abstract
The gram-negative bacterium ‘Candidatus Liberibacter solanacearum’ (Lso) causes potato zebra chip disease and carrot Lso disease, which resembles a physiological disorder, and has raised concern on its impact on carrot production and whether the pathogen can be transmitted via carrot seeds. Here, we evaluated the possibility of carrot seed transmission of the bacterium using grow-out tests and probability analyses. On the basis of the tests, we concluded that transmission is unlikely in practice. Therefore, this finding will help to promote the international trade of carrot seeds.
‘Candidatus Liberibacter solanacearum’ (Lso) is an unculturable gram-negative bacterium and the causal agent of potato zebra chip disease and carrot Lso disease (EPPO 2013, 2017). As of November 2019, in North and Central America (United States, Canada, Mexico, Guatemala, Honduras, Nicaragua, and El Salvador; EPPO Global Database https://gd.eppo.int/) and Oceania (New Zealand and Norfolk island of Australia; EPPO Global Database), Lso has been reported to infect solanaceous crops such as potato (as zebra chip disease), tomato, pepper, and tobacco (EPPO 2013; Haapalainen 2014), and weeds. Also, in Europe (Austria, Belgium, Estonia, Finland, France, Germany, Greece, Italy, Norway, Portugal, Spain, Sweden, and the United Kingdom), North Africa (Morocco and Tunisia), and Israel, Lso has been associated with symptoms in plants of the Apiaceae family such as carrot (as Lso disease), celery, and parsnip (EPPO 2013; Teresani et al. 2014). In general, Lso is transmitted from infected plants to healthy plants via psyllid vectors and by grafting of vegetative organs, including seed tube seedlings (EPPO 2013, 2017; Munyaneza 2012). However, seed transmission of Lso has also been reported for carrot (Bertolini et al. 2015). If seedlings (plants developed from seeds) derived from Lso-infected plants are naturally infected with Lso, the spread of this disease in carrot-producing regions is unavoidable. Symptoms of Lso carrot disease include leaf curling, leaf discoloration, stunted shoots and roots, secondary root proliferation, and reduced edible root volume (EPPO 2013; Munyaneza et al. 2010). Understandably, therefore, carrot seed producers, carrot farmers, seed companies, and plant quarantine agencies in various countries are concerned about potential economic damage. On the other hand, recent studies have indicated that seed transmission of Lso is unlikely in some situations (ISF 2017; Loiseau et al. 2017a, b; Oishi et al. 2017). Because it is presently unclear whether seed transmission of Lso can occur, Lso infection in carrot remains categorized as “pathway not proven” (PNP) in the seed industry. There are currently no Lso-infected crops in Japan, so it is important to investigate the potential for Lso disease to be transmitted via Lso-contaminated carrot seeds. In this study, considering previous work on Lso transmission via Lso-contaminated seeds (Bertolini et al. 2015; ISF 2017; Loiseau et al. 2017a, b; Oishi et al. 2017), we cultivated seedlings derived from Lso-contaminated seeds and determined whether the seedlings were Lso-positive. Moreover, using probability analyses, we estimated the proportion of Lso transmission from seeds to seedlings.
Because no Lso-related diseases or no Lso-contaminated domestic carrot seeds have been reported in Japan, for the present study and our previous study (Fujikawa et al. 2019), three Lso-contaminated carrot seed lots were provided by the Japan Seed Trade Association (JASTA) under a special permit (28Y763) issued by the Japanese Ministry of Agriculture, Forestry, and Fisheries (MAFF). These seed lots were produced in typical seed production fields in France. Additionally, as a negative control, one Lso-free healthy seed lot from the United States provided by the JASTA was used. All seeds had been harvested according to the seed industry practice. We stored the untreated seeds at 4 °C to maintain their viability but not kill any Lso. At least some of the Lso cells on the seeds were confirmed to be alive because we confirmed transcription of Lso-derived RNA and the lack of transcription after sterilization treatments. For each Lso-contaminated seed lot, DNA was extracted individually from 100 seeds using a DNeasy Plant Mini Kit (Qiagen, Hilden, Germany) according to the manufacturer’s instructions. Then, each plant sample was immersed in the AP1 buffer provided in the kit and was ground with a pestle and mortar. TaqMan probe quantitative PCR (qPCR) with the LsoF/HLBr primer set and an HLBp probe was performed according to the methodology of Li et al. (2009) to estimate the contamination rates of the carrot seed lots. Lso contamination rates of three lots were thus found to be 58% (58 positive seeds/100 test seeds in lot A), 52% (52 positive seeds/100 test seeds in lot B), and 45% (45 positive seeds/100 test seeds in lot C), respectively.
To clarify whether the seedlings from the Lso-contaminated seeds were Lso-positive, we performed grow-out tests for two consecutive years. Briefly, about 240 seeds from each Lso-contaminated seed lot and 100 seeds from the Lso-free seed lot were sown and maintained in pots (Fig. 1). All plants were cultivated to be assayed for 5 months each year with 8 h light/16 h dark at 20 °C and about 50% relative humidity. During the first 3 weeks of cultivation, the temperature was set to 25 °C. Temperature, humidity, and day length for carrot cultivation for the bioassay were the same as for other studies on seed transmission of Lso (Bertolini et al. 2015; Loiseau et al. 2017b). The seedlings from Lso-contaminated seed lots were maintained in a containment plant growth room, and seedlings from the Lso-free seed lot were maintained in a containment greenhouse. Leaves were collected from each plant at 3 months and 5 months after sowing the first year and 5 months after sowing the second year. DNA was purified from the leaves using a DNeasy Plant Mini Kit (Qiagen) and analyzed for the presence of Lso using qPCR and endpoint (conventional) PCR. To detect Lso, the first screening test used TaqMan probe qPCR with the LsoF/HLBr primer set and HLBp probe (Li et al. 2009). Any positive samples were screened two more times to confirm they were true positives; the second test was SYBR green fluorescent qPCR with the Lso931F/LsoLss primer set, and the third test was endpoint PCR with the Lso972F/LsoLss primer set (Fujiwara and Fujikawa 2016). In the first year, we sowed seeds on May 9, 2017 and collected plant leaves 3 months after sowing (August 8, 2017) and 5 months after sowing (October 18, 2017). In the second year, we sowed seeds on June 22, 2018 and collected plant leaves 5 months after sowing (November 21, 2018). Plants were carefully observed for symptoms suggestive of Lso infection in the seedlings derived from Lso-contaminated seeds, and no typical symptoms were observed during the test periods in any of the three Lso-contaminated lots or in the negative control (Lso-free) lot (Table 1). In the Lso detection tests using each DNA sample, all seedlings from the negative control lot were Lso-negative in the first screening test (Table 1). On the other hand, some seedlings from the Lso-contaminated lots tested Lso-positive in the first screening test (Table 1). To determine the true Lso-positives, we performed two further confirmation tests. Then, all seedlings that did not test positive when performing the confirmation tests were classified as Lso-negative (Table 1).

Cultivation of seedlings from seed lots contaminated with ‘Candidatus Liberibacter solanacearum’ (Lso). Seedlings were maintained in a containment plant growing room or in a containment greenhouse (a) during the test periods (at 5 months after sowing); no typical symptoms of Lso infection were observed in either the Lso-contaminated seeds or (b) in the Lso-free seeds
Next, statistical analyses were carried out using experimental data to evaluate the potential for Lso transmission from seeds to seedlings. It is impossible to definitively claim that there is no potential for transmission, even with a huge amount of negative data is collected in a large-scale investigation. Therefore, the potential for transmission should be judged statistically, using w as the proportion of transmission of a pathogen from a seed to the seedling that develops. If w can be shown to be sufficiently small using an appropriately reliable statistical method, we can conclude that the transmission is practically negligible, although it is impossible to show that w equals exactly zero, as stated above. We estimated the value of w using the following analyses.
- 1.
Estimation of seed infection rate
We first estimated the seed infection rate for each seed lot because infection rate is related to pathogen density. We can consider an inspection in which k lots of seeds were examined with \(\lambda\)i the infection rate for seeds in the ith lot (\(i=1, 2, \dots , k\)) and \({X}_{i}\) the number of attacks by pathogens on one seed in the ith lot. We can assume that the spatial interaction of seeds and pathogens is locally random. Hence, we can use a Poisson distribution to represent the local frequency of attacks. Thus, the probability that a seed receives \({x}_{i}\) attacks, which is denoted by \(\mathrm{P}\mathrm{r}\left({X}_{i}={x}_{i}\right)\), is given by
$$\mathrm{P}\mathrm{r}\left({X}_{i}={x}_{i}\right)=\frac{{e}^{-{\lambda }_{i}}{\cdot {\lambda }_{i}}^{{x}_{i}}}{{x}_{i}!}.$$(1)A seed is infected if the frequency of attacks is larger than 0. Therefore, the proportion of infected seeds in the ith lot, which is denoted by \({P}_{i}\), is calculated as the sum of the non-zero terms of Eq. 1:
$${P}_{i}=1-\mathrm{P}\mathrm{r}\left({X}_{i}=0\right)=1-{e}^{-{\lambda }_{i}}.$$(2)Let \({n}_{\mathrm{A}i}\) be the number of observed seeds in the ith lot, and let \({R}_{\mathrm{A}i}\) be the number of infected seeds in the sample from the ith lot. Each seed in the ith lot is infected with a probability of \({P}_{i}\). Hence, the probability that the observed number of infected seeds is \({r}_{\mathrm{A}i}\) in the sample, which is denoted by \(\mathrm{P}\mathrm{r}\left({R}_{\mathrm{A}i}={r}_{\mathrm{A}i}\right)\), is represented by a binomial distribution:
$$\mathrm{P}\mathrm{r}\left({R}_{\mathrm{A}i}={r}_{\mathrm{A}i}\right)=\left(\begin{array}{c}{n}_{\mathrm{A}i}\\ {r}_{\mathrm{A}i}\end{array}\right){{P}_{i}}^{{r}_{\mathrm{A}i}}{\left({1-P}_{i}\right)}^{{{n}_{\mathrm{A}i}-r}_{\mathrm{A}i}.}$$(3)We can obtain the maximum likelihood estimate of \({\lambda }_{i}\), which is denoted by \(\hat{\lambda }_{i}\), by solving the equation \(\partial {\mathrm{l}\mathrm{o}\mathrm{g}}_{e}[\mathrm{P}\mathrm{r}\left({R}_{\mathrm{A}i}={r}_{\mathrm{A}i}\right)]/\partial {\lambda }_{i}=0,\) after substituting Eq. 2 into Eq. 3 to eliminate \({P}_{i}\). The solution is given in Eq. 4:
$$\widehat{{\lambda }_{i}}=-{\mathrm{log}}_{e}\left(1-\frac{{r}_{\mathrm{A}i}}{{n}_{\mathrm{A}i}}\right).$$(4) - 2.
Predicting the probability of seedling infection
We can derive the probability of seedling infection in the ith lot, which is denoted by \({Q}_{i}\), by using a similar method to that used to derive the probability of seed infection (\({P}_{i}\)). Let w be the probability that the infection in a seed, from an attack by a pathogen, is transmitted to the seedling. We can refer to w as the proportion of transmission from seed to seedling. Then, the infection rate for the seedling in the ith lot is given by \(w\lambda\)i. Hence, the probability of seedling infection is given by the sum of the non-zero terms of the Poisson distribution.
$${Q}_{i}=1-{e}^{-{w\lambda }_{i}}.$$(5)Let \({n}_{\mathrm{B}i}\) be the number of observed seedlings in the ith lot, and let \({R}_{\mathrm{B}i}\) be the number of infected seedlings in the sample from the ith lot. Each seed in the ith lot is infected with a probability of \({Q}_{i}\). Hence, the probability that the observed number of infected seedlings is \({r}_{\mathrm{B}i}\) in the sample, which is denoted by \(\mathrm{P}\mathrm{r}\left({R}_{\mathrm{B}i}={r}_{\mathrm{B}i}\right)\), is represented by a binomial distribution.
$$\mathrm{P}\mathrm{r}\left({R}_{\mathrm{B}i}={r}_{\mathrm{B}i}\right)=\left(\begin{array}{c}{n}_{\mathrm{B}i}\\ {r}_{\mathrm{B}i}\end{array}\right){{Q}_{i}}^{{r}_{\mathrm{B}i}}{\left({1-Q}_{i}\right)}^{{{n}_{\mathrm{B}i}-r}_{\mathrm{B}i}}.$$(6)The probability that no infected seedlings will be observed in the ith lot is given by \(\mathrm{P}\mathrm{r}\left({R}_{\mathrm{B}i}=0\right)={\left({1-Q}_{i}\right)}^{{n}_{\mathrm{B}i}}\). If no infected seedlings are observed in any of the k lots, the probability of such an observation is given by multiplying \(\mathrm{P}\mathrm{r}\left({R}_{\mathrm{B}i}=0\right)\) for all lots. By substituting Eq. 5 into Eq. 6 for \({r}_{Bi}=0\) and by multiplying them, we obtain:
$$\mathrm{P}\mathrm{r}\mathrm{o}\mathrm{b}\mathrm{a}\mathrm{b}\mathrm{i}\mathrm{l}\mathrm{i}\mathrm{t}\mathrm{y} \,\mathrm{t}\mathrm{h}\mathrm{a}\mathrm{t}\, \mathrm{n}\mathrm{o} \,\mathrm{i}\mathrm{n}\mathrm{f}\mathrm{e}\mathrm{c}\mathrm{t}\mathrm{i}\mathrm{o}\mathrm{n}\, \mathrm{i}\mathrm{s} \, \mathrm{o}\mathrm{b}\mathrm{s}\mathrm{e}\mathrm{r}\mathrm{v}\mathrm{e}\mathrm{d}\, \mathrm{i}\mathrm{n} \, \mathrm{s}\mathrm{e}\mathrm{e}\mathrm{d}\mathrm{l}\mathrm{i}\mathrm{n}\mathrm{g}\mathrm{s}=\prod_{i=1}^{k}{\left({1-Q}_{i}\right)}^{{n}_{\mathrm{B}i}} =\mathrm{e}\mathrm{x}\mathrm{p}\left(-w\sum_{i=1}^{k}{\lambda }_{i}{n}_{\mathrm{B}i}\right).$$(7) - 3.
Estimating the rate of transmission from seeds to seedlings
The probability that no infection is observed in the seedling sample decreases with increasing rate of transmission (w) in Eq. 7. Hence, we can calculate the 95% confidence interval of the definition of Fisher (1973) in estimating w. The definition of Fisherian 95% confidence intervals is as follows: if the true quantity of w lies outside the 95% confidence interval, an extreme observation (such as that observed in the current data) occurs at a probability of less than 5%. We can intuitively consider that the true quantity of w will probably lie within the Fisherian 95% confidence interval, but we can never say that the probability of w lying within the Fisherian 95% confidence interval is 95%. The proportion of infection becomes either large or small simply as a consequence of chance; we cannot predict the direction of deviation. Hence, we should consider the extreme range of 2.5% on both sides in the definition of Fisherian 95% confidence intervals.
Let \({w}_{\mathrm{U}}\) be the upper limit of the Fisherian 95% confidence interval for the proportion of transmission w from seed to seedling. Then, we can calculate \({w}_{\mathrm{U}}\) by solving the following equation where Eq. 7 equals 0.025:
$$\mathrm{e}\mathrm{x}\mathrm{p}\left(-w\sum_{i=1}^{k}{\lambda }_{i}{n}_{\mathrm{B}i}\right)=0.025.$$(8)We do not know the true quantity of \(\lambda\)i, i.e., the true infection rate for seeds in the ith lot. Hence, we add the maximum likelihood estimate of \(\lambda\)i to Eq. 8. This kind of procedure is usually called plug-in estimation. By substituting Eq. 4 into Eq. 8 and by rearranging it, we obtain:
$${w}_{\mathrm{U}}=\frac{{\mathrm{l}\mathrm{o}\mathrm{g}}_{e} 0.025}{{\sum }_{i=1}^{k}{{n}_{\mathrm{B}i}\mathrm{l}\mathrm{o}\mathrm{g}}_{e}[1-\left({r}_{\mathrm{A}i}/{n}_{\mathrm{A}i} \right)]}.$$(9)We can consider that the true quantity of w will probably be less than \({w}_{\mathrm{U}}\), based on the definition of the Fisherian 95% confidence interval.
We substituted the maximum likelihood estimate (\(\hat{\lambda }_{i}\)) for \(\lambda\)i in deriving Eq. 9. However, if the data contains a replication where all seeds are infected (i.e., \({r}_{\mathrm{A}i}={n}_{\mathrm{A}i}\)), the maximum likelihood estimate of \(\lambda\)i diverges to infinity. Such phenomenon occurs due to the discreteness of count data (Yamamura 1999). In such cases, we should use the empirical logit transformation where \({r}_{\mathrm{A}i}\) is replaced by \({(r}_{\mathrm{A}i}+0.5)\) while \({n}_{\mathrm{A}i}-{r}_{\mathrm{A}i}\) is replaced by \({({n}_{\mathrm{A}i}-r}_{\mathrm{A}i}+0.5)\). Then, Eq. 9 is modified to
$${w}_{\mathrm{U}}=\frac{{\mathrm{l}\mathrm{o}\mathrm{g}}_{e} 0.025}{{\sum }_{i=1}^{k}{{n}_{\mathrm{B}i}\mathrm{l}\mathrm{o}\mathrm{g}}_{e}[1-\left({r}_{\mathrm{A}i}+0.5\right)/\left({n}_{\mathrm{A}i}+1\right)]}.$$(10)Note that the definition of 95% confidence intervals given by Fisher (1973) differs from that of Neyman-Pearson (Neyman 1934), which has been adopted in most statistical textbooks. Neyman-Pearson 95% confidence intervals are used to control the error rate of decisions in a series of experiments, while Fisherian 95% confidence intervals are used to evaluate the locations of true parameters.
- 4.
Experiments completed to performing estimations
We performed seed germination tests to calculate the upper limit (\({w}_{\mathrm{U}}\)) of the rate of transmission from seeds to seedlings. This was a simple modification of the grow-out test described above. Over 600 seeds from each of the three Lso-contaminated seed lots were sown on fully moistened pleated papers placed on containers (Fig. 2). The containers were aseptically maintained in the laboratory. Seven to 10 days after sowing, about 600 seedlings with fully emerged radicles were collected from each of the respective lots. After seed parts (seed coats and residues) were carefully removed, the DNA from embryo parts (radicles, hypocotyls, and cotyledons) was purified. These samples were then analyzed using TaqMan probe qPCRs to detect Lso (Li et al. 2009).
Fig. 2 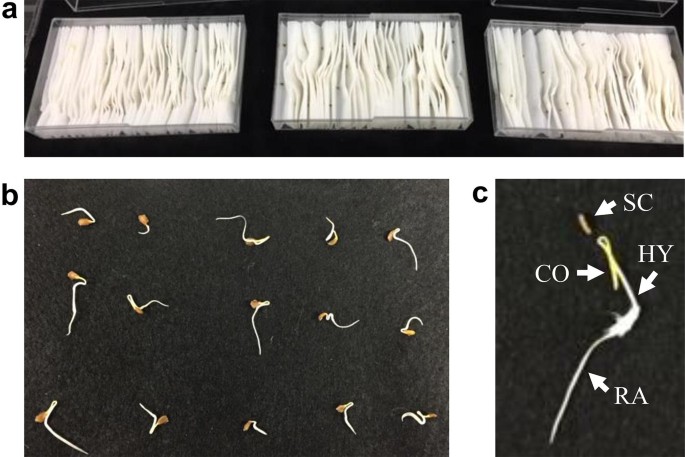
Seedlings from seeds contaiminated with ‘Candidatus Liberibacter solanacearum’ (Lso). Seeds of three Lso-contaminated seed lots were sown in fully moistened seed test pleated papers in containers and were maintained aseptically (a) at 7–10 days after sowing. Seedlings with fully developed radicles (b). Seed coats and residues were removed to collect DNA from embryo (c). CO cotyledon, HY hypocotyls, RA radicle, SC seed coat

No samples tested positive for Lso in this analysis (Table 2). The infection rate for seeds (\({\lambda }_{i}\)) was also estimated using the proportion of contamination of seeds (Table 2). Then, we calculated the upper limit of Fisherian 95% confidence interval for w using Eq. 10. The calculated upper limit was 0.28% (Table 2), indicating that, by the definition of Fisherian 95% confidence interval, the current data will be rare if the true proportion of transmission is larger than 0.28%. In that sense, we will be able to interpret the proportion of transmission to be smaller than 0.28%.
How can we determine the permissible amount (w) of the proportion of transmission from seed to seedlings? This question is a problem in the field of invasion ecology. We should control the probability of invasion per specified period, e.g., the probability of invasion per year, to a sufficiently small quantity. The probability of invasion can be calculated using an equation similar to Eq. 7 (Yamamura et al., 2001). Let \(j\) be the number of seed lots imported per year, \({N}_{i}\) be the total number of seeds in the \(i\)th lot, \({\lambda }_{i}\) be the infection rate for seeds in the \(i\)th lot after quarantine regulation. Then, the probability of invasion via seedlings per year, which is denoted by R, is given by
If the rate of infection (\({\lambda }_{i}\)) is sufficiently small, \({\lambda }_{i}\) becomes identical to the proportion of infection, which is denoted by \({P}_{i}\). Then, Eq. 11 can be approximately expressed by
Thus, the probability of invasion is related to three quantities: the proportion of transmission from seed to seedlings (\(w\)), the proportion of infected seed in the ith lot (\({P}_{i}\)), and the total number of seeds in the ith lot (\({N}_{i}\)). The quantity of \(w\) is determined by the biological property of pathogen and hosts. The quantity of \({N}_{i}\) is largely determined by the characteristics of transportation. Thus, we cannot usually control the quantities of \(w\) and \({N}_{i}\). In contrast, we can control the quantity of \({P}_{i}\) with quarantine inspection. Equation 12 indicates that a unit change in \(w\) has the same influence as a unit change in \({P}_{i}\) as for the invasion probability (\(R\)). Thus, the permissible quantity of \(w\) will be closely related to our mode of quarantine inspection.
Yamamura et al. (2016) explained the statistical procedure that has been adopted in the import plant quarantine regulation in Japan. An “infested consignment” is defined as “a consignment of which the proportion of infested plants is not smaller than \({p}_{\mathrm{C}}\)”. The quantity of \({p}_{\mathrm{C}}\) indicates the critical proportion that is not permissible. Four levels of impermissible proportions of infested plants are used in import plant quarantine inspections in Japan: \({p}_{\mathrm{C}}\) = 0.15, 0.33 (or 0.3), 0.50, and 1.00%. The level of \({p}_{\mathrm{C}}\) is determined by considering the possibility of invasion for respective pests. As for the seeds for planting (except for rice, barley, and wheat), the specified quantity of \({p}_{C}\) is 0.3% for the standard size of consignment according to Annex Table 1 of Article 1 of the import plant quarantine regulation in Japan (Yamamura et al. 2016). Then, the sample size that is required for inspecting a consignment is calculated to control the probability that an infested consignment is erroneously imported into Japan. Note that Eq. 12 indicates that the probability of invasion is determined by \({wP}_{i}\) under a given size of consignments. The quarantine inspection is designed to control the parameters to be \({P}_{i}<{p}_{\mathrm{C}}\), assuming that \(w=1\). The level of \({wP}_{i}\) is controlled at 0.3% in the import plant inspection for seeds of carrot for planting. Our statistical analyses indicated that the upper limit of Fisherian 95% confidence interval of \(w\) is \({w}_{\mathrm{U}}=0.28\%\) for Lso. Then, the quantity of \({wP}_{i}\) is smaller than 0.28% for Lso without performing quarantine inspection because \({P}_{i}\) does not become larger than 1. Thus, the probability of invasion of Lso via carrot seeds will not become larger than that adopted in the import quarantine inspection in Japan.
An equation similar to Eq. 10 has been adopted in the quarantine regulation in Japan against Sharka disease caused by plum pox virus (PPV, genus Potyvirus, family Potyviridae) in determining the actual range of host. PPV was found on Japanese apricot Prunus mume in Japan in 2009, and emergency control was quickly started to contain the pathogen. PPV infects various host species of genus Prunus; hence, transport of Prunus species was prohibited in the emergency control. The species that belongs to subgenus Cerasus, e.g., Cerasus × yedoensis ‘Somei-yoshino’, was also included in the list of prohibition. However, gardeners strongly requested that subgenus Cerasus be excluded from the list of prohibition because no Sharka disease has been observed for Cerasus in fields. The Japanese Ministry of Agriculture Forestry and Fisheries (MAFF) then started statistical analyses in 2012 to assess the range of hosts epidemiologically. Equation 9 was used in these analyses, but the interpretation of parameter \(w\) was slightly different; \(w\) was defined as the relative ratio of the infection pressure on Cerasus to the pressure on Japanese apricot (Prunus mume). The calculated upper limit of Fisherian 95% interval was \({w}_{\mathrm{U}}=0.88\mathrm{\%}\) (Yamamura, 2019). MAFF judged this quantity sufficiently small. A literature survey also confirmed that no natural infection had been reported for Cerasus aside from artificial inoculation. On the bases of the statistical analyses and the literature survey, MAFF decided in 2013 to exclude subgenus Cerasus from the prohibited list. The estimated \({w}_{\mathrm{U}}\) of Lso (0.28%) for the carrot seeds is smaller than this threshold (0.88%); hence, excluding carrot seeds from the prohibited list is worth considering.
Our statistical method is widely applicable to other experimental results on the possibility of transmission. If the proportion of transmission of pathogens from seed to seedling (\(w\)) is suspected to change depending on the experimental conditions, we should calculate the upper limit of confidence limit (\({w}_{\mathrm{U}}\)) separately for each case. Among the articles reporting the results from grow-out tests, the article by Loiseau et al. (2017b) most clearly showed the seed contamination rate for each seed lot and the number of seedlings investigated for the presence of Lso. Hence, we can apply the statistical analyses to their data. The calculated upper limit of Fisherian 95% confidence interval was \({w}_{\mathrm{U}}=0.23\%\) (Suppl Table S1). Thus, the quantity of \({w}_{\mathrm{U}}\) was also very small. If we can assume that the proportion of transmission is the same among experiments, we can combine the data from different sources. The combined data yield a quantity of \({w}_{\mathrm{U}},\) which is smaller than those calculated separately; \({w}_{\mathrm{U}}=0.13\%\) in our case (Suppl Table S1).
In this study, we clarified that there is a very low potential for Lso to be transmitted from carrot seeds to carrot seedlings. Currently, several countries demand that carrot seeds be tested for Lso contamination during international transport of carrot seeds (Australian Department of Agriculture and Water Resources 2015; General Administration of Quality Supervision, Inspection and Quarantine of the People’s Republic of China 2017; Ministry for Primary Industries of New Zealand 2018; Plant Protection Station, the Ministry of Agriculture, Forestry and Fisheries of Japan 2016). In addition, if an Lso-contaminated seed lot is found, appropriate disinfection is also demanded in these countries (Fujikawa et al. 2019). If this is not possible, the seed lot must be discarded. These demands are important for maintaining the distribution of healthy seeds and for preventing the spread of Lso into importing countries. However, these checks not only impose an economic burden on seed companies and on the plant quarantine agencies of many countries, but also affect the speed and ease of transport worldwide. Therefore, reviewing the inspection conditions and methods used to detect pathogens with a low potential for seed transmission in the field of international seed distribution will be useful. Our finding that seed transmission of Lso is unlikely in practice will support the promotion of the international distribution of carrot seeds, benefiting the seed industry and phytosanitary agencies.
References
Australian Department of Agriculture and Water Resources (2017) Final pest risk analysis for ‘Candidatus Liberibacter solanacearum’ associated with apiaceous crops. https://www.agriculture.gov.au/sites/default/files/sitecollectiondocuments/biosecurity/risk-analysis/plant-reviews/final-report-candidatus-liberibacter-solanacearum-apiaceous.pdf. Accessed 20 Jan 2020
Bertolini E, Teresani GR, Loiseau M, Tanaka FAO, Barbé S, Martínez C, Gentit P, López MM, Cambra M (2015) Transmission of ‘Candidatus Liberibacter solanacearum’ in carrot seeds. Plant Pathol 64:276–285
EPPO (2013) Candidatus Liberibacter solanacearum. Bull OEPP/EPPO Bull 43:197–201
EPPO (2017) PM 9/25 (1) Bactericera cockerelli and ‘Candidatus Liberibacter solanacearum’. Bull OEPP/EPPO Bull 47:513–523
Fisher RA (1973) Statistical methods and scientific inference, 3rd edn. Hafner Press, New York
Fujiwara K, Fujikawa T (2016) Primers for both conventional and real-time PCR in diagnosis of ‘Candidatus Liberibacter solanacearum’. J Plant Pathol 98:63–68
Fujikawa T, Taguchi M, Kido K, Kusano S, Enya J, Mihara T, Kaku H, Sato M (2019) Evaluation of an RNA-based PCR assay to detect viable Candidatus Liberibacter solanacearum (Lso) in Lso-contaminated carrot seed using different disinfection methods. J Plant Pathol. https://doi.org/10.1007/s42161-019-00405-4
General Administration of Quality Supervision, Inspection and Quarantine of the People’s Republic of China (2017) Notice on the interception of potato zebra chip disease bacterium in imported carrot seeds. https://www.aqsiq.gov.cn/xxgk_13386/ywxx/dzwjy/201708/t20170817_495767.htm. Released 17 Aug 2017, Accessed 28 Aug 2019.
Haapalainen M (2014) Biology and epidemics of Candidatus Liberibacter species, psyllid-transmitted plant-pathogenic bacteria. Ann Appl Biol 165:172–198
ISF (2017) Detection of Candidatus Liberibacter solanacearum on carrot seeds. Version 1.1. https://www.worldseed.org/wp-content/uploads/2017/03/Detection_Carrot_Lso_2017.pdf. Accessed 28 Aug 2019
Li W, Abad JA, French-Monar RD, Rascoe J, Wen A, Gudmestad NC, Secor GA, Lee IM, Duan Y, Levy L (2009) Multiplex real-time PCR for detection, identification and quantification of ‘Candidatus Liberibacter solanacearum’ in potato plants with zebra chip. J Microbiol Methods 78:59–65
Loiseau M, Renaudin I, Cousseau-Suhard P, Poliakoff F, Gentit P (2017a) Transmission tests of ‘Candidatus Liberibacter solanacearum’ by carrot seeds. Acta Hortic 1153:41–46
Loiseau M, Renaudin I, Cousseau-Suhard P, Lucas PM, Forveille A, Gentit P (2017b) Lack of evidence of vertical transmission of ‘Candidatus Liberibacter solanacearum’ by carrot seeds suggests that seed is not a major transmission pathway. Plant Dis 101:2104–2109
Ministry for Primary Industries of New Zealand (2018) New measures for seed of carrot, fennel, and other Apiaceae species. https://www.mpi.govt.nz/dmsdocument/19019-summary-of-new-measures-for-seed-of-apiaceae-species. Released 13 Feb 2018, Accessed 28 Aug 2019
Munyaneza JE (2012) Zebra chip disease of potato: biology, epidemiology, and management. Am J Potato Res 89:329–350
Munyaneza JE, Fisher TW, Sengoda VG, Garczynski SF, Nissinen A, Lemmetty A (2010) First report of “Candidatus Liberibacter solanacearum” associated with psyllid-affected carrots in Europe. Plant Dis 94:639
Neyman J (1934) On the two different aspects of the representative method. J Roy Stat Soc 97:558–606
Oishi M, Hoshino S, Fujiwara Y, Ushiku S, Kobayashi Y, Namba I (2017) A comparison of protocols to detect Candidatus Liberibacter solanacearum from carrot seeds, research on the effectiveness of propidium monoazide treatment and evaluation of seed transmission in carrot seeds. Res Bull Plant Prot Japan 53:111–117 (in Japanese with English summary)
Plant Protection Station, the Ministry of Agriculture, Forestry and Fisheries of Japan (2016) List of the plants subject to specific phytosanitary measures to be carried out in exporting countries (Annexed Table 2–2 of the Ordinance for Enforcement of the Plant Protection Act). https://www.pps.go.jp/english/law/list2-2.html. Accessed 28 Aug 2019
Teresani GR, Bertolini E, Alfaro-Fernández A, Martínez C, Tanaka FAO, Kitajima EW, Roselló M, Sanjuán S, Ferrándiz JC, López MM, Cambra M (2014) Association of ‘Candidatus Liberibacter solanacearum’ with a vegetative disorder of celery in Spain and development of real-time PCR method for its detection. Phytopathology 104:804–811
Yamamura K (1999) Transformation using (x + 0.5) to stabilize the variance of populations. Res Popul Ecol 41:229–234
Yamamura K, Katsumata H, Watanabe T (2001) Estimating invasion probabilities: a case study of fire blight disease and the importation of apple fruits. Biol Invasions 3:373–378
Yamamura K, Katsumata H, Yoshioka J, Yuda T, Kasugai K (2016) Sampling inspection to prevent the invasion of alien pests: statistical theory of import plant quarantine systems in Japan. Popul Ecol 58:63–80
Yamamura K (2019) Appropriate spatial range to control plum pox virus (PPV) by the emergency control. Jpn J Conserv Ecol (in Japanese with English summary) (in press)
Acknowledgements
Special thanks to the Japan Seed Trade Association (JASTA) and the International Seed Health Initiative (ISHI) Japan team for their cooperation. We also thank the members of the IFTS-NARO and CSS-NARO for helpful discussions. We appreciate the plant Protection Division, Food Safety and Consumer Affairs Bureau, the Ministry of Agriculture, Forestry and Fisheries (MAFF), and the Yokohama Plant Protection Station for their essential cooperation. We thank Editage (www.editage.jp) for English language editing.
Funding
This study was funded by a Grant-in-Aid for Development of Detection and Identification Techniques of Pests in Research and Development for Global Warming Adaptation and Abnormal Weather Correspondence from the Ministry of Agriculture, Forestry, and Fisheries of Japan.
Author information
Authors and Affiliations
Contributions
TF, KY, MS, KO, and NO conceived and designed the experiments. TF, KO, NO, MT, and AS contributed to the experiments. TF, KY, MS, KO, and NO contributed to data analysis. TF, KY, KO, NO, and MS contributed to writing the manuscript.s
Corresponding author
Ethics declarations
Conflict of interest
The authors declare that they have no conflicts of interest.
Ethical approval
This article does not contain any studies using human participants or animals performed by any of the authors.
Additional information
Publisher's Note
Springer Nature remains neutral with regard to jurisdictional claims in published maps and institutional affiliations.
Electronic supplementary material
Below is the link to the electronic supplementary material.
10327_2020_927_MOESM1_ESM.xlsx
Additional Supporting Information may be found in the online version of this article on the publisher’s website. (XLSX 12 kb)
Rights and permissions
Open Access This article is licensed under a Creative Commons Attribution 4.0 International License, which permits use, sharing, adaptation, distribution and reproduction in any medium or format, as long as you give appropriate credit to the original author(s) and the source, provide a link to the Creative Commons licence, and indicate if changes were made. The images or other third party material in this article are included in the article's Creative Commons licence, unless indicated otherwise in a credit line to the material. If material is not included in the article's Creative Commons licence and your intended use is not permitted by statutory regulation or exceeds the permitted use, you will need to obtain permission directly from the copyright holder. To view a copy of this licence, visit http://creativecommons.org/licenses/by/4.0/.
About this article

Cite this article
Fujikawa, T., Yamamura, K., Osaki, K. et al. Seed transmission of ‘Candidatus Liberibacter solanacearum’ is unlikely in carrot. J Gen Plant Pathol 86, 266–273 (2020). https://doi.org/10.1007/s10327-020-00927-1
Received:
Accepted:
Published:
Issue Date:
DOI: https://doi.org/10.1007/s10327-020-00927-1