
Abstract
The purpose of this study was to evaluate computed analysis of three-dimensional (3D) cone-beam computed tomography angiography (CTA) of the liver for determination of subsegmental tumor-feeding vessels (FVs). Eighteen consecutive patients underwent transarterial chemoembolization (TACE) from January to October 2008 for 25 liver tumors (15 hepatocellular carcinomas [HCCs] and 10 neuroendocrine metastases). Anteroposterior projection angiogram (two-dimensional [2D]) and 3D cone-beam CTA images were acquired by injection of the common hepatic artery. Retrospectively, FVs were independently identified by three radiology technologists using a software package (S) that automatically determines FVs by analysis of 3D images. Subsequently, three interventional radiologists (IRs) independently identified FVs by reviewing the 2D images followed by examination of the 3D images. Finally, the “ground truth” for the number and location of FVs was obtained by consensus among the IRs, who were allowed to use any imaging―including 2D, 3D, and all oblique or selective angiograms―for such determination. Sensitivities, durations, and degrees of agreement for review of 2D, 3D, and S results were evaluated. Sensitivity of 3D (73%) was higher than 2D (64%) images for identification of FVs (P = 0.036). The sensitivity of S (93%) was higher than 2D (P = 0.02) and 3D (P = 0.005) imaging. The duration for review of 3D imaging was longer than that for 2D imaging (187 vs. 94 s, P = 0.0001) or for S (135 s, P = 0.0001). The degree of agreement between the IRs using 2D and 3D imaging were 54% and 62%, respectively, whereas it was 82% between the three radiology technologists using S. These preliminary data show that computed determination of FVs is both accurate and sensitive.
Introduction
Transarterial chemoembolization (TACE) is a palliative treatment for patients with hepatocellular carcinoma (HCC) who are not candidates for transplantation, surgical resection, or radiofrequency ablation [1]. TACE is also used for the treatment of select hypervascular liver metastases, such as those of neuroendocrine origin [2]. This minimally invasive procedure allows delivery of a high concentration of particles and/or chemotherapeutic agents into the liver, causing ischemic cell death and permitting local delivery of high concentrations of chemotherapeutic drug. Selective administration of chemoembolic material to the tumor is desired, where possible, to increase the effectiveness of treatment to the tumor and minimize injury to surrounding liver tissue [3].
Visualization of the liver arterial tree during TACE has until recently been guided by two-dimensional (2D) angiogram. Two-dimensional projections depict hepatic arteries superimposed on one another, leading to the potential for misinterpretation of which arteries (i.e., feeding vessels [FVs]) supply the tumor. Consequently, there is a potential for incorrect or suboptimal catheter position for treatment. This limitation has traditionally been overcome by acquisition of multiple selective injections and oblique projections for precise analysis of the anatomy of the liver arterial tree to determine FVs. This approach, although time tested and valid, increases procedural time, administered contrast volumes, and radiation doses.
A relatively new approach is to use three-dimensional (3D) cone-beam computed tomography angiography (CTA), a technique that permits assessment of complex vascular anatomy after a single injection of contrast medium in a main hepatic artery. Recently, several studies have shown that the use of 3D CTA can be extremely helpful during TACE, especially in cases of complex hepatic arterial anatomy [4–6]. However, the time requirements for processing and evaluating 3D CTA models may discourage its routine use by interventional radiologists (IRs), who are accustomed to performing hepatic arterial interventions on the basis of conventional angiographic projections. In addition, evaluation of 3D CTA models requires either a sterile remote control for in-room review or the IR’s exit from the angiographic room to access a workstation. We developed a software program (S), designed to automatically determine FVs from 3D CTA images. The purpose of this study was to evaluate IR analysis of 3D data using S for determination of FVs, in terms of sensitivity, interoperator concordance, and duration, compared with analysis using 2D and 3D images.
Materials and Methods
Patients
From January 2008 to October 2008, 18 consecutive patients (12 men and 6 women; mean age 65 years [range 40–75]) were referred for 1 session of subsegmental TACE after evaluation by the multidisciplinary team at our hospital. Twelve patients had HCC, and 6 patients had liver metastases from neuroendocrine tumors. These 18 patients had 25 total unresectable liver tumors (1–3 tumors/patient), including 15 HCCs and 10 metastases from neuroendocrine tumors, measuring 21–96 mm (mean 44).
Angiogram Acquisition
TACE was performed with the patient under local anesthesia and conscious sedation using commercially available flat-panel detectors (Innova 4100; GE Healthcare, Chalfont St Gilles, UK). A 5F vascular sheath was inserted into the right femoral artery, and a 5F Cobra catheter (Cook; Bjaeverskov, Denmark) and a 0.035 hydrophilic guidewire (Terumo, Tokyo, Japan) were used to cannulate the common hepatic artery. All patients had a single hepatic artery feeding the liver, and no patient had a replaced hepatic artery. The 2D and 3D images were acquired during injection of contrast media (Visipaque 320mgI/ml; GE Healthcare) through the 5F catheter in the common hepatic artery after elevating the patient’s arms above the head and asking him or her to breath-hold. For the 2D images, 15 ml contrast media was injected at a flow rate of 3 ml/s, and the frame rate was 2 images/s (Fig. 1). For the 3D cone-beam CTA images, 24 ml contrast media was injected at a flow rate of 3 ml/s, and the injection started 3 s before start of the C-arm rotation and continued during the 5 s of the rotation. The C-arm rotated 200° around the patient at a rate of 40°/s for 5 s. A series of 148 images was acquired at a rate of 30 frames/s. The reconstructed 3D field of view was 23 × 23 × 23 cm, and the matrix size was 512 × 512 × 512 (Fig. 2). The time of automatic reconstruction of the 3D images, starting from the end of the rotational acquisition, was 50 s. A 2.4F or 2.7F microcatheter (Progreat; Terumo, Tokyo, Japan) was used to perform additional selective angiograms and subsegmental TACE. Additional selective angiograms at various angles were performed at the discretion of the operators according to the treatment needs of the patient (Figs. 3, 4).

Two-dimensional image of a large endocrine metastatic liver tumor, obtained after injection in the common hepatic artery, shows a large tumor blush in the right lobe of the liver

Three-dimensional image of the same tumor obtained after injection in the common hepatic artery

Selective 2D angiogram of the same tumor with a microcatheter

Selective 2D angiogram of the same tumor with a microcatheter
Software Analysis Methodology
Institutional Review Board approval was obtained for an IR or X-ray technician (XRT) to retrospectively review cone-beam CTA data and imaging files to determine the ability of 2D, 3D, and S analysis to determine subsegmental FVs of liver tumors.
Software
S was used on a workstation (ADW4.4; GE Healthcare, Chalfont St Gilles, UK) to analyze 3D imaging data (Fig. 5). For each tumor, determination of FVs was based on three consecutive steps, structure extraction, target definition, and FV selection, as follows:

Display of S on the workstation. The left upper quadrant shows the volume-rendering reconstruction of the 3D image. The different steps for FV extraction are visualized in the right upper quadrant (corresponding to Figs. 6, 9, 10, and 11). The MPR in the axial and coronal views used for determination of the tumor location (corresponding to Figs. 7 and 8) are shown in the left lower quadrant and right lower quadrant, respectively
-
Structure Extraction: A seed point is manually defined by the XRT at the entrance of the hepatic artery on any image from the multiplanar reconstruction (MPR). S performs a simple histogram analysis to determine voxel intensities typical of soft tissue and injected vessels. Because injected vessels and bones intensities overlap, seed points are automatically determined by thresholding high-intensity voxels within a neighborhood of the spine. Concurrent intensity-based segmentation is also performed. Based on connectivity to the seeds, two masks are obtained that divide the hepatic arterial tree and the bony structures (spine and ribs). These masks are displayed using volume rendering (Fig. 6). As a result, it is easier to read the image when nonrelevant structures are cleaned out.
Fig. 6 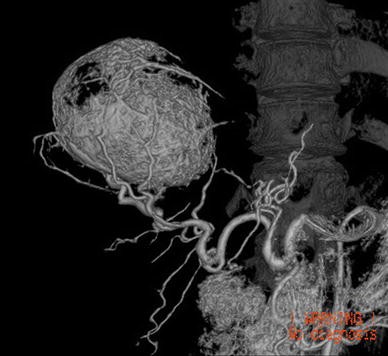
Two masks are obtained that divide the hepatic arterial tree from the bony structures
-
Target Definition: The user adjusts a spherical region of interest (ROI) around the targeted tumor. This adjustment can be performed on any MPR image (Figs. 7, 8).
Fig. 7 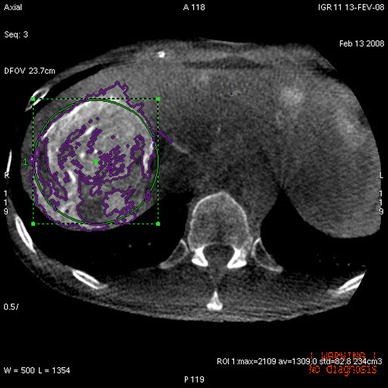
Determination of tumor location using ROI the same diameter as the tumor in the axial plane of the MPR
Fig. 8 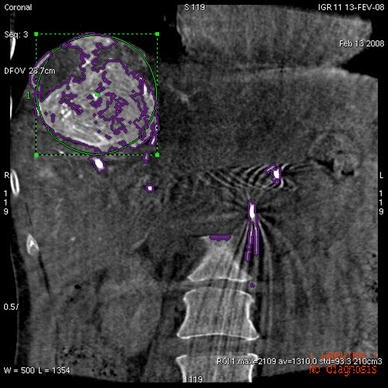
Determination of tumor location using ROI the same diameter of the tumor in the coronal plane of the MPR
-
FV Selection: S automatically considers all vessels in the vicinity of the target as being FVs. Vicinity is automatically determined by geometric considerations. S highlights all vessels (from the seed point to the tumor) that appear to feed the tumor by coming into close geometric proximity with the ROI (Fig. 9). FVs define a third mask, which is vividly displayed on top of the previously determined volume rendering of the vascular and bony masks. Because bones have been distinguished from vessels, they are displayed in a dimmer way and can be hidden altogether if they are not useful for determining the anatomic context (Figs. 10, 11).
Fig. 9 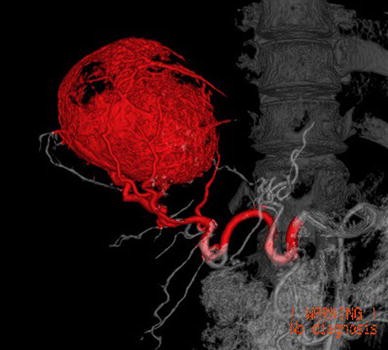
FV highlighted in red by S
Fig. 10 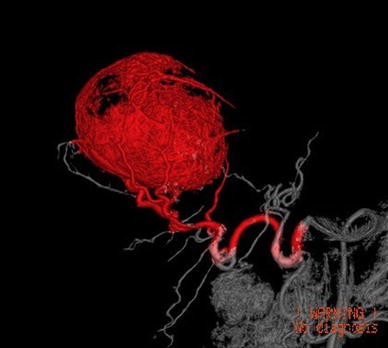
Bones can be hidden for better understanding
Fig. 11 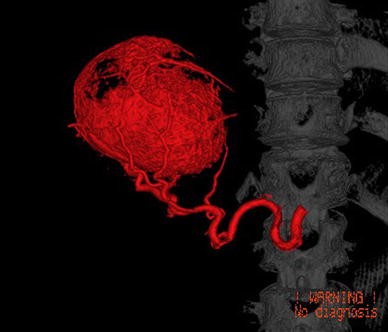
For better understanding, vessels that do not feed the tumor can be hidden


To better understand the anatomic relation of the hepatic branches, the display with highlighted FVs can be examined as a 3D volume. It is possible to repeat the second and third steps to determine FVs for several tumors in the same 3D acquisition.
Three X-ray technicians (XRT-1, XRT-2, and XRT-3), with 8, 1, and 2 years of experience in vascular radiology, respectively, were independently asked to define the number and location of FVs for all tumors using S. They were blind to any other imaging, including 2D and pre-TACE imaging work-up. Consensus on each FV between the three XRTs was defined as agreement of at least two XR-Ts regarding the FV.
2D and 3D Analysis
Three IRs (IR-1, IR-2, and IR-3), with 16, 5, and 5 years of experience in vascular radiology, respectively (external to the present cases), were independently asked to find the number and location of subsegmental FVs for all tumors by retrospectively reviewing first the 2D images only and then the 3D images on a workstation. The IRs were blind to additional angiograms (selective injections, oblique projections) performed during TACE. They had free access to patient medical files, including pre-TACE CTA or magnetic resonance imaging), which were available for all patients within the month before TACE was performed. Consensus on each FV between the three IRs was defined as agreement of at least two IRs regarding the FV.
Ground Truth and Statistical Analysis
The “ground truth” (GT) was defined, after the above-mentioned analyses by the XRTs and IRs were complete, by consensus among the IRs, who were then allowed to use global 2D and 3D images, as well S, in addition to all additional angiograms acquired during TACE (Fig. 12) and posttreatment follow-up (when available). GT was used to define true-positive, false-positive, and false-negative FVs. True-positive FVs for 2D, 3D, and S were subsegmental liver vessels identified as tumor feeders on global 2D, global 3D, or S analysis, respectively, that actually supplied the target tumor. False-positive FVs were vessels identified as tumor feeders on global 2D, global 3D, or S analysis that did not actually feed the tumor. False-negative FVs were vessels not identified as tumor feeders on global 2D, global 3D, or S analysis that actually did supply the target tumor.

GT was defined by consensus among the three IRs. FVs are highlighted in red on a paper copy of the 2D angiogram
Sensitivity was calculated as the consensus of the true-positive FVs on 2D, 3D, and S analysis divided by the actual number of FVs on GT analysis. Sensitivities of 2D, 3D, and S analysis were compared using McNemar’s test for matched proportions extended to clustered data to account for within-patient correlation [7].
Specificity could not be ascertained because true-negative FVs (vessels that neither supplied the tumor nor were identified as FVs) were too numerous and could not be precisely counted.
Interoperator concordances were assessed for 2D, 3D, and S analyses. Interoperator concordances for 2D and for 3D analyses were the percentage of subsegmental FVs found by the IRs by analyzing global 2D and global 3D images. Interoperator concordance for S data was the percentage of subsegmental FVs found by the XRTs using S.
Mean durations of analyses of 2D and 3D images by the IRs and mean duration of analyses using S by the XRTs were compared using paired Student t test. All reported P-values are two sided. Analyses were performed using SAS statistical software (SAS, Cary, NC). The significance level was 0.05 and was two sided.
Results
According to GT, the number of subsegmental FVs per tumor varied from 1 to 6 (mean 3.3), and the total number of subsegmental FVs for all 25 tumors was 83.
The numbers of subsegmental FVs, the percentage of true-positive subsegmental FVs, and the percentage of false-positive subsegmental FVs found by each IR analyzing 2D and 3D images and for each XRT are reported in Table 1. Sensitivities and mean time required for 2D, 3D, and S analysis are reported in Tables 2 and 3, respectively.
Sensitivity was significantly higher when the IRs used the 3D angiogram compared with the conventional 2D angiogram (73% vs. 64%, P = 0.036). Sensitivities of S as used by XRTs were 90%, 93%, and 93%, respectively (mean 93%), all of which were significantly higher than analysis using 2D (P = 0.002) and 3D (P = 0.0056) images by the IRs. Concordances for the IRs were 54% using 2D and 62.5% using 3D images. Concordance for the XRTs using S was 82.5%.
Mean duration of analyzing 3D images by IRs was significantly higher than analyzing 2D (187 vs. 94 s, P < 0.0001) images. Durations using S by the XRTs were 138, 140, and 127 s (mean 135), respectively, which was significantly less time than required for analysis of 3D images (P < 0.0001) but significantly more time than required for analysis of 2D images (P < 0.0001).
Discussion
The benefit of using 3D imaging during TACE has already been demonstrated by several studies. First, Liapi et al. [4] reported the usefulness of 3D during TACE in 2 patients with HCC carcinoma having complex vascular anatomy. They argued that in such cases, 3D imaging (1) decreased contrast medium dose as well as radiation exposure for patients and physicians by decreasing multiple 2D images and (2) allowed treatment of hepatic tumors with complex vascular anatomy that otherwise would have been difficult to treat. Kakeda et al. [5] demonstrated that 3D imaging provided clinically acceptable image quality in the assessment of 52 HCCs and that in 81% of the cases it provided additional information for treatment compared with 2D imaging. Similarly, Miyayama et al. demonstrated that 3D imaging was useful in detecting and treating small HCC lesions that could not be demonstrated on angiography [6]. Virmani et al. [7] showed that the results of 3D imaging altered the choice of catheter position for delivering TACE, as anticipated by an attending IR, in 39% of cases and improved the diagnostic confidence in selected catheter positioning in 78% of cases.
Our study demonstrates that 3D imaging improves the sensitivity for detecting FVs compared with 2D imaging (73% vs. 64%, P = 0.036). Similarly, Iwazawa et al. reported that the sensitivity of 3D to determine FVs was significantly higher than that of 2D imaging (96.9% vs. 77.2%, P < 0.01) [8]. In our study, it is noteworthy that this superiority was found by the three IRs who reviewed the cases, but the difference was significant only for the two IRs who had more brief career experience (Table 1). A valid explanation for this difference in sensitivity when IRs reviewed 2D imaging could be that 2D analysis needs much more expertise in interventional radiology than does 3D analysis. The gain in sensitivity from 2D to 3D analysis is accompanied by an increased amount of time required to review the 3D data. Indeed, since its emergence in vascular radiology, 3D imaging has been limited by the time required to incorporate it into the fast pace of interventional procedures. Thus, despite a gain in sensitivity, it has been challenging to use routinely. Ideally, analysis of the 3D data set could be performed by a third person, sparing the operating IR and patient from procedural interruption. For this reason we asked the XRT, not the operating IR, to analyze the S results.
Our study demonstrates that software dedicated to subsegmental FV analysis can be useful for the IR when subsegmental TACE is considered. Using S improves sensitivity and decreases the time to detect subsegmental FVs compared with review of 3D imaging. Thus, S can depict subsegmental FVs that the IR may not have perceived by conventional angiography and increases confidence in detecting suspicious subsegmental FVs. We hypothesize that such software will decrease the need for additional oblique and selective angiograms, thus decreasing the volume of contrast media and radiation exposure of both the patient and the IR. However, these factors were not evaluated in this study.
The time for using S seems compatible with real-time use during TACE. Although use of S requires more time than 2D image evaluation, it is more time efficient than standard review of the 3D data set. Because S can be run by XRTs, procedural time loss is limited. Thus, the IR can continue working while the XRT uses S. Moreover, it is noteworthy that compared with poor concordance of physician determination of FVs using 2D and 3D imaging, the concordance between the XRTs who used S was high. In addition, we observed no difference among XRTs of differing levels of experience regarding overall sensitivity or time required to use S.
It should be emphasized that 2D and 3D analysis by nonoperating IRs described in this study represents a less stressful condition than when the same analysis would occur during a procedure. It is possible, therefore, that the intraprocedural benefits of S could be even more substantial than we have demonstrated.
No “gold standard” was available by which to assess the accuracy of GT. GT only represented agreement among three IRs using all available data. Because this was a retrospective study, FVs, as identified by GT, could not be tested by selective angiography to test for true tumor supply.
Only visible vessels were taken into account. Thus, noninjected vessels, such as collateral or parasitic arterial supply from extrahepatic sources (e.g., the phrenic artery) or tiny vessels, were naturally ignored by S even if they fed the tumor.
S determined subsegmental FVs by a simple mathematical model: All regions of the parenchyma are perfused by the vessel closest to them. Although using spatial proximity as a surrogate for vascular connectivity in the liver has been empirically validated [9], the possibility of attributing a given parenchymal region (i.e., a voxel) to a nonfeeding arterial branch exists. This could be solved through functional imaging, e.g., by use of perfusion data. However, this type of imaging is not typically used when planning or performing TACE, whereas the entire anatomy (i.e., geometry) of the vascular tree can be extracted from global angiograms. This explains why we used geometric distance to approximately determine the perfusion relation between a part of the vascular tree and a part of the hepatic parenchyma.
Conclusion
Computed analysis software of 3D cone-beam CTA data has a higher sensitivity in determining subsegmental FVs than experienced IRs using 2D imaging alone. This analysis can be performed by an XRT, and processing time appears compatible with real-time use during TACE. Prospective evaluation of S in clinical practice is needed to augment these findings.
References
Brown DB, Geschwind JF, Soulen MC et al (2006) Society of interventional radiology position statement on chemoembolization of hepatic malignancies. J Vasc Interv Radiol 17:217–230
Steward MJ, Warbey VS, Malhotra A, Caplin ME, Buscombe JR, Yu D (2008) Neuroendocrine tumors: role of interventional radiology in therapy. Radiographics 28:1131–1145
Marelli L, Stigliano R, Triantos C, Senzolo M, Cholongitas E, Davies N et al (2007) Transarterial therapy for hepatocellular carcinoma: which technique is more effective? A systematic review of cohort and randomized studies. Cardiovasc Intervent Radiol 30:6–25
Liapi E, Hong K, Georgiades CS, Geschwind JF (2005) Three-dimensional rotational angiography: introduction of an adjunctive tool for successful transarterial chemoembolization. J Vasc Interv Radiol 16:1241–1245
Kakeda S, Korogi Y, Ohnari N, Moriya J, Oda N, Nishino K et al (2007) Usefulness of cone-beam volume CT with flat panel detectors in conjunction with catheter angiography for transcatheter arterial embolization. J Vasc Interv Radiol 18:1508–1516
Miyayama S, Yamashiro M, Okuda M, Yoshie Y, Sugimori N, Igarashi S et al (2009) Usefulness of cone-beam computed tomography during ultraselective transcatheter arterial chemoembolization for small hepatocellular carcinomas that cannot be demonstrated on angiography. Cardiovasc Intervent Radiol 32:255–264
Virmani S, Ryu RK, Sato KT, Lewandowski RJ, Kulik L, Mulcahy MF et al (2007) Effect of C-arm angiographic CT on transcatheter arterial chemoembolization of liver tumors. J Vasc Interv Radiol 18:1305–1309
Iwazawa J, Ohue S, Mitani T, Abe H, Hashimoto N, Hamuro M et al (2009) Identifying feeding arteries during TACE of hepatic tumors: Comparison of C-arm CT and digital subtraction angiography. AJR Am J Roentgenol 192:1057–1063
Selle D, Preim B, Schenk A, Peitgen H-O (2002) Analysis of vasculature for liver surgical planning. IEEE Trans Med Imaging 21:1344–1357
Open Access
This article is distributed under the terms of the Creative Commons Attribution Noncommercial License which permits any noncommercial use, distribution, and reproduction in any medium, provided the original author(s) and source are credited.
Author information
Authors and Affiliations
Corresponding author
Rights and permissions
Open Access This is an open access article distributed under the terms of the Creative Commons Attribution Noncommercial License (https://creativecommons.org/licenses/by-nc/2.0), which permits any noncommercial use, distribution, and reproduction in any medium, provided the original author(s) and source are credited.
About this article
Cite this article
Deschamps, F., Solomon, S.B., Thornton, R.H. et al. Computed Analysis of Three-Dimensional Cone-Beam Computed Tomography Angiography for Determination of Tumor-Feeding Vessels During Chemoembolization of Liver Tumor: A Pilot Study. Cardiovasc Intervent Radiol 33, 1235–1242 (2010). https://doi.org/10.1007/s00270-010-9846-6
Received:
Accepted:
Published:
Issue Date:
DOI: https://doi.org/10.1007/s00270-010-9846-6