
Abstract
Edge computing aims at reducing computation and storage across the cloud and provides service with reduced latency. Edge devices can be mobile devices, routers, cameras, printers or any Internet of Things (IoT) devices that generate vast amounts of data. The processing of these data is done by virtual machines (VMs) present in the edge servers that are located within close proximity of the edge devices. This work proposes two models which predict resource contention at the edge servers, namely, a Dynamic Markov model for Resource Contention Prediction in Edge Cloud (DMRCP) and a Hybrid Cascade of Regression and Markov model for Resource Contention Prediction (CRMRCP). In DMRCP, a history matrix is updated based on the CPU utilization of a Virtual Machine (VM). This history matrix is used to update a transition probability matrix. This matrix is used to predict the future state of the VM. In the CRMRCP approach, the past CPU utilization values of the virtual machines in the edge servers are used for predicting a set of future CPU utilization values using linear regression, polynomial regression, lasso regression and ridge regression. Then, the predicted future CPU utilization values are used by the dynamic and the second-order Markov models to classify the state of the edge servers as overloaded, underloaded or normally loaded. In both the approaches, the VMs that may cause resource contention are predicted and are migrated to other edge servers such that the destination edge server does not get overloaded after the migration. The DMRCP method is compared with the first-order and the second-order Markov models and the number of VM migrations is analysed to evaluate the performance. The number of VM migrations in the CRMRCP method is compared with that in the second-order Markov model. The overall results prove that the number of VM migrations for the DMRCP is 52.9% less compared to the first-order Markov model and 21.1% less when compared to the second-order Markov model. The number of VM migrations in CRMRCP is reduced by 81.8% when ridge regression cascaded with the second-order Markov model is used.
1 Introduction
In Edge computing, much of the data processing takes place at the edge of the network [6, 31, 36] thus, moving the computation away from the remote cloud datacenters. Some of the edge devices are mobile devices, printers, sensors, desktops, tablets and IoT devices that can be used for different purposes. These devices generate huge amounts of data. Edge servers are located close to the edge devices and perform the computation, and only needed data is offloaded to the cloud. This results in a reduction in latency [27]. The resources needed to execute tasks in the edge servers can be physical resources like storage devices, CPU or any network device, or virtual resources like virtual machines (VM).
IoT workloads often undergo resource requirement changes, due to the occurrence of some events at the edge server which require additional resources to perform the desired computation. The edge servers have limited hardware resources compared to cloud servers making resource contention a more prominent issue of concern. Therefore, each edge server can accommodate only a limited number of VMs, which makes the allocation of VMs in an edge computing environment a challenging approach.
Since the edge architecture has a limited amount of resources, VMs from the overloaded edge servers can be migrated to other underloaded edge servers instead of allocating new resources.
The migration of VMs between the adjacent edge servers must be minimal to maintain efficient computation and processing in the edge servers [32]. The edge computing environment is dynamic as most of the edge devices are mobile, thereby increasing the request for shared resources in the edge servers. These shared resources can be accessed without any conflict only by avoiding resource contention.
Early prediction of CPU utilization time needed by each virtual machine to perform the tasks, assists in early migration of the VMs that may contend in the future. Therefore, prediction of resource contention and allocation of VMs as per need lead to the execution of the tasks by maintaining the desired Quality of Service (QoS). Resource contention prediction also plays an important role in maintaining the performance of an application as stated in the Service Level Agreement (SLA).
In this work, we use an edge cloud architecture in which the execution of tasks is decentralized across the edge servers and offloading to the cloud is done only if needed. The edge cloud is extremely beneficial in online gaming platforms and vehicular applications used by drivers on a moving car since huge amounts of data are generated by these applications. Data processing in the edge cloud architecture is quick, as many edge servers actively process the data in a decentralised fashion.
Hybrid models overcome the limitations of single models and improve the performance. Some models are good in predicting the needed resources for a smaller number of users who have static requirements for a fixed time but may not be capable of predicting resources when the number of users increases suddenly for a particular time. Some other models may predict resources accurately for a moderate amount of users with dynamic requirements. These conditions create a premise to complement the characteristics of different models and use one to overcome the weaknesses of the others.
The first approach in this paper proposes a Dynamic Markov model for Resource Contention Prediction in Edge Cloud (DMRCP). The VMs that cause resource contention at a particular edge server are migrated to other edge servers. The VMs are killed if the resource contention cannot be mitigated after performing migrations. VMs are entirely isolated and can have a different operating system from the host operating system, whereas containers are light weighted and use the host operating system. Since containers can also be included on a VM, we have considered VM migration as it includes containerisation as well.
A history matrix is updated based on the CPU utilization of a VM in the DMRCP approach. This history matrix is used to update a transition probability matrix. This matrix is used to predict the future state of the VM. The future states of the VMs are used to calculate the future state of the edge server in which the VMs reside. A zone state manager is maintained in the micro-datacenter that keeps track of the states of all the edge servers. A contention manager obtains the information from the zone state manager which gives the list of underloaded edge servers available for receiving the migrated VMs. The contention manager migrates the VMs that will cause overloading to other edge servers that are underloaded.
The second approach is the Hybrid Cascade of Regression and Markov model for Resource Contention Prediction (CRMRCP). The past CPU utilization values of the virtual machines in the edge servers are used for predicting a set of future CPU utilization values using linear regression, polynomial regression, lasso regression, ridge regression and Support Vector Regression (SVR). The predicted future CPU utilization values are used by the second-order Markov model to classify the state of the edge servers as overloaded, underloaded or normally loaded. The VMs which are down are not considered as they are in a suspended state which has no accountability in predicting the contention due to overloading. The virtual machines (VMs) in the edge servers that cause overloading are migrated to other edge servers within the same edge network. Thus, resource contention is mitigated even before it occurs, as the virtual machines are migrated immediately after prediction. We have performed our experiments in EdgeCloudSim, a simulator that simulates edge computing architectures.
The work in this research paper addresses the following:
-
Prediction of future CPU utilization of VMs using dynamic Markov model, cascade of regression and second-order Markov model, and then categorising the VMs as overloaded, underloaded, and normally loaded.
-
Migration of VMs to normally loaded or underloaded edge servers, thereby mitigating CPU resource contention before it occurs.
-
Compare the number of VM migrations for the proposed solutions namely DMRCP and CRMRCP.
The rest of the paper proceeds as follows. Section 2 gives the related work in this area, Sect. 3 describes the system architecture, Sects. 4 and 5 explain the proposed models, Sect. 6 gives the algorithm for prediction of future state of edge servers, Sect. 7.1 gives the experimental setup, Sect. 7.2 discusses the results and Sect. 8 concludes the work done.
2 Related Work
This section discusses some of the challenges in edge computing and the techniques that exist for the allocation of resources across the edge. Some of the existing methods for resource prediction are also addressed in this section. There are many challenges in the deployment of edge devices as the number of IoT networks increases rapidly. The number of edge servers to be deployed with storage and computation functionality is decided by considering the traffic and wireless diversity [38]. The major challenges in edge computing are management of resources, identifying the origination of data, and deciding when to offload to the cloud [5]. Constrained computation capacity and storage, use of battery power and mobility of devices resulted in various challenges like battery life preservation, offloading considerations, bandwidth allocation and energy management [27].
2.1 Computational Offloading Methods in Edge
Researchers have proposed techniques for computational offloading in edge computing using game theory [26]. A game-theoretic approach for computation offloading strategy for non-cooperative users in mobile edge computing has been proposed by You et al. [35]. Reinforcement learning has been used for offloading the computation data of the users whose priorities (based on the user’s channel gains and local computing energy consumption) exceeded a given threshold [35]. A delay-aware task graph partition technique [8] and optimal virtual machine selection method has been proposed for offloading the tasks in IoT devices by maintaining the desired QoS. A game-theoretical model [15] has been proposed for offloading of data in a mobile edge computing environment, where the operator managed both wireless and computation resources.
The resource allocation and computation offloading problem has been considered as an optimization problem to maximize system utility [12]. Gaming models [14, 26] have also been used for resource management in the edge. The work proposed in [10] explained an offloading strategy by considering multiple parameters like radio resources, computational complexity along with data security using Advanced Encryption Standard (AES) algorithm. Optimization of offloading time using Markov Decision Process in Mobile-Edge Computing was proposed by [34] and [2].
2.2 Resource Allocation in Edge Using Machine Learning Algorithms
The revival of Artificial Intelligence (AI) has led to learning at the edge by taking into account data importance in resource allocation [39]. AI techniques such as reinforcement learning [17], deep reinforcement learning, clustering [18] and federated learning have also been used to optimize the resource allocation process [25, 33].
2.3 Energy-Based Resource Allocation
A survey of energy-aware edge computing, including the existing work on computation offloading frameworks and the strategies in edge computing has been discussed [13]. Successive Convex Approximation Algorithm (SCA) has been proposed for energy efficient resource allocation, which minimized power consumption by offloading across all users considering latency and power constraints [1]. An energy-efficient algorithm has been proposed for the reduction in operation costs by optimal use of energy in edge devices [3]. An energy-efficient computation offloading scheme through type classification and priority assignment for mobile devices has also been proposed [37].
2.4 Resource Prediction Techniques in Edge Computing
Dimitrios et al. proposed techniques for deployment, orchestration and management of location based services in the edge [29]. VM allocation in mobile edge computing was done based on the mobility of users, computation resources and communication resources [24].
The works done earlier have not focussed on resource contention prediction in the edge computing architecture. In our work, we propose a dynamic Markov model based algorithm to predict the future CPU utilization of VMs, and the VMs predicted to cause resource contention, are migrated thereby avoiding resource contention.
2.5 Regression Models used for Resource Prediction
Linear regression has been used for prediction of future CPU utilization [11, 19]. The lasso and ridge regression [28] have been used for multi-dimensional resource allocation for an auction-based application in a cloud computing environment. It has been found that the Root Mean Squared Error (RMSE) of the lasso and ridge regression was less when compared to linear regression. The CPU and storage were better utilized when lasso and ridge regression were used in resource allocation [28].
Some works have classified the hosts as overloaded and underloaded based on linear regression [11], multiple linear regression [9] and hybrid method based on ensemble empirical mode decomposition and AutoRegressive Integrated Moving Average (ARIMA) [7]. VM migration was performed from overloaded hosts to underloaded hosts [7, 9, 11]. Linear regression-based CPU Utilization Prediction (LiRCUP) has reduced SLA violation, as well as power consumption [11].
3 System Architecture and Problem Formulation
A set of edge devices \(D=\{d_1, d_2, \dots ,d_n\}\) is deployed within the same local network. An edge device \(d_i\), where \(i \in 1, \dots , n\) can be mobile or any IoT device within the same local network as shown in Fig. 1. The local network is grouped into different zones \(Z=\{z_1, z_2, \dots ,z_m\}\) and each zone has many edge servers \(E=\{e_1, e_2, \dots ,e_l\}\) for performing computations. The computations to be performed on the data sent by the edge devices within that particular zone are done by the corresponding edge servers. A set of tasks \(T=\{t_1, t_2, \dots \}\) is assigned to a VM in an edge server. When an edge server has a lot of computations to be done, some of the VMs from the overloaded edge server are migrated to other edge servers, thereby, resulting in an equal share of load and prevention of contention of resources. The cost of migration (\(Cost_{{VM}migration}\)) of \(VM_i\) from an overloaded edge server (\(e_o\)) to an underloaded edge server (\(e_u\)) includes load due to that VM along with the start up configurations for enabling service at the destination edge server. In order to minimise the VM migration cost, the number of VM migrations must be kept as minimal as possible. Hence, the goal of the two models proposed in this paper is to minimise the number of VM migrations across the edge servers.

Resource Contention Prediction in Edge Cloud
The functions of each component of the proposed system architecture are explained below:
-
Edge device: edge devices can be mobile devices, IoT devices, switches, routers, or any devices connected to the network.
-
Edge server: the edge server performs the computations on the data that are received from the edge devices of the corresponding zone.
-
Virtual machine: the virtual machines are responsible for the computation of tasks on the edge servers. The allocation of the required number of VMs to each task reduces the latency of the application, thereby improving the performance of the application.
-
Contention manager: each edge server has a contention manager. It constructs a transition probability matrix for each VM using a history matrix which is updated dynamically based on the CPU utilization of the VM. It migrates the VMs from the overloaded edge servers to other edge servers within the same zone based on the predicted future states of the edge servers.
-
Micro-datacenter: every zone has a micro-datacenter assigned to it. It has a zone state manager that contains the states of all the edge servers within that particular zone. It is also responsible for offloading the necessary data that needs to be stored to the cloud.
-
Cloud storage: required data from the micro-datacenters are sent to the cloud storage at frequent intervals for future retrieval.
4 DMRCP
Each edge server can be in one of the three states, namely, overloaded, underloaded or normally loaded. This state of the edge server depends on the states of all the VMs in that edge server. Each VM can also be in one of these three states, overloaded (O), underloaded (U), or normally loaded (N). When the CPU utilization of a VM is 80% (upper threshold) or above, it is labeled as overloaded, and when the CPU utilization is 20% (lower threshold) or less it is considered as underloaded. These threshold values are set based on the work done by Beloglazov et al. [4]. The VMs whose CPU utilization values lie in between the upper and the lower thresholds are categorized as normally loaded.
The future states of the VMs and thereby, the future states of the edge servers are predicted using a dynamic Markov model (DMRCP). The VMs of the edge servers, that are predicted to become overloaded, are migrated to other edge servers, thereby mitigating the resource contention caused by overloaded VMs. The construction and updation of the history matrix and the transition probability matrix are explained in sections 4.1 and 4.2 respectively.
4.1 Construction of History Matrix
For each VM in an edge server, the contention manager in the edge server maintains a history matrix of size \(n \times n\), where n is the number of states in which each VM can be.
The history of movements of a VM across the three states is recorded in the history matrix H. An example of the history matrix is given in matrix 1. The first entry in the first row of the history matrix gives the number of times the VM has remained in the normally loaded state. The second entry represents the number of times the VM has moved to the overloaded state from the normally loaded state.

Similarly, the third entry in the first row gives the number of times the VM has moved to the underloaded state from the normally loaded state. The second and the third rows depict the number of VM movements from the overloaded and the underloaded states, respectively. This history matrix gets updated dynamically based on the change in state of the VM.
4.2 Construction of Transition Probability Matrix Using Dynamic Markov Model
The probability of the movement between the three states of a VM namely, overloaded, normally loaded and underloaded is kept in a transition probability matrix. The structure of the transition probability matrix is shown in matrix 2. The first row in the matrix 2 gives the probability that the VM remains in normally loaded state (\(P_{NN}\)), the probability that it transits to the overloaded state (\(P_{NO}\)), and the probability that it moves to the underloaded state (\(P_{NU}\)), from the normally loaded state. Similarly, the probabilities of transitions from the overloaded state to other states are given in the second row of the matrix 2. The third row of the matrix 2 contains the probabilities of transitions from the underloaded state of the VM to other states.
An initial probability matrix \(P_{ini}\) is constructed by the contention manager with the view that, initially, all the transitions are equiprobable. Thus, the initial matrix 3 is constructed with values 1/3.
The entry in the initial probability matrix \(P_{ini}\) is then updated using the history matrix as shown in Eq. 4, and this forms the transition probability matrix.
\(H_{ij}\) is the count corresponding to the ith row and the jth column in the history matrix H, l is the number of columns in the history matrix (here, 3). The probability values in the transition probability matrix depict the probability of the VM moving to a different state or remaining in the same state based on the history of the transitions of the VM. Thus, the probability that a VM will continue to be overloaded (\(P_{OO}\)) is calculated as shown in Eq. 5.
Matrix 6 shows the transition probability matrix constructed from the example history matrix shown in matrix 1.
This is considered as a dynamic Markov model as the transition probability matrix is updated constantly for each transition based on the history matrix. This transition probability matrix is used by the contention manager to migrate VMs from overloaded edge servers to underloaded edge servers as described in Sect. 6.
5 CRMRCP
In the hybrid cascade of regression and Markov model (CRMRCP), the future CPU utilization of edge servers is predicted as shown in figure 2. The historical CPU utilization values are given as input to different methods of regression. We have used five different methods of regression as explained in Sect. 5.1 namely, linear, polynomial, lasso, ridge and support vector regression to predict a set of future CPU utilization values of VMs. The construction of transition probability matrix for CRMRCP is explained in Sect. 5.2.

CRMRCP model
Then, the predicted set of future CPU utilization values obtained for a regression model is used by the second-order Markov model to predict the future state of the VM as overloaded (O), underloaded (U) or normally loaded (N).
5.1 Regression Model
The prediction of future values using regression is one of the successful solutions for resource management in the edge cloud architecture. The following subsection gives an overview of the various regression methods used in this work.
5.1.1 Linear Regression (LR)
Linear regression [23] attempts to model the relationship between two variables by fitting a linear equation to the observed data. One variable is considered to be an independent variable, and the other is considered to be a dependent variable. A linear regression line has an equation of the form shown in Eq. 7.
where x is the independent variable, y is the dependent variable \(\beta\) is the regression coefficient and \(\varepsilon\) is the random error.
5.1.2 Polynomial Regression (PR)
Polynomial regression [23] is a form of regression analysis in which the relationship between the independent variable x and the dependent variable y is modelled as an nth degree polynomial of x as shown in Eq. 8
where \(x^1, x^2, \ldots x^n\) are the independent variables, y is the dependent variable, \(\beta _0, \beta _1, \beta _2, \ldots , \beta _n\) are the regression coefficients for a polynomial equation of order n.
5.1.3 Lasso Regression (LaR)
LASSO stands for Least Absolute Shrinkage and Selection Operator. Shrinkage is where data values are shrunk towards a central point, like the mean. The lasso procedure encourages simple, sparse models (i.e. models with fewer parameters) [21]. Lasso regression is modelled as shown in Eq. 9.
where \(\lambda\) is the amount of shrinkage, y is the dependent variable, x represents the independent variables, N is the number of instances, p is the number of features, B is the regression coefficient to be estimated. The first term in the Eq. 9 gives the squares of the residual sum and the second term is the sum of the absolute value of the magnitude of coefficients multiplied with \(\lambda\).
5.1.4 Ridge Regression (RR)
Ridge regression is a method for estimating the coefficients of multiple-regression models in scenarios where independent variables are highly correlated by creating a ridge regression estimator [20]. This provides a more precise ridge parameters estimate, as its variance and mean square estimator are often smaller than the least square estimators previously derived. Ridge regression is modelled as shown in Eq. 10.
where \(\lambda\) is the amount of shrinkage, y is the dependent variable, x represents the independent variables, N is the number of instances, p is the number of features, B is the regression coefficient to be estimated. In ridge regression, the cost function is altered by adding a penalty equivalent to square of the magnitude of the coefficients.
5.1.5 Support Vector Regression (SVR)
Support Vector Regression is a form of regression used to predict the discrete values. Hyperplanes are the decision boundaries for data to be predicted. The values on either side of the hyperplane called support vectors give the predicted output of SVR. The threshold value \(\epsilon\) is drawn around the hyperplane and the predicted values within the threshold gives the best fit in SVR.
The predicted values within the value of \(\varepsilon\) as given in Eq. 11 is alone taken for consideration which minimises the error rate in prediction.
5.2 Construction of Transition Probability Matrix Using Second-Order Markov Model
The future CPU utilization values of the VMs in the edge server that are predicted using the regression models are sent to the second-order Markov model. A transition probability matrix is constructed for each VM using the second-order Markov model by the contention manager which is used to predict the future state of edge server (Fig.3). In the second-order Markov model [30], the future state depends on two historical values. By using the two historical values at n and \({n-1}\), the probability of the CPU utilization of the VM in future, that is, at \({n+1}\) is found using the Eq. 12.
The general format of the first order transition probability matrix of a VM is as given in matrix 2. Since there are three states for the VM, a \(3 \times 3\) matrix is constructed.
Equation 13 gives the probability that a VM will continue to remain in the overloaded state (\(P_{OO}\)). Similarly, the other values are found. For the second-order Markov model, the probability of a VM being overloaded can be computed using Eq. 14
where k is U, O and N.

CRMRCP - Prediction and migration
The VMs predicted to be overloaded are migrated to other underloaded edge servers by the contention manager. The micro-datacenters contain the state of all the edge servers. The destination edge server is selected by the contention manager from the data available at the micro-datacenter. It is also checked that the destination edge server does not move to an overloaded state after receiving the migrated edge VMs. The VMs predicted to be overloaded by the contention manager are used in prediction of future state of edge servers as explained in the next section.
6 Prediction of Future State of Edge Servers
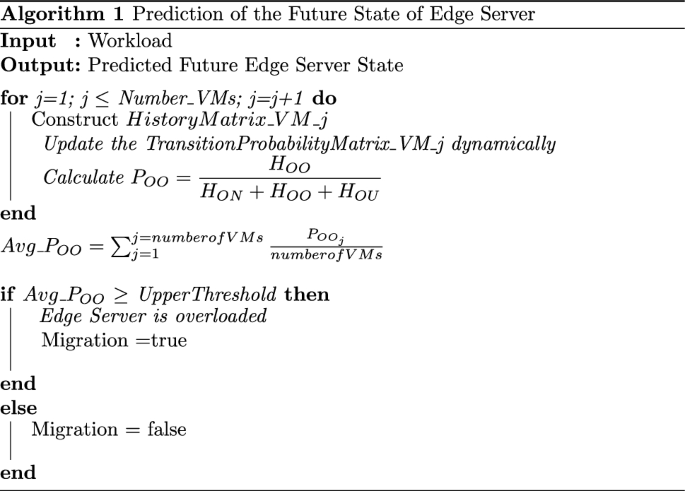
The transition probability matrix constructed for each VM as given in Sect. 4.2 and 5.2 is used to predict the future state of the VM, and thereby the future state of the edge server in which the vm is located as given in Algorithm 1. The contention manager present in the edge server calculates the average of the \(P_{OO}\) values of the transition probability matrices of all the VMs in the edge server. If the calculated average value exceeds an upper threshold, then the edge server is marked as overloaded by the contention manager. If the calculated average value is less than a lower threshold, then the edge server is marked as underloaded by the contention manager. Else, the edge server is marked as normally loaded.
The contention manager sends the predicted future state of the edge server periodically to the zone state manager in the micro-datacenter. Thus, the zone state manager has the future predicted states of all the edge servers for that particular zone.
If an edge server is found as overloaded, the contention manager receives the list of underloaded edge servers from the zone state manager for that particular zone of the network. The VM with the highest value of \(P_{OO}\) within the overloaded edge server is selected first to be migrated to another underloaded edge server by the contention manager. Then, the VM with the lowest value of \(P_{OO}\) in an underloaded edge server is also selected by the contention manager from the received underloaded edge server list.
Before migrating the overloaded VM, a check is done to verify if the migration would result in the overloading of the edge server to which the VM is migrated. The highest value of \(P_{OO}\) of all the VMs in the overloaded edge server is swapped with the lowest value of \(P_{OO}\) of all the VMs in the underloaded edge server. The average of \(P_{OO}\) values of all the VMs of the sending and the receiving edge servers are calculated separately. If the calculated average for the receiving edge server or the sending server is above an upper threshold, the contention manager selects the next underloaded edge server from the list and does the check again. If it is not possible to find any such underloaded edge server, then the overloaded VM of the sending edge server is killed since migration is not possible.
7 Experiments
7.1 Experimental Setup
The edge computing environment is simulated using EdgeCloudSim which is built on top of the CloudSim simulator. The number of edge devices can be dynamically increased and the location of the edge devices are randomly simulated.
The experiments are carried out for PlanetLab values [22] which are the CPU utilization values of VMs collected randomly across various datacenters. PlanetLab workload contains the CPU utilization data collected every five minutes from more than a thousand VMs from servers located at more than 500 places around the world. The workloads contain traces gathered during a random period of 10 days and these workloads are used throughout the simulations. For each day, different files containing CPU utilization values are available; each file corresponds to the host from which data is collected. The PlanetLab values can be used as datasets for edge architecture as well [16].
Random workloads generated by the simulator for specific periods of time are also used for the experiments. The random workload data are generated in the simulation as per the time limit set by the user. In this experiment we have generated random workloads at every minute for a period of 24 h.
Table 1 gives the details of the components used in the simulation. The number of edge devices considered in our simulation is 1000. Each edge server can handle 20 edge devices and a total of ten zones are used in our experiments.
Our proposed methodology is compared with the performance of the system when the first-order and the second-order Markov models are used for prediction [30].
The first-order Markov model uses one past CPU utilization value for the prediction, whereas the second-order Markov model depends on two values from the past. For the first and the second order, transition probability matrices are constructed for each VM within the edge servers and the appropriate \(P_{OO}\) values are calculated and are used to predict the overloaded VMs.
7.2 Results and Discussion
The results of our experiments using the configurations mentioned in Sect. 7.1 are discussed here. When the number of VM migrations increases in an edge cloud, the performance of the application is hindered.
7.3 Results for DMRCP
The Fig. 4 shows the average number of VM migrations on 10 days for the first-order Markov model, the second-order Markov model and the proposed dynamic Markov model, when PlanetLab workload is used. For the PlanetLab workload (Fig. 4), the number of VM migrations for the first-order Markov model is high for all the 10 days, whereas, the number of VM migrations for the second-order Markov model is 27.2% lower than the first-order Markov model, on an average. Table 2 gives the percentage decrease in the VM migrations for each day for dynamic Markov model using PlanetLab workload. It can be inferred from Table 2 that the dynamic Markov model gives an average decrease of 50.7% VM migrations when compared with first-order Markov model and 23.4% decreased VM migrations when compared with second-order Markov model for PlanetLab workload.

Edge cloud architecture for DMRCP - PlanetLab Workload
The number of VM migrations for the random workload (Fig. 5) also shows that the first order has the maximum number of migrations followed by the second order which is 36.3% less than the first order. Table 3 gives the percentage decrease in VM migrations for each day for dynamic Markov model using random workload. The random workload compared in Table 3 also shows that dynamic Markov model has 55.2% decreased VM migrations when compared to the first-order Markov model and 18.8% decreased VM migrations compared to the second-order Markov model.

Edge cloud architecture for DMRCP- random workload
The computational complexity for the construction of the history matrix is O(n) where n is the order of the history matrix. The computational complexity for the construction of the transition probability matrix using dynamic Markov model is O(n) where n is the number of states of the VM. A computation O(n) followed by another O(n) gives an overall computation complexity of O(2n). The computation complexity of the dynamic Markov model makes the algorithm lightweight and suitable for edge computing architectures.
7.4 Results for CRMRCP
In this section, the results obtained for our experiments are analyzed graphically as shown in Fig. 6. The percentage decrease in the number of VM migrations by using CRMRCP when compared to using only the SM are summarised in Table 4. The results show that the number of VM migrations when only the SM is used is always more, compared to the number of VM migrations when regression is also used. The cascade of linear regression and the second-order Markov model (LR+SM) shows a 62.9% decrease in the number of VM migrations on an average, when compared to SM. The cascade of polynomial regression and the second order Markov model (PR+SM) gives a decrease in the number of VM migrations by 67.1% on an average. The cascade of lasso regression and the second-order Markov model (LaR+SM) shows 75.2% decreased VM migrations, on an average when compared to SM. The cascade of Support Vector Regression and the second-order Markov model (SVR+SM) shows 68.3% decreased VM migrations, on an average when compared to SM. The cascade of ridge regression and the second-order Markov model (RR+SM) gives the least number of VM migrations compared to all other regression methods. It reduces the number of VM migrations to 81.8% on an average when compared to SM.

Comparison of number of VM migrations in the proposed CRMRCP with SM model
Therefore, the overall results prove that the cascade of ridge regression and SM gives the least number of VM migrations across the edge servers in the edge cloud architecture considered.
8 Conclusion
The results of the DMRCP model outperforms both the first order and the second-order Markov models. The overall results prove that the number of VM migrations for the dynamic Markov model is 52.9% less compared to the first-order Markov model and 21.1% less when compared to the second-order Markov model. The results of CRMRCP model proves that the cascade of ridge regression with the second order Markov model reduces the number of VM migrations by 81.8% when compared to not using any regression method for future CPU utilization prediction. The proposed solutions reduces the number of VM migrations, prevents unnecessary migrations by predicting the VMs that cause resource contention in an edge server, thereby enabling computation and processing at the edge servers efficiently. Since the VM migrations are done from the edge servers predicted to be overloaded, resource contention is avoided, and also migration traffic is reduced in the edge cloud, thereby, maintaining the applications’ performance. The future work will involve the prediction of other resources like memory, storage needed for computation across edge servers.
References
Al-Shuwaili A, Simeone O (2017) Energy-efficient resource allocation for mobile edge computing-based augmented reality applications. IEEE Wirel Commun Lett 6(3):398–401
Alasmari KR, Green RC, Alam M (2018) Mobile edge offloading using markov decision processes. Lecture Notes in Computer Science. Springer, Berlin, pp 80–90. https://doi.org/10.1007/978-3-319-94340-4_6
Bahreini T, Badri H, Grosu D (2019) Energy-aware capacity provisioning and resource allocation in edge computing systems. International Conference on Edge Computing. Springer, Berlin, pp 31–45
Beloglazov A, Abawajy J, Buyya R (2012) Energy-aware resource allocation heuristics for efficient management of data centers for cloud computing. Future gener comput syst 28(5):755–768
Cao K, Liu Y, Meng G et al (2020) An overview on edge computing research. IEEE Access. https://doi.org/10.1109/access.2020.2991734
Caprolu M, Di Pietro R, Lombardi F, et. al (2019) Edge computing perspectives: Architectures, technologies, and open security issues. In: 2019 IEEE International Conference on Edge Computing (EDGE), pp 116–123, Doi: https://doi.org/10.1109/EDGE.2019.00035
Chen J, Wang Y (2020) An adaptive short-term prediction algorithm for resource demands in cloud computing. IEEE Access 8:53915–53930
Chen X, Shi Q, Yang L et al (2018) Thriftyedge: Resource-efficient edge computing for intelligent iot applications. IEEE net 32(1):61–65
El-Moursy AA, Abdelsamea A, Kamran R et al (2019) Multi-dimensional regression host utilization algorithm (mdrhu) for host overload detection in cloud computing. J Cloud Comput 8(1):1–17
Elgendy IA, Zhang W, Tian YC et al (2019) Resource allocation and computation offloading with data security for mobile edge computing. Future Gener Comput Syst 100:531–541
Farahnakian F, Liljeberg P, Plosila J (2013) Lircup: Linear regression based cpu usage prediction algorithm for live migration of virtual machines in data centers. In: 2013 39th Euromicro conference on software engineering and advanced applications, IEEE, pp 357–364
Jia F, Zhang H, Ji H, et al (2018) Distributed resource allocation and computation offloading scheme for cognitive mobile edge computing networks with noma. In: 2018 IEEE/CIC International Conference on Communications in China (ICCC), pp 553–557
Jiang C, Fan T, Gao H et al (2020) Energy aware edge computing: A survey. Comput Commun 151:556–580
Jošilo S, Dán G (2019) Wireless and computing resource allocation for selfish computation offloading in edge computing. In: IEEE INFOCOM 2019-IEEE Conference on Computer Communications, IEEE, pp 2467–2475
Jošilo S, Dan G (2021) Joint management of wireless and computing resources for computation offloading in mobile edge clouds. IEEE Trans Cloud Comput 9(4):1507–1520. https://doi.org/10.1109/TCC.2019.2923768
Kolosov O, Yadgar G, Maheshwari S, et. al (2020) Benchmarking in the dark: On the absence of comprehensive edge datasets. In: 3rd \(\{USENIX\}\) Workshop on Hot Topics in Edge Computing (HotEdge 20)
Liu X, Qin Z, Gao Y (2019) Resource allocation for edge computing in iot networks via reinforcement learning. In: ICC 2019-2019 IEEE International Conference on Communications (ICC), IEEE, pp 1–6
Liu X, Yu J, Wang J et al (2020) Resource allocation with edge computing in iot networks via machine learning. IEEE Internet Thin J 7(4):3415–3426
Mandal G, Dam S, Dasgupta K et al (2020) A linear regression-based resource utilization prediction policy for live migration in cloud computing. Algorithms in machine learning paradigms. Springer, Berlin, pp 109–128
Marquardt D, Snee R (1975) Ridge regression in practice. Am Stat - Amer Statist 29:3–20. https://doi.org/10.1080/00031305.1975.10479105
Muthukrishnan R, Rohini R (2016) Lasso: A feature selection technique in predictive modeling for machine learning. IEEE Int Con Adv Comput Appl (ICACA). https://doi.org/10.1109/ICACA.2016.7887916
Park K, Pai VS (2006) Comon: a mostly-scalable monitoring system for planetlab. ACM SIGOPS Operat Syst Rev 40(1):65–74
Patil S, Patil S (2021) Linear with polynomial regression: Overview. Int J Appl Res 7:273–275. https://doi.org/10.22271/allresearch.2021.v7.i8d.8876
Plachy J, Becvar Z, Strinati EC (2016) Dynamic resource allocation exploiting mobility prediction in mobile edge computing. In: 2016 IEEE 27th Annual International Symposium on Personal, Indoor, and Mobile Radio Communications (PIMRC), pp 1–6, Doi: https://doi.org/10.1109/PIMRC.2016.7794955
Shan N, Cui X, Gao Z (2020) Drl+ fl-an intelligent resource allocation model based on deep reinforcement learning for mobile edge computing. Comput Commun 160:14–24
Shan N, Li Y, Cui X (2020b) A multilevel optimization framework for computation offloading in mobile edge computing. Mathematical Problems in Engineering 2020
Shi W, Cao J, Zhang Q et al (2016) Edge computing: Vision and challenges. IEEE Int Thing 3(5):637–646
Shingne H, Sountharrajan S, Karthiga M et al (2020) Lasso and ridge regression for optimized resource allocation in cloud computing. J Adv Res Dynam Contr Syst 12:1740–1747
Spatharakis D, Dimolitsas I, Dechouniotis D et al (2020) A scalable edge computing architecture enabling smart offloading for location based services. Pervasive Mobile Comput 67(101):217
Surya K, Rajam VMA (2021) Prediction of resource contention in cloud using second order markov model. Springer Comput. https://doi.org/10.1007/s00607-021-00967-1
Svorobej S, Takako Endo P, Bendechache M et al (2019) Simulating fog and edge computing scenarios: An overview and research challenges. Future Internet 11(3):55
Tao Z, Xia Q, Hao Z et al (2019) A survey of virtual machine management in edge computing. Proceed IEEE 107(8):1482–1499
Xiong X, Zheng K, Lei L et al (2020) Resource allocation based on deep reinforcement learning in iot edge computing. IEEE J Selec Area Commun 38(6):1133–1146. https://doi.org/10.1109/JSAC.2020.2986615
Yang G, Hou L, He X et al (2021) Offloading time optimization via markov decision process in mobile-edge computing. IEEE Internet Thin J 8(4):2483–2493. https://doi.org/10.1109/JIOT.2020.3033285
You C, Huang K, Chae H et al (2016) Energy-efficient resource allocation for mobile-edge computation offloading. IEEE Transact Wirel Commun 16(3):1397–1411
Yousefpour A, Fung C, Nguyen T et al (2019) All one needs to know about fog computing and related edge computing paradigms: A complete survey. J Syst Architec 98:289–330. https://doi.org/10.1016/j.sysarc.2019.02.009
Zhang K, Mao Y, Leng S et al (2016) Energy-efficient offloading for mobile edge computing in 5g heterogeneous networks. IEEE access 4:5896–5907
Zhao Z, Min G, Gao W et al (2018) Deploying edge computing nodes for large-scale iot: A diversity aware approach. IEEE Internet of Things Journal 5(5):3606–3614
Zhu G, Liu D, Du Y et al (2020) Toward an intelligent edge: wireless communication meets machine learning. IEEE Commun Mag 58(1):19–25
Author information
Authors and Affiliations
Corresponding author
Additional information
Publisher's Note
Springer Nature remains neutral with regard to jurisdictional claims in published maps and institutional affiliations.
Rights and permissions
Open Access This article is licensed under a Creative Commons Attribution 4.0 International License, which permits use, sharing, adaptation, distribution and reproduction in any medium or format, as long as you give appropriate credit to the original author(s) and the source, provide a link to the Creative Commons licence, and indicate if changes were made. The images or other third party material in this article are included in the article's Creative Commons licence, unless indicated otherwise in a credit line to the material. If material is not included in the article's Creative Commons licence and your intended use is not permitted by statutory regulation or exceeds the permitted use, you will need to obtain permission directly from the copyright holder. To view a copy of this licence, visit http://creativecommons.org/licenses/by/4.0/.
About this article

Cite this article
Surya, K., Rajam, V.M.A. Novel Approaches for Resource Management Across Edge Servers. Int J Netw Distrib Comput 11, 20–30 (2023). https://doi.org/10.1007/s44227-022-00007-0
Received:
Accepted:
Published:
Issue Date:
DOI: https://doi.org/10.1007/s44227-022-00007-0