
Abstract
In this chapter, we will discuss concepts of information diffusion in social networks. We are interested in knowing how a piece of information (knowledge) is spread through a network. These may be computer viruses spreading on the Internet or a network of computers, diseases through a social network, or rumors and ideas through a social network. Information diffusion methods are commonly used in viral marketing, in collaborative filtering systems, in emergency management, in community detection, and in the study of citation networks.
You have full access to this open access chapter, Download chapter PDF
Keywords
These keywords were added by machine and not by the authors. This process is experimental and the keywords may be updated as the learning algorithm improves.
In this chapter, we will discuss concepts of information diffusion in social networks. We are interested in knowing how a piece of information (knowledge) is spread through a network. These may be computer viruses spreading on the Internet or a network of computers, diseases through a social network, or rumors and ideas through a social network. Information diffusion methods are commonly used in viral marketing, in collaborative filtering systems, in emergency management, in community detection, and in the study of citation networks.
We will present, in detail, two general types of information diffusion in social networks: diffusion of innovation and epidemics. Diffusion of innovation is studied in many fields, but in this chapter, we are considering it only from a social network perspective. Other kinds of information diffusion that are not included in this chapter include herd behavior and information cascades.
8.1 Diffusion
Diffusion is the process by which information is spread from one place to another through interactions. It is a field that encompasses techniques from a plethora of sciences and techniques from different fields such as sociology, epidemiology, and ethnography. Of course, everyone is interested in not getting infected by a contagious disease. The diffusion process involves three main elements as follows:
-
1.
Sender. A sender (or a group of senders) is responsible for initiating the diffusion process.
-
2.
Receiver. A receiver (or a group of receivers) receives the diffusion information from the sender. Commonly, the number of receivers is higher than the number of senders.
-
3.
Medium. This is the channel through which the diffusion information is sent from the sender to the receiver. This can be TV, newspaper, social media (e.g., a tweet on Twitter), social ties, air (in the case of a disease spreading process), etc.
From a network point of view: how is the diffusion process handed over? In fact, social relations play a significant role. They are the channels by which social contagion and persuasion are done. Particularly, the structural positions of persons and their personal characteristics make some people more ready to adopt the innovation than others. Networks with different patterns of connection have different properties regarding how things are propagated, which have significant implications for interventions into, for example, rumor propagation.
A diffusion starts with an adopter (or a few number of adopters) who spreads the innovation to others. Innovation typically represents newness, it is not the same thing as invention, it is both a process and an outcome, and it involves discontinuous change.
Those who adopt early are often too innovative to be influential in a local network. They contaminate their contacts who in turn contaminate their contacts and so on. The more people a person is linked to, the greater the chances that that person will adopt the innovation. At a larger scale, and since communities are interlinked, it is very likely that an innovation jumps from one community to another via boundary spanners (or bridges) and starts over diffusing again. It is a characteristic of social networks.
However, any diffusion process can be expedited, delayed, or even stopped if it is discovered that the product (e.g., a video, an audio, a book, etc.) is faulty, and it should be fixed and then released again. This process is called an intervention. Intervention can be achieved via several methods such as stopping the production of the product, limiting the distribution of the product, restricting the exposure to the product, reducing the interest in the product, or reducing interactions within the population. In any way, intervention processes can cause damage to the work of small companies as many customers will no longer trust the products that are produced by these companies.
8.2 Contagion
Another important concept that is sometimes used alongside diffusion is contagion. It describes how a disease can spread rapidly in a network. In its biological form, contagion requires close physical contact to propagate. However, at times, merely being in the same place where infections/germs are present is enough to spread the disease. Even in these cases, there are limiting factors that influence whether an exposed person will catch a disease or not such as age, gender, immunity, length, weight, overall health, the strength of the virus, and timing of contact with the infected nodes.
Contagion models are similar to diffusion (or social contagion) models but with some distinctions between the two as follows:
-
Contagion is often viewed through the lens of infectious diseases (although sometimes it used to describe different phenomena in the marketing and social spaces). Diffusion, on the other hand, is the process or state of something (an idea, innovation, rumor, digital property, and so on) spreading more widely.
-
Contagion is commonly initiated by an infection, while diffusion is initiated by traditional media, word of mouth, advertising, or industry events, just to name a few.
-
While contagion does not condition a direct contact between the victim and an infected body, diffusion, on the other hand, is concerned with the spread of ideas, innovations, and other concepts that require some direct contact (not necessarily a physical contact).
-
Contagion is dependent on physical proximity, regardless whether others are part of a person’s social or professional network. The case is different for diffusion which requires some social contact or influence to take root.
-
Contagion models do not involve processes such as decision making, in which an individual makes a decision whether to become infected or not because contagion is considered a random natural process. In diffusion models, diffusion making is typically involved. For example, when a rumor is spreading, the set of individuals who receive this rumor would decide whether they are interested in spreading it to their neighbors or not.
In the following section, we will discuss diffusion on innovations, which explains how new ideas and practices spread within and between communities.
8.3 Diffusion of Innovation
Diffusion of innovation, which is an important social process, describes how an innovation (e.g., product, music, video, fad, opinion, or attitude) is handed over from one node (person) to another in a social network over time. It is the theory that has used network principles and perspectives most extensively and has provided the theoretical underpinnings to research how networks influence behavior and behavior change.
New ideas or practices enter communities from external sources such as mass media, labor exchanges, technological innovations, cosmopolitan contact, and many others. However, they can also be originated in the same community where they diffuse. In all these cases, diffusions are done through interpersonal contact networks.
Having roots in anthropology, economics, geography, sociology, marketing, epidemiology, and others, diffusion of innovation is critical for many groups. For example, organizations are interested in the diffusion of information, and opinion makers are interested in the adoption of new products.
Hundreds of studies were conducted in the 1950s and the early 1960s to find answers to why and how innovations spread, the reasons for the diffusion process, why some people adopt a new idea, why some people adopt earlier than others who wait for a substantial amount of time before adopting, and the rate at which an innovation spreads. The research in the field refreshed in recent years with the advent of more sophisticated network models and technology.
It should be noted that diffusion of innovation typically takes a long time. For example, the telephone took decades before it became popular in the USA, and the videocassette recorder (or VCR) took a long time to populate. The reason for the diffusion is that it is often the result of a network structure, which for one reason or another inhibits diffusions. In contrast, the advent of computer technologies and mobile communications has accelerated that rate at which information and other products are adopted. For example, Facebook took only a few years to reach millions of users.
8.4 Adoption of Innovations
An adoption is a decision taken by a person (or persons) that includes a full use of innovation as the best course of action available. An important observation is that adoption does not happen right after a person first someone learns about a new product. Rather, five stage processes of adoption are included in the theory of diffusion of innovations. These stages can be adopted for use in market segmentation and for use in measuring the progress toward behavior change.
-
1.
Becoming aware of the product (but with a limited size of information)
-
2.
Starting to find more information about the product
-
3.
Making a decision to adopt it
-
4.
Trying the product
-
5.
Fully adopting the product
8.5 Diffusion of Innovation Models
Social networks allow many new ideas and practices to spread through interpersonal contacts that largely consist of interpersonal communication. Many of the things that spread can be modeled in similar ways. Hence, knowing how diseases, for example, propagate through networks will also let us know how the rest of things propagate. For example, in retail marketing, information such as reviews and feedback are spread at no cost to the seller via what is called viral marketing. Such a mechanism of information spread is important because it provides a way to know how people are looking at the particular product.
The social media, in most communities, are central to the spreading of information. Hence, several models have been proposed to represent the process in which the social media is responsible for the spread of information (or mass communication). In this section, we will consider one of these models, which is the two-step flow model (or the multistep flow model) which was proposed by Elihu Katz, a professor of communication at the University of Pennsylvania. In cooperation with Paul Lazarsfeld and Robert Merton, Professor Katz pioneered many innovations particularly on how radio and television influenced mass audiences.
8.6 Two-Step Flow Model
The two-step flow model is one of the simplest models to model the diffusion of the innovation process. The model considered the effects of mass media on many behaviors including customer behavior and voting patterns. The model proposed the idea that media effects were mediated by interpersonal influence, as opposed a previous view that the mass media had impacted people directly.
In this model, which is consistent with a network approach, mass communication processes are divided into two stages.
-
1.
In the first stage, mass media influence opinion leaders. Opinion leaders are individuals who commonly have a high influence on the behavior of the rest in his or her network by virtue of age, experience, charisma, embeddedness, and perceived homophily. They use both types of ties (silent social relations and advice and friendship relations) to tell their contacts about how important the innovation is and why they should adopt it.
-
2.
In the second stage, opinion leaders influence potential adopters. People who were exposed to messages from mass media did not automatically believe them. Because opinion leaders were more exposed to media and more aware of the current trends, they were able to persuade others to follow their views with the help of media communications to support their arguments. This model, and because media influence opinion leaders who in turn influence others that in turn influence others, can also be called a multistep flow model (Fig. 8.1).
Fig. 8.1 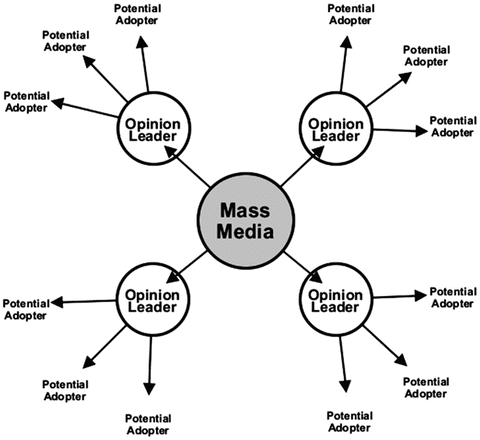
Two-step flow model

Here is a simple example of how the two-step flow model works. Suppose that a company is trying to market a new software program in a network of users. The company did not allocate enough budget for the campaign. So, what it did is that it selected a small number of users (shop owners) to promote its software, shop owners who are central in their local networks with the highest in-degree scores. They can talk to their friends, customers, and social connections about the software and why it is a new trend in the market. Their immediate neighbors, in turn, will talk about the product to their neighbors and so on until finally the news about the product is spread to a large population of users in the network. In this simple example, the company is the mass media, shop owners are the opinion leaders, and neighbors are the potential adopters.
8.7 Social Contagion
The process by which an innovation is passed from one tie to another is called social contagion. This process is similar in many ways to the spread of an infectious disease. The model, which is a chain-like form, starts with a small number of people who adopt the innovation. This number increases in the second stage when many other people adopt the innovation. Although the number of adopters increases largely in the second stage, the growth rate decreases, particularly after 10–20% of the actors have adopted. In the third stage, the number of people who adopt the innovation decreases until the diffusion process slowly reaches its end.
Those who decide to adopt the innovation are doing so either dependently (i.e., they received information that other people had adopted the innovation) or independently. Those who adopt an innovation dependently are assuming that because others also adopted the innovation, it is a strong signal of its value. The information they receive can be either local (information about the behavior of his or her immediate neighbors, e.g., coworkers in a company) or global (information about the behavior of all the individuals in the extended network, e.g., a union).
The process of adopting an innovation can be represented as a graph called the diffusion curve. In this curve, which has the sigmoid function shape (S), the x-axis is the lifetime of a diffusion, and the y-axis is the percentage of innovation adopters.
It should be noted that the size of adoption and adoption speed are bigger in dense networks than in sparse networks, unconnected networks, and networks with cut points or bridges. An individual with a larger number of neighbors is likely to adopt earlier than a person with few neighbors. A diffusion that starts with a person having a central position in the network can be faster than with a person positioned at the network periphery.
8.8 Adoption Rate
The adoption rate is a metric used to measure the speed of the diffusion process at a particular time. This metric represents the number of new people who adopt the innovation at a given time. Clearly, network structure has a high impact on the diffusion process such that a diffusion process, which starts with a node in a central position, can reach a significant amount of the desired population in a shorter time. However, the network structure is not the only parameter. The type of innovation itself and personal characteristics of individuals also influence the flow of adoption.
8.9 Adoption Categories and Thresholds
Not everybody can get infected if only his or her neighbor is infected. Friendship alone is not enough to persuade someone to adopt something. This is because some people are less receptive to innovation than other people. One way to explain this observation is through what is called adoption categories.
According to the adoption categories, people can be classified based on their adoption time in relevance to all other adopters. For example, in marketing, adopters are categorized into four categories: early adopters, who constitute 16%; early majority, who constitute 34%; late majority, who constitute 34%; and late adopters or laggards, who constitute 16% of all adopters. This type of classification is important for marketers because it helps them identify the social and demographic characteristics of early adopters.
8.10 Amount of Exposure
The amount of exposure, for a particular person in a network at a given time, is the portion of a person’s neighbors who have adopted the innovation before that time. Once exposure reaches its required level for that person, he or she will approve the innovation and start infecting others. This model treats time more explicitly in the sense that it models what happens at the microlevel at each point in the time during a diffusion. Some researchers refer to the amount of exposure as network exposure, referring to the influence of a person’s social network and measured with the following equation:

where W is the network weight matrix that represents the direct contacts of one person and y is a vector of adoption behavior. In the case of egocentric networks, network exposure model can be weighted by many factors such as the frequency of interaction and the similarity between ego and his or her neighbors. With sociometric data, many types of social influence can be used to weight network exposure model.
Suppose that a person has four friends in his social network. Network exposure (or E i ) is the proportion of those who have adopted an innovation (Fig. 8.2).

Amount of exposure at four-time steps
The above figure shows network exposure for a person with four friends at four points in time. At the first time point, this person has one adopter, so exposure is 25%. At the second time point, there are two adopters, so network exposure is 50%. At the next time point, there are three adopters so exposure is 75%. After all four friends adopt, exposure is 100%.
Adoption of innovation is not a straightforward process as it depends on a person’s characteristics and features of the innovation. Even though some people are not close enough to the source of diffusion, they still adopt early. This is because the amount of exposure varies over time and among people. Knowledge about a friend’s adoption or that other persons with similar network positions have adopted may persuade a person to adopt.
For any innovation to be adopted, the expected adopter should be in agreement with the relevance, content, benefit, immediacy, and source of the innovation. This means that innovations should be observable, have a relative advantage over current practices, be compatible with the sociocultural paradigm, and not be highly complex.
It is possible to calculate adoption time for each person at each point in time. This process is called event history analysis. This is important because, at the time that we have a diffusion of a new product, we can analyze for each person whether he (or she) has adopted the product and how many of his or her neighbors have adopted it too.
8.11 Adopters and Adoption
People show different levels of exposure before they adopt. For example, some people can be easily persuaded such that they only need to know someone who had already adopted the idea, whereas others would take a longer time to adopt. Also, some people receive more exposure, whether from media or social ties, than others. This is referred to as threshold of exposure, which represents the level of exposure that an individual needs to adopt an innovation. Identifying these thresholds (also called individual tipping points) is important for researchers because it enables them to understand the different types of adopters and the low- and high-threshold ones.
Early adopters are those who are more vulnerable to innovations such that they will do so when only a few people in the network have already adopted. In other words, their thresholds are low. Such people do no wait for a majority of their network to adopt the innovation before they are willing to. They take risks and adopt new behaviors before their peers are ready to do so.
Late adopters (or laggards), on the other hand, are hard to persuade and will only adopt once most others in their network have adopted. They are typically embedded in sparse social networks, have lower social status, are less exposed to mass media, and tend to learn about new ideas or products from interpersonal channels, particularly trusted peers.
People with lower threshold values are more innovative and are expected to adopt an innovation earlier than noninnovative people. We expect that those people turn to the media to learn about new ideas and trends. This occurs because they have few peers to take advice from about the new idea or trend. When the adoption occurs, they transport the new idea or trend to their local community, acting as bridges.
This positive relation between low exposure thresholds and innovativeness (adopting the innovation earlier than other actors in his or her social circle) conditions the presence of extensive media use, many contacts outside the local community, a high level of education, and a high socioeconomic status.
Back to our adoption model, the first adopters cannot be exposed to earlier adopters. Therefore, their thresholds are zero. On the other hand, the last adopters are very likely to be connected to earlier adopters. Therefore their exposure and thresholds are high at the time of adoption.
Example
Let us take a look at what a simple diffusion process, which is related to the adoption of innovation in a small network, might look like (Fig. 8.3):

Simple diffusion process
Here is a case where we have the following criteria:
-
The network is directed. Nodes (actors) and edges depict the communication channels between actors. A node can only have an effect on the node (or nodes) that it is connected to. Once a node is activated, it can activate its neighboring nodes.
-
TE numbers on the chart are the threshold of exposure values, which represents the level of exposure that an individual needs to adopt an innovation. For instance, nodes G and F both have a threshold of exposure equals 0.8. Each of the remaining nodes has a threshold of exposure equals 0.6.
-
The numbers on the edges represent the degree of relative influence (network exposure such as trust, persuasion, or blind imitation) one node has on another. For instance, node A, which is the source of the diffusion, has relative influence levels of 0.8, 0.3, and 0.3 on nodes B, F, and E, respectively.
-
Node B has already adopted the innovation because the relative influence of node A on node B exceeded the threshold of exposure of node B, which is 0.6.
-
Node G is thinking of adopting the innovation. It is receiving an adequate accumulative support from its neighbors that exceeds its threshold of exposure, which is 0.8. Note that knowing that node B has adopted the innovation was not sufficient for node G to adopt the innovation. It needed further support from one of the two remaining nodes before feeling confident enough to make the adoption.
-
None of the nodes C, D, E, and F has received the adequate level of influence from its neighbors that satisfied the requirements of its threshold of exposure.
8.12 Critical Mass
A diffusion process may succeed if almost everybody in the target group adopts the innovation. However, it may fail if only a few people adopt and spread the innovation. This observation can by justified by what is called critical mass, which represents the minimum number of adopters needed to sustain a diffusion process. Once the critical mass is achieved, it has ongoing momentum that keeps the diffusion going and is hard to reverse.
The critical mass concept (also called critical level or the tipping point) applies to many phenomena and seems nearly ubiquitous. It explains how opinion leaders have a strong effect on others’ behavior where this effect can be scaled up to the national or international level.
However, why this happen? I mean why the critical mass causes the number of adopters to flourish suddenly? The answer to this question has two slots. The first one looks at the process as purely quantitative. When a sufficient number of well-connected people are achieved, other people become exposed to the innovation, after which even more people are exposed. The second slot looks at the process as a qualitative change to the system, namely, a sudden lowering of individual thresholds that makes some people feel confident or even obliged to adopt the innovation.
Betweenness centrality measure is typically linked to critical mass. Targeting those with high betweenness centralities in the network is a good strategy for launching a successful innovation.
The diffusion process requires, in its first stages, outside help in the form of, for example, an advertisement campaign. However, in later stages, the diffusion process can sustain or even accelerate itself without help from outside, particularly when a sufficient number of opinion leaders adopt the innovation. Social contagion then ensures wide and rapid diffusion.
If a diffusion fails to reach the critical mass within a certain amount of time, its adoption rates level off, and the diffusion eventually dies. In contrast, a diffusion may reach its critical mass, and the adoption grows exponentially until it reaches what is called saturation point—a point in which almost all those who received the exposure have adopted the innovation. From that point, the diffusion will start to decline and finally dies.
The pinpoint of the moment when critical mass is reached is not easy. We may need to have detailed information about the effects of some events such as media campaigns and social contagions on the diffusion process. Two approaches are proposed by researchers in an attempt to know if a critical mass is reached or not: the first approach uses a rule of thumb and assumes that a particular phenomenon occurs when the innovation has been adopted by 16 (or 10–20) percent of all people who will adopt eventually. The other perspective assumes that a diffusion process attains its critical mass when the most central people have adopted. At that point, so many actors in the network are exposed to adopters, and many of them have achieved their exposure thresholds.
Example
Suppose that we want to draw the diffusion curve for a new social media platform. The website administrators tried to build local marketplace that spans the entire country. They first confined to a small dense local community but expanded later to include all other communities in the country (Fig. 8.4).

Diffusion curve for the new social media platform
The innovation adoption model, shown above, starts with a limited number of people. The x-axis indicates the time of adoption and the y-axis, thresholds, the percentage of network contacts who have adopted. We can see, for example, that 50% of the community had adopted when roughly half the time had passed. We can see, however, that many people have thresholds above and below this value.
Path A shows a rapid and complete adoption by a population. After reaching the required critical mass in the second stage, the number of adopters increases sharply, but the last part of it witnesses a decrease in the growth rate. After reaching saturation in the final stage, the number of adopters decreases, and the diffusion model dies. The curve (growth of population) witnesses what is fluctuation points, times where the curve accelerated or deaccelerated dramatically. What happened is that the new social media platform is especially prone to critical mass effects because when this innovation was adopted by a largely sufficient number of people, it became too difficult for them to defect to another medium. Although the adoption curve A shows a simple natural growth of adoption, it does not tell us why some people have adopted the product, why do some people do so much later than others, or why some people never adopt it at all.
Other scenarios are also likely for the product adoption. For example, path B shows a similar pattern to path A but follows a longer lag phase. In path C, the adoption failed to reach the critical mass (which is needed to convince the majority of the audience of the utility of the product), while path D witnesses a sudden decline for an unknown reason although the critical mass threshold is achieved.
Motivations of innovation adoption are quite different before and after a system has reached its critical mass such that adoption before the critical mass carries more risk.
Various types of models have been developed, such as game theoretical, epidemic, threshold, and cascade, to study the information diffusion in social networks. In the following section, we will consider information diffusion in epidemics.
8.13 Epidemics
An epidemic is a disease outbreak such as malaria, bubonic plague, or AIDS that spreads widely via some spreading mechanism such as breathing, blood transfusion, drinking, eating, or sexual activity, within a population of hosts such as humans, animals, or plants. Although the term is commonly used in the context of diseases and their spreading throughout a population, it can also be used to describe the spread of perceived problems in a society or the adoption of a product.
Understanding the potential of an epidemic requires that we fully understand the biological process within each host, the immune system process, interactions among individuals, and social and cultural attributes.
We also need, from a network perspective, to understand the structure of the network and the significance of nodes (persons) within the network. By exposing the structure of the underlying network, it becomes highly possible to gain considerable insight into the potential spread of the diffusion (disease) and whether a new diffusion will succeed or not.
-
Highly influential nodes (hubs) in the network enable a rapid spread of a disease through the network. In contrast, poorly connected or periphery nodes would slow the spreading of information and allow only a small portion of the network to get exposed to the diffusion.
-
Networks with lots of localized clusters (i.e., a highly fragmented low-density network) may limit the spread of a disease and will have difficulty in establishing any momentum, whereas dense networks with few gaps (i.e., few boundary spanners) would promote the dissemination of the disease.
The transmission of a disease in a network can be stopped via some outside intervention such as simple avoidance, vaccination, or isolation. Such procedures are highly capable of reducing and perhaps halting the spread of the disease.
8.14 Epidemic Models
Epidemic modeling has been an active research area for researchers working on network-based dynamic process models. The Black Death epidemic in the thirteenth century, the Great Plague of London, the smallpox epidemic in the seventeenth century, and recent epidemics such as HIV/AIDS, SARS, and H5N1 motivated the study of epidemics and introduction of the epidemic models.
An epidemic model is a simplified means of describing the transmission of an infectious disease through individuals. Various models have been developed to study the mechanisms by which diseases spread, to predict the future course of various real-world outbreaks, and to evaluate strategies to control an epidemic. In the following section, we will take a look at a group of traditional (i.e., nonnetwork) epidemic models.
8.15 Deterministic Compartmental Models
In the deterministic compartmental model, individuals in the population are assigned to different subgroups or compartments such that each represents a specific stage of the epidemic. This model is useful for dealing with large populations, such as in the case of tuberculosis. It categorizes people according to their state on the disease. All people are in one of these three states:
-
1.
Susceptible (S): not infected yet but susceptible to catch the disease
-
2.
Infected (I): caught the disease and contagious
-
3.
Recovered (R): no longer contagious or susceptible to reinfection
A combination of these three letters gives several disease models. The common ones are SIR, SIS, SI, and SIRS. All of these models were originally designed to study how infectious diseases break out and spread over a population. They also describe the disease cycle in a host, using a combination of terms (I, R, S) to characterize each stage. In the following section, we will focus on one of these models, which is the SIR model.
8.16 SIR Model
This susceptible-infected-recovered (SIR) model, which was first introduced by Kermack and McKendrick in 1932, describes a disease where a person is susceptible, gets infected, recovers, and becomes finally immune to the disease. This model is the one most commonly used class of the continuous-time epidemic models. Examples of such diseases include polio, measles, mumps, and rubella. In the first phase, people start out to be initially susceptible to the disease. In the second phase, they may become infected by contact with another infected person. They can also infect others in this phase. In the third phase, they become recovered and cannot get infected again.
The SIR model was successfully used on large real-world networks to explore how the structure of the underlying network affects the diffusion process. It was also used to study the information spread taking place in conjoint frameworks. It was also used to explore the spread of violence or extremist topics in social media.
Three components are included in this model: the nodes that are connected to each other, the paths that the disease takes to spread, and the way that these nodes get infected and then recover.
At any time step, only infected nodes can infect any of the neighboring nodes which are in a susceptible state to the disease with some probability β. After that time step, the node that was previously in the infected state moves into a recovered state with probability α and is no longer able to infect others or get infected. Figure 8.5 above depicts the SIR model.

SIR model showing the three phases
Example
The following figure shows a hypothetical diffusion of the epidemic through a small network consisting of eight nodes. These nodes are connected through symmetric ties that allow for the spread of infection from one node to another. Nodes that get infected can infect others but eventually recover. We are assuming that one infected neighbor is enough to become susceptible to the disease. The figure shows four rounds of diffusion, beginning with two infected nodes, A and B. Each round represents the network status at a given period (Fig. 8.6).

Hypothetical diffusion of epidemic
-
1.
Nodes A and B in round 1 have knowledge about the information (i.e., they are infected) and can transmit the information to their neighbors. However, they recover from the infection in the next round. When they recover, they forget all about this information (infection) or lose interest in it. They cannot acquire the same infection for the second time.
-
2.
Nodes C, D, and E do not know yet about the information (infection), but they are susceptible in round 1 due to their connections to the infected nodes, although not infected yet. This does not mean that the infection is inevitable, as many factors will influence whether an exposed person will catch a disease or not. These nodes become infected in round 2, recover in round 3, and never become infected or contagious again.
-
3.
Nodes F, G, and H in round 1 are neither infected nor susceptible. However, they become susceptible in round 2, infected in round 3, and finally recover in round 4.
8.17 Properties of the SIR Model
Some of the properties that we should put in mind regarding the functionality of the SIR model:
-
The SIR model puts no consideration to the level of susceptibility or what makes some people more or less likely to catch a disease. This means that a person is either susceptible or not.
-
The processes included in this model are deterministic (as opposed to stochastic) which means this model assumes that any susceptible person who is exposed to an infection will get infected too. This assumption is not very realistic in real life because some people are more robust to diseases compared to some others who are genetically more likely to get sick. Also, disease spread at different rates and individuals have various levels of exposure to them.
-
The model assumes that after the recovery from a disease, the person will no longer become susceptible. In the susceptible-infected-recover-susceptible (SIRS) model, an individual is susceptible, becomes sick, recovers, enjoys a period of immunity, and finally becomes susceptible again.
-
In the SIR model, when a person recovers from a disease, he or she becomes immune to the disease. In contrast, according to the susceptible-infected-susceptible (SIS) model, the infected person does not become immune to the disease after the infection. On the other hand, the susceptible-infected (SI) model describes fatal diseases where the infected person never returns to the recovered or susceptible states.
Example
We will see how we can model epidemic spreading on a network. The following example gives credit to the book.
The network structure influences infection such that nodes with a high degree will potentially infect neighbors and also get infected.

We define a function that, given β and α, makes an SIR model function and returns it for later use:

Now, we define the spreading process as a function that takes a graph and a model function and applies the model to every node in the graph:

We will also define a function that applies the same model dynamics repeatedly for a number of iterations:

Now, we create the model. We will use the Erdos-Renyi ER model:

We will visualize the model using the spring layout (Fig. 8.7).


Epidemic spreading on a network
We then network the model with a certain proportion of sick individuals, with the rest being susceptible:

Finally, we create the network dynamics:

We now run the model:

We can also inquire what percentage of the model is infected:

Author information
Authors and Affiliations
Rights and permissions
Copyright information
© 2017 Springer International Publishing AG
About this chapter
Cite this chapter
Al-Taie, M.Z., Kadry, S. (2017). Information Diffusion in Social Networks. In: Python for Graph and Network Analysis. Advanced Information and Knowledge Processing. Springer, Cham. https://doi.org/10.1007/978-3-319-53004-8_8
Download citation
DOI: https://doi.org/10.1007/978-3-319-53004-8_8
Published:
Publisher Name: Springer, Cham
Print ISBN: 978-3-319-53003-1
Online ISBN: 978-3-319-53004-8
eBook Packages: Computer ScienceComputer Science (R0)