
Abstract
Application development is an incremental and continuous process: once an application has been designed, implemented, and deployed, it needs to be constantly monitored and improved. The same applies to real-time pipelines, with additional variables: scalability and capacity. There may be an increase in the volume and velocity of the incoming data or lower latency requirements. Over time, as requirements change, initial design choices need to be reevaluated. Developers and infrastructure engineers clamor to squeeze the last bit of performance out of both the software stack and the hardware. Regardless of the cause and effect, all such projects require rigorous and generous instrumentation—from logging and monitoring to alerting and metrics.
Access this chapter
Tax calculation will be finalised at checkout
Purchases are for personal use only
Notes
- 1.
Ellery Wulczyn and Dario Taraborelli, “Wikipedia Clickstream,” Figshare, January 4, 2016, http://figshare.com/articles/Wikipedia_Clickstream/1305770 .
- 2.
Haoyuan Li et al., “Tachyon: Reliable, Memory Speed Storage for Cluster Computing Frameworks,” Proceedings of SOCC ’14 (ACM, 2014).
- 3.
Download Tachyon version 0.6.4, and fill in $TACHYON_HOME/conf/tachyon-env.sh with values appropriate for your setup. If running it on top of the local file system, make sure TACHYON_UNDERFS_ADDRESS is set to a local file system folder, such as /tmp. Like any other file system, Tachyon first needs to be formatted via $TACHYON_HOME/bin/tachyon format before being executed: $TACHYON_HOME/bin/tachyon-start.sh [all|local].
- 4.
Instead of keeping track of each individual article, the code aggregates all of them under the key “wikipedia”.
- 5.
The application id and rdd id would obviously vary from execution to execution.
- 6.
Andrew Or, “Understanding Your Spark Application through Visualization,” Databricks, June 22, 2015, https://databricks.com/blog/2015/06/22/understanding-your-spark-application-through-visualization.html .
- 7.
You can click Input Rate to see a breakdown per receiver.
Figure 7-19. 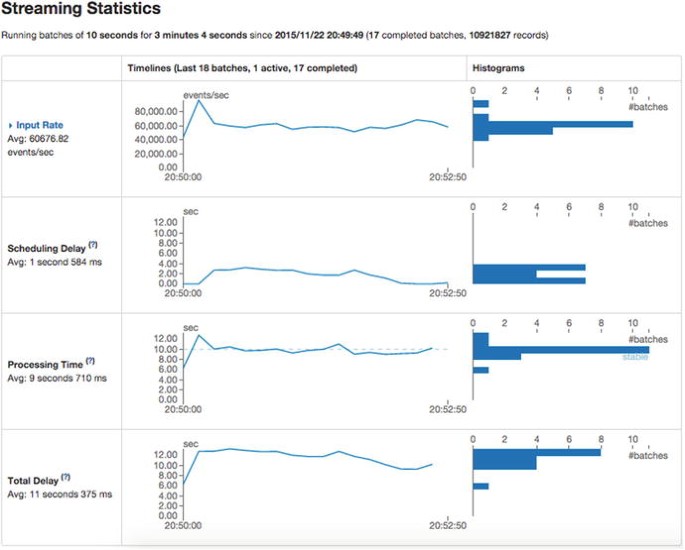
Streaming Statistics for an unhealthy application
- 8.
- 9.
- 10.
- 11.
- 12.
Install Docker on a *nix system by running wget -qO- https://get.docker.com/ | sh. Warm up Docker by executing docker-machine env default followed by eval "$(docker-machine env default)".
- 13.
- 14.
Find out the IP of a container via docker-machine ip <container_id>.
- 15.
Use your browser to jump to the Grafana dashboard on port 3000, and choose Data Sources from the menu on the extreme left. Then click Add New, and enter http://localhost:80 as the URL.
- 16.
- 17.
To set up collectd, download it from https://collectd.org/download.shtml and install it on all machines in your cluster via ./configure; make all install.
- 18.
Add LoadPlugin write_graphite to your collectd.conf, which is typically located at /etc/collectd.conf.
- 19.
- 20.
Download Nagios Core from https://www.nagios.org/downloads/nagios-core . The installation process is pretty standard: ./configure followed by make all and make install. Please refer to the Nagios web site for more information.
- 21.
- 22.
- 23.
git clone https://github.com/harisekhon/nagios-plugins .
- 24.
http://<nagios_host>/nagios.

Author information
Authors and Affiliations
Rights and permissions
Copyright information
© 2016 Zubair Nabi
About this chapter
Cite this chapter
Nabi, Z. (2016). Getting Ready for Prime Time. In: Pro Spark Streaming. Apress, Berkeley, CA. https://doi.org/10.1007/978-1-4842-1479-4_7
Download citation
DOI: https://doi.org/10.1007/978-1-4842-1479-4_7
Published:
Publisher Name: Apress, Berkeley, CA
Print ISBN: 978-1-4842-1480-0
Online ISBN: 978-1-4842-1479-4
eBook Packages: Professional and Applied ComputingApress Access BooksProfessional and Applied Computing (R0)