
Abstract
The previous two chapters discussed the various means by which consumers obtain sufficient rations. This chapter focuses on the various fates of ingested material and how this apportionment affects consumers. In this section, we will look at the overall scheme of the flow of ingested material; in the following section, we examine the processes that affect the various fates of matter ingested by consumers and some consequences of this partitioning. In many instances the rates of each process vary so widely that it is necessary for comparative purposes to use ratios between two of the processes, which we refer to as efficiencies. After completing the examination of partitioning of food in specific populations, we consider how the partitions are put together in energy budgets for populations and ecosystems.
Access this chapter
Tax calculation will be finalised at checkout
Purchases are for personal use only
Notes
- 1.
In past decades there was much research on energy in consumers and many measurements of energy content in terms of the calories of biological materials (Paine 1971; Cummins and Wuychek 1971). In general, the ash-free caloric content of consumers lies between lower values typical of carbohydrates (3.7 kcal g−1 for glucose, 4.2 kcal g−1 for cellulose) and higher values of lipids and fatty acids (9.4 kcal g−1). Most consumers have a far narrower range of caloric content, averaging about 5–6 kcal g−1 (Holme and McIntyre 1971).
- 2.
There is some ambiguity in Eq. (9-2) in that E = F + U (cf. Fig. 9-1), and most of F is material that has not been assimilated. It is generally not practical to measure this non-assimilated fraction separately.
Fig. 9.1 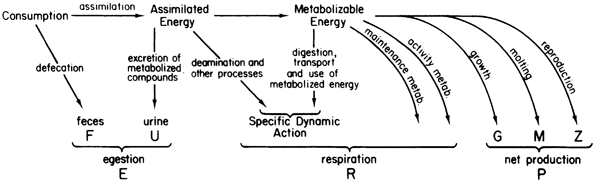
Scheme of the various fates of consumed energy and the terms used in discussing processing of energy. Many marine species release mucus in large quantities. This is not shown in this figure but could be a significant loss of energy that should be included in net production for such species. (Modified from Warren and Davis 1967)
- 3.
In warm-blooded species, there is a “basal metabolic rate” set by internal homeothermic mechanisms. For cold-blooded species there is no such thing, since body temperature depends largely on external heating, and it is usual to refer to the metabolic rate of unfed animals as the “standard metabolic rate.”
- 4.
Net growth efficiency is often labeled “K 2” in the literature; “K 1” is the gross growth efficiency, equal to (G/C) 100, and sometimes called “conversion efficiency.”
- 5.
We have already seen this pattern when discussing functional responses and search modes created by different prey densities. An extreme manifestation of this phenomenon for hungry predators is the “feeding frenzy” that takes over many predators when suddenly exposed to a very dense aggregation of prey.
- 6.
An advantage of measurement of O2 consumption or CO2 production in the field for natural waters is that the data provide assessment of respiration by the assemblage of consumer populations present. This approach can measure “community” or better said, ecosystem respiration.
- 7.
The production-size relationship is good enough to have encouraged Sheldon and Kerr (1976), based on the dimensions and food availability in Loch Ness, plus more speculative guesses as to size of Loch Ness monsters, to predict that there may be 10–20 monsters present in the Loch, assuming they are top predators.
- 8.
The units generally used are calories. The content of 1 g of phytoplankton carbon is about 15.8 kcal, 1 g of dry weight phytoplankton is about 5.3 kcal. Consumption of 1 ml of O2 by an animal provides about 3.4–5 cal; taking the latter value, and an R.Q. of 1, 1 mg of dry food is about 5.5 cal. Energy content is also expressed in joules (J), and 1 cal = 4.19 J.
- 9.
Ryther calculated that 20 × 109 t C were produced per year in the sea by primary producers. This is lower than more recent estimates of 31 × 109 t of carbon year−1 by Platt and Subba Rao (1975). Ryther also did not consider the microbial pathways of energy flow that have received recent attention. It is not clear if these omissions cancel each other; Ryther’s estimates should therefore be taken as just that: estimates.

Author information
Authors and Affiliations
Corresponding author
Rights and permissions
Copyright information
© 2015 Springer-Verlag New York
About this chapter
Cite this chapter
Valiela, I. (2015). Processing and Uses of Consumed Energy. In: Marine Ecological Processes. Springer, New York, NY. https://doi.org/10.1007/978-0-387-79070-1_9
Download citation
DOI: https://doi.org/10.1007/978-0-387-79070-1_9
Published:
Publisher Name: Springer, New York, NY
Print ISBN: 978-0-387-79068-8
Online ISBN: 978-0-387-79070-1
eBook Packages: Biomedical and Life SciencesBiomedical and Life Sciences (R0)