Special Issue on Safety of Vulnerable Road Users
- Special Issue Review
- Open access
- Published:
Piloting smart safe school bus: exploration of security gains from implementation of a driver support system, additional technical equipment and intelligent bus stops
European Transport Research Review volume 2, pages 157–163 (2010)
Abstract
Purpose
Road crash statistics reveal that school children are frequent victims and the most risky situation is when the child is outside the bus. The aim of this pilot study was to explore possible changes in speed, implementation of routines, hazard detection and child security gains from a driver support system integrated with intelligent bus stops and additional technical equipment.
Methods
In total, 130 children with transmitters were using two specially equipped busses and bus stops. Speed of oncoming and overtaking cars, implementation of routines, the possibilities to discover potential hazards and experienced stress in the children were analysed by speed measurements, diary notes, questionnaires and focus group interviews.
Results
This pilot study exploration showed that the speeds of other road users were reduced at one of two bus stops. The driver support system was frequently used in all its parts and was considered useful by the bus drivers. It also raised the level of routines and allowed the drivers to survey the children. Children reported feeling more secure with the system running and experienced less stress as a consequence of it.
Conclusion
This pilot study shows that the evaluated systems may have the ability to reduce speed of other road users, raise the level of routines and make children feel more secure. Further studies are needed that apply a holistic approach on school transportation safety and security.
1 Introduction
Going to and from school is a daily transport made by millions of children within Europe [1]. The number of children going to and from school with school transport vary between countries; in Sweden for example, having 9.2 million inhabitants, the number of children in school transportation aged 6–16 is estimated to be some quarter of a million [2]. Consequently, these frequent school related journeys put a significant pressure on society to guarantee that they are safe and secure [3].
School children are victims as they use bus transports to and from school [3–5], e.g., 9 children were fatally injured, 62 severely injured and 338 slightly injured in Sweden in 2003–2006 as a result of their school transports [6]. Children are generally less cautious than adults [7, 8], and cannot be expected to completely follow any rules set up in school transportation [9]. Instead they need routines, i.e., “...an executable capability for repeated performance in some context that been learned by an organization in response to selective processes” (p. 683) [10]. Deviations from routines in school bus travels have been shown to be crucial for incidents to take place [9]. Furthermore, crash investigations have proven the majority (64%) of the children injured in school bus related crashes to be struck when they walked or ran out behind or in front of their bus, especially in the afternoon [11] (Fig. 1). The most dangerous situations are on the way to or from the bus stop and when children wait there, not while being in the bus [6]. Surprisingly, the median age of the children injured or killed in school bus related crashes was found to be 12–13 years [11]. Apparently, age alone does not seem to lower the risk of being injured in school transportation. Unfortunately there is a lack of door-to-door perspective in crash statistics and there are no such EU-based statistics available [12].

The crash patterns of 256 children injured in Swedish school transportation 1994–2001 [11]
Despite the fact that only five scientific evaluations of support systems for school transportation have been performed between 1999 and 2005 [13–17], the EU-report “Road safety in school transport” [1] suggests several measures to increase safety for children. None of them were, however, directly linked to increased implementation of routines into school transportation. Hence, current safety and security policies lack sufficient scientific support.
Based on pilot trials [13] and then implemented in two buses in 2008, off-the-shelf technology was used to create driver support systems that supposedly raised the level of routines in school transportation in Sweden [18]. With a clear door-to-door perspective [19] the driver support system had GPS based navigation to track bus stops linked to pre-specified children and specific information about every child. The two buses were equipped with communication devices to be used at the bus stops, seat belt usage detection systems and camera surveillance both inside and outside the bus. The buses were also fitted with extra internal and external mirrors, additional interior and exterior illumination at the rear doors, external loudspeakers, seat belt reminder stickers, security cards similar to the ones used in commercial aviation and booster cushions.
More in detail, the on-board computers contained the following components:
-
Route and navigation information
-
Intelligent Speed Adaptation (ISA)
-
GPS based bus stop information
-
Information about each child scheduled to travel with the bus
-
Pre-recorded announcements for passengers getting off the bus
As part of the implementation, educational and training sessions for the drivers were carried out. During the journey, the bus driver was given information about the route with help of a navigation system. When the driver was in the vicinity of 100–200 m of the bus stop, a picture was displayed of the actual bus stop (Fig. 2). To the right on the screen, the driver was provided information about the bus’ speed and the actual speed limit. If the driver exceeded the speed limit he or she was given a visual and auditory warning signal. The name of the next bus stop and the time the bus was expected to arrive were also displayed.

An example of the information the driver saw on the dashboard mounted screen when approaching the next bus stop
At the bus stop, a sensor registered children on the bus or in the vicinity of it. The driver support system showed children expected to board the bus and if they were at the bus stop by different frame colours on the child’s photo. The children’s names were also displayed.
The driver could get more information about a child by activating the child’s name on the screen, e.g., contact details of parents/guardians and school staff. If the parents so desired, any special needs of their child were also displayed. When a child alightened the bus, the driver was presented with the same information about the child as when he/she boarded the bus, supplemented with information about whether he/she usually alighted at the front or the rear entrance of the bus and if the child needed to be accompanied across the road. As the children left the bus, they were logged off automatically. In the same way, the children were logged on automatically when they boarded the bus for their homeward bound journey. However, log on and off could be done manually by the driver, as well. When the bus approached a bus stop, the driver support system also provided the children information by playing a pre-recorded audio file that told them the name of the next bus stop and who were scheduled to get off, in addition to safety instructions. The driver could at any time quickly get an overview of the children on board. Running light warning systems were installed at two bus stops with speed limit 50 km/h (Ripa) and 70 km/h (Nymö) to warn other road-users of the presence of the children (Fig. 3, right). From a distance of 100 m the running lights were activated by the each of the 130 participating children’s tag (Fig. 3, left). Consequently, the driver could see whether or not the children were in the vicinity of 100 m from the bus stop as he/she approached it.

The warning device (Courtesy of Amparo Solutions AB)
Given this implementation, the aim of the present pilot study was to explore possible safety and security gains from the driver support systems integrated with intelligent bus stops from a safety and security aspect. The exploration was based on the assumptions that underlie the creation of the system, viz.:
-
i,
Lower speeds of other road users in the area of the bus stop lead to fewer crashes and less severe crashes.
-
ii,
Implementation of strict routines leads to fewer crashes.
-
iii,
Enhanced possibilities to discover potential hazards and intervene accordingly leads to fewer crashes.
-
iv,
Increased security and less stress in the children leads to fewer crashes.
2 Material and methods
2.1 Subjects
In total, 130 children (66 boys and 64 girls) were involved in the study by using the equipped buses and transmitters in order to communicate with the bus. Among them 55 children were granted permission by their parents to participate in the present study with names and to be involved in the pilot exploration. The two equipped buses had their ordinary drivers driving, but they were systematically replaced by five substitutes. All bus drivers were males with several years experience from driving buses and school busses.
2.2 Exploration methods
The four assumptions i–iiii was operationalized with the following methods:
-
i, Speed measurements of oncoming and overtaking cars were conducted at the two intelligent bus stops with a before/after-design. One of the buses was placed at the bus stops at randomly picked 10 min time slots relevant to school transportation during the measurements. The equipment (METOR http://www.tdp.se/) used was based on tubes on road surface for pulse registration. A validated tool for transformation of pulses into vehicle registration was used for pre-processing before analysing the results.
-
ii and iii, The drivers answered a questionnaire about the driver support system and the additional features retrofitted onto the buses. This was done during 46 working days, divided into two periods. The questions were: “Did the driver support system/additional equipment function properly today?” (yes/no), “Have you used it today?” (not at all, in rare occasions, now and then, often, all the time [when relevant]), “Have you and the children gained from it?” (yes/no), “What type of gain have you experienced?” (Increased routine/hazard reduction). They also filled out diaries everyday in order to document their perception of the system and problem encountered. The drivers were also involved in focus group interviews with the aim to further scrutinize their experiences.
-
iiii, In total, 38 (20 girls and 18 boys) out of the 55 children who granted clearance from their parents were selected to be involved in focus group interviews. The selection was made in order to have an even distribution between children’s age and schools. Furthermore, the selection ensured that children involved used the equipped bus stops and buses. The aim was to explore their experiences of safety and security in school transportation with the driver support system, the additional equipment and the intelligent bus stops in use.
2.3 Statistical methods
SPSS version 16.0 was used to check speed data for normal distribution by the Kolmogorov-Smirnov test before entered into and paired t-test comparisons. The α-level was set at .05.
2.4 Ethical aspects
According to Swedish law, the study was approved by the Regional Ethical Committee in Linköping, Sweden (EPN 19-08). The study procedures and design conformed to the Declaration of Helsinki.
3 Results
3.1 The results are presented according to assumptions i–iiii
-
i, As shown in Fig. 4, at one of the bus stops (Ripa) the average speed for cars on coming the bus was 4 km/h lower in the after measurement, i.e., 43 km/h compared with 47 km/h in the before measurement (t (370) = 1.65, p < .001). At the other bus stop (Nymö) no change was found in speed between the before and the after conditions (p = .26). However, it should be kept in mind that the before speed measurement indicated an average of 37 km/h, which is indeed an already low average speed. For overtaking traffic at Ripa the average speed was 4 km/h lower in the after measurement, i.e., 39 km/h compared to 43 km/h in the before measurement (t (344) = 1.65, p < .001). At the other bus stop (Nymö) no change in speed for overtaking cars was found between the before and the after conditions (p = .49).
Fig. 4 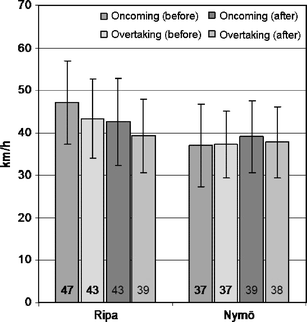
Average speed and sd, at two bus stops (Ripa and Nymö) equipped with an intelligent bus stop using flashing light when children were in an area of 100 m around
-
ii and iii, Data from the drivers’ written replies to the questionnaire are presented in Table 1. The results confirmed the assumption that the driver support system did, in fact, raise the level of routines and that the additional features retrofitted onto the buses allowed the drivers to survey the children, in order to take action in case of a hazard. In addition, several of the retrofitted features also supported the routines. As further shown in Table 1, the driver support system items and additional features retrofitted onto the buses were regarded as useful and frequently used. The reported usage of the system supports the conclusion of an acceptance of the system among drivers.
Table 1 Function, usage, days and types of gains across the driver support system items and additional features retrofitted onto the buses (Routinea: drivers said that they were well assisted by the tools to follow routines; Hazardb: drivers said that they well assisted by the tools to discover and intervene when a danger was present) During the focus groups with the bus drivers there was complains about incorrect in data. This influenced the drivers’ attitudes towards the system in a negative way. The drivers clearly expressed their role in terms of first of all focusing on driving the bus. During the discussion the drivers did not at all discussed the child perspective and the safety for children.
-
iiii, During the focus groups interviews the children reported feeling more secure with the driver support system, the additional equipment and the intelligent bus stops in use. To them, all these three parts of the system were integrated into one and the replies should be viewed from that perspective. For example, to notice that the running light were triggered as they approached the bus stop gave them a notion of awareness of the driver that they were actually being registered as present at the bus stop.
…I have a good gut feeling to ride with this particular kind of bus. I feel safe when travelling with him.

Furthermore, the children reported experiencing less stress as a benefit of the integrated system, especially when they were on their way to the bus, since they knew that the system was triggered when they were in the vicinity of the bus stop.
“…we don’t need to run when we see the bus is coming since the driver knows that we are near the bus stop”. The children did, however, not express themselves in a way that could be interpreted as if they experienced an increased level of routines due to the system.
3.2 Discussion
The evaluations of the system showed an average speed reduction at the intelligent bus stops. The system was frequently used in all its parts and considered useful by the bus drivers. Moreover, the driver support system raised the level of routines and allowed the drivers to survey the children. In addition, the children reported feeling more secure with the system running and experienced less stress as a benefit from it. However, they did not experience an increased degree of routines.
3.2.1 Speed measurements
The speed reduction of 4 km/h at one bus stop (See Ripa bus stop) is in line with speed effects in a Swedish national project focusing on evaluation of a speed limit of 30 km/h when passing a school bus [20]. Going from 47 to 43 km/h or from 43 to 39 km/h will have a big impact on the consequence in case of a crash with a pedestrian [21]. One explanation for the lack of effect at the other bus stop could be a regression to the mean effect, i.e., that the speed was low already before starting (see Nymö bus stop). Similar equipment was used to test the speed reduction from a prototype of the intelligent bus stop on high speeds roads with a baseline of 88.5 km/h. The results showed a decrease in speed with more than 20 km/h for vehicles passing in the direction closest to the bus stop [22]. Obviously, at this prototype bus stop there was a higher potential for speed reduction. One advantage with the intelligent bus stop compared with a 30 km/h passing speed limit at bus stop is that the bus stop is activated before the bus arrives and after its departure. It does follow the child, not the bus, an advantage not even reached with a mandatory Intelligent Speed Adaptation (ISA) system could achieve. As a consequence, it will contribute to reduce the speed for an increased time and at the most risky situation when going out behind the bus [11].
3.2.2 Increased routines and hazard perception
Results captured through diaries and questionnaires showed that the bus drivers expressed a notion of increased routines and hazard perception. The diaries showed an extensive usage of the different features within the system. The drivers perceived the overall system as a good support to follow routines. There is a risk that the technical system itself is not seen as positive when the data input is not correct. It could be seen that sub systems included in the drivers support system had a lower degree of high functionality due to lack of correct data. A system with the aim to support a driver needs, however, to be based on correct and updated data, in order to work well.
3.2.3 Child perceptions
Best of all would be if the children did not at all have to bother about safety during the trips to and from school. This should be the responsibility of adults. Technical solutions to detect vulnerable road users developed by different automotive companies through sensor communication could also be considered. One example is the work done within the Amulett project (http://www.projekt-amulett.de). However, since one of the ideas behind the system was to increase security and decrease stress in the children their experiences and opinions need to be regarded. Over all, the children reported feeling more secure due to the system.
Based on the focus group discussions, the relation to bus driver is essential for the children. It is he or she that has the key to a safe and secure trip to and from school. The validity of the increased feeling of security among the children may, however, be questioned, since just by focusing on them will make them report a higher feeling of security. Moreover, these findings are based on focus group discussions and thus difficult to generalize to all the 130 children in the study.
3.2.4 Limitations
During the beginning of the trial, a number of technical problems were reported by the bus drivers such as wrong data displayed in the driver support system and failure with some tags that were not sending any signals to the bus stop. Consequently, those problems have created irritation and negative feedback about the system among the drivers. This has most truly influenced the drivers’ attitude in a more negative way compared to if everything worked from the beginning. However, it could be argued that this is not a realistic assumption to have for a new system. Another limitation is that the present study had too few observation units. Furthermore, the selection of the Nymö bus stop was shown not to be optimal, due to the regression to the mean effect.
The four underlying assumptions for the driver support system were all explored. However, this was a pilot study raising questions to be evaluated and solved in future studies, for example misuse and unintended use of the system. One tool, in this case the driver support system, can, most likely, not solve every situation. A holistic approach may be preferable. Parents, bus drivers, municipality should be educated within traffic safety thinking, in order to increase the understanding of children’s needs and limitations. Further studies are needed that apply such a holistic approach with focus on better ways to sign the bus and traffic safety education on the use of support systems for bus drivers, children, parents and relevant persons within municipality. Within the 7th Framework, the EU-project SAFEWAY2SCHOOL (FP7-RTD-1-233967; http://safeway2school.eu/) takes into account most of these issues. The project applies a holistic approach including bus stop inventory tool, education and training, bus driver support with rerouting, real time reallocation, signs on busses, signs at bus stops, and communication between children and the buses, bus stops and the relevant stakeholders on a municipality level. Also crash statistics, regulations and traffic laws are taken into account. Pilot trials will be performed at four different sites in Europe, testing the holistic approach in different ways.
References
TIS (2004) Road safety in School school transport. Brussels. Report No.: Directorate—General Energy and Transport H:\TISpt\Projecto\577-Roadsafety\Final Report\RSST_finalreport_v1.3.doc
Sörensen G, Anund A, Wretling P et al (2002) Trafiksäkerhet vid skolskjutsning—Slutrapport
Kostyniuk L (2003) Pupil fatalities on public transit buses: a comparison with school buses. J Public Transp 6:43–63
Newman S, Catchpole J, Tziotis M et al (2002) Review of the school bus safety action plan: final report. Report AP-R207/02. Austroads: Sydney. New South Wales. Australia
Scottish Executive Central Research Unit (ed) (2004) Child accidents en route to and from school. Colin Buchanan and Partners. Edinburgh, United Kingdom
Larsson J (2008) Skador i trafikolyckor med buss 2003–2006. Särskilt barns skolresor. Linköping. Report No.: VTI rapport 624
Carson JL, Holick A, Park ES et al (2004) Active advance warning devices show promise for school bus zone safety. Texas Transportation Institute. Project Summary Report 0-4749-S
Sörensen G, Anund A, Wretling P et al (2002) Trafiksäkerhet vid skolskjutsning Slutrapport (School Transport and Traffic Safety Final Report). VTI Linköping Sweden. VTI Rapport 480-2002
Falkmer T, Lövgren A, Anund A et al (2006) Säkerhet och trygghet i samband med skolskjuts—ur barnens perspektiv. Statens Väg och Transportforskningsinstitut, Linköping, Report No.: VTI rapport 548
Cohen M, Burkhart R, Dosi G et al (1996) Routines and other recurring action patterns of organizations: contemporary research issues. Ind Corp Change 5:653–698
Anund A, Larsson J, Falkmer T (2003) Skolskjutsbarns inblandning i olyckor 1994–2001. VTI, Linköping
European Commission Transport Road Safety. Road safety in school transport 2004. Report No.: Final Report of the EU-project Road Safety in School Transport (rsst_final_report_v1.3.pdf)
Anund A, Falkmer T, Hellsten H (2003) Skyltning av hållplats som används vid skolskjutsning Pilotförsök. Väg och Transportforskningsinstitutet, Linköping, Report No.: VTI rapport 494
Bruneau J-F (1999) Evaluation of two school bus advance signalling devices: the eight-light system and hazard lights. Quebec. Report No.: TP 13346E
Carson J, Holick A, Park E et al (2005) Development and evaluation of an active warning device for school bus loading and unloading points in areas of limited visibility. Texas Texas transportation institute Vollege Station; Report No.:??
Johnston S, Mazzae E, Riley W (1996) An evaluation of electronic pedestrian detection systems for school buses. Bus design: drivertrains, electronics, and safety. SAE, Warrendele, Report No.: SP-1199
King M (2000) Review of safe school travel (SafeST) initiatives: flashing lights at school zones and high visibility bus strips. Injury Prevention; Road safety 3RD 52-8
Anund A, Renner L, Falkmer T et al (2009) Smart Säker Skolskjuts—ett pilotförsök i Kristianstad. Linköping. Report No.: VTI report 649
Carlsson G (2004) Travelling by urban public transport: exploration of usability problems in a travel chain perspective. Scand J Occup Ther 11:78–89
Vägverket (2008) Utvärdering av 30-regel—försök med lagstadgad hastighetsbegränsning om 30 km/tim för fordon som passerar en stillastående buss. Borlänge. Report No.: Vägverkspublikation 2008:127
OECD (2008) Speed management—a road safety manual for decision-makers and practitioners. Geneva. Report No.: Global Road Safety Partnership
Anund A, Kronqvist L, Falkmer T (2005) Är kraven på utmärkning av skolskjutsfordon utmärkta? Linköping: VTI. Report No.: 516
Acknowledgment
The study was funded by Swedish Transport Administration (former Swedish Road Administration). The work was carried out in collaboration with Kristianstad Municipality, The Swedish Transport Administration (former SRA), the School of Health Sciences at Jönköping University and WSP Analysis & Strategy. The hardware and software were supplied by Volvo Bus Corporation, EvoBuss and Setra, Fleetech AB, Amparo Solutions AB, Volvo Bus Corporation, EvoBus and Zetra.
Open Access
This article is distributed under the terms of the Creative Commons Attribution Noncommercial License which permits any noncommercial use, distribution, and reproduction in any medium, provided the original author(s) and source are credited.
Author information
Authors and Affiliations
Corresponding author
Rights and permissions
Open Access This article is distributed under the terms of the Creative Commons Attribution 2.0 International License (https://creativecommons.org/licenses/by/2.0), which permits unrestricted use, distribution, and reproduction in any medium, provided the original work is properly cited.
About this article
Cite this article
Anund, A., Dukic, T., Börsbo, B. et al. Piloting smart safe school bus: exploration of security gains from implementation of a driver support system, additional technical equipment and intelligent bus stops. Eur. Transp. Res. Rev. 2, 157–163 (2010). https://doi.org/10.1007/s12544-010-0035-0
Received:
Accepted:
Published:
Issue Date:
DOI: https://doi.org/10.1007/s12544-010-0035-0