Abstract
Along the Swedish northwest coast, over 60% of the eelgrass meadows have been lost since the 1980s. Despite improved water quality, no recovery has occurred, and restoration is presently considered to mitigate historical losses. However, the factors preventing natural recovery of eelgrass are not known, and it is not clear if conditions would allow restoration. Here, we present the results from 5 years of field studies with the aim of identifying the key processes affecting eelgrass growth and survival at historical eelgrass areas. Continuous light measurements and comparison with historic eelgrass distribution indicate that maximum depth distribution has decreased locally with 1.5–2.3 m in areas that have lost large eelgrass beds in the last 10–30 years. Field studies suggest that wind-driven local resuspension of sediments that are no longer stabilized by eelgrass beds is the main cause behind the deteriorated light conditions. Field experiments show that a combination of low light condition and disturbance from drifting algal mats prevents eelgrass recovery in these areas, whereas the sulfide intrusion from the sediment and dislodgement of shoots by waves had little effect on growth and survival. These results suggest that local regime shifts acting on a scale of 40–200 ha have occurred after the loss of eelgrass beds, where increased sediment resuspension and proliferation of drifting algal mats act as feedback mechanisms that prevent both natural recovery and restoration of eelgrass. The feedbacks appear to be interacting and causing an accelerating loss of eelgrass that is presently spreading to neighboring areas.
Introduction
Seagrass meadows play a vital role for coastal ecosystems and provide valuable ecosystem services to society, including fish production, nutrient cycling, carbon sequestration, and coastline stabilization (Barbier et al. 2008; Unsworth et al. 2010; Fourqurean et al. 2012). However, like many coastal ecosystems, the areal distribution of seagrass is in rapid decline worldwide as a result of anthropogenic impact, and the loss rates are increasing (Waycott et al. 2009). The human activities considered most detrimental to seagrasses are those that alter water quality or clarity, e.g., sediment runoff, dredging, and nutrient pollution causing coastal eutrophication (Short and Wyllie-Echeverria 1996; Orth et al. 2006). Large and costly measures to decrease nutrient load to the coastal system have been implemented in many coastal areas, and even if these measures have improved the water quality, seagrass habitats have often failed to recover as predicted (Munkes 2005; Krause-Jensen et al. 2008; Duarte et al. 2009; Carstensen et al. 2011). To assist the recovery of seagrass, and also to mitigate losses caused by, e.g., coastal exploitation, restoration of seagrass meadows has been applied worldwide, and today, functional guidelines for restoration are available for many seagrass species (e.g., Fonseca et al. 1998; van Katwijk et al. 2009; Paling et al. 2009). Although there are several examples of successful restoration both on small and large spatial scales (e.g., Leschen et al. 2010; Orth et al. 2012; NOAA 2014), most restoration efforts have failed, with a global success rate of 37% for seagrass in general (van Katwijk et al. 2015). Many failures, however, are caused by selecting restoration sites with poor growth conditions, and the importance of careful site selection has been stressed (e.g., Short et al. 2002; van Katwijk et al. 2009; Leschen et al. 2010).
Recent studies suggest that the persistent lack of seagrass recovery and failure of many restoration efforts may in some areas be the result of a regime shift caused by a change in feedback mechanisms that keep the ecosystem in a new and stable state from which recovery can be difficult (reviewed by Nyström et al. 2012; Maxwell et al. 2016). According to these theories, ecosystems can absorb disturbances up to a threshold, or tipping point, where they shift rapidly into a new state that functions and responds to pressures differently. These nonlinear changes are driven by biological or physical feedback mechanisms, i.e., processes where the value of a state variable directly or indirectly affects the direction and the rate at which the same variable changes (Scheffer et al. 2001; Scheffer and Carpenter 2003). Because seagrass species are ecosystem engineers that strongly influence their physical and biological environment, positive (i.e., self-amplifying) feedbacks appear to be common in seagrass systems (Maxwell et al. 2016). For example, seagrass beds attenuate water flow and stabilize sediments, thereby reducing sediment resuspension and water turbidity, which improves light penetration and thereby the conditions for seagrass growth (e.g., van Katwijk and Hermus 2000; Moore 2004; Orth et al. 2012). Although there is a discussion if truly persistent, alternative stable states exist and how they should be defined, mounting evidence demonstrates that feedback mechanisms are important drivers of ecosystem dynamics, and pose one of the largest challenges for conservation and restoration (Suding et al. 2004; Nyström et al. 2012). A better understanding of the way human actions influence the strength and direction of feedbacks, how different feedbacks interact, and at what scales they operate are critical questions for successful management of seagrass ecosystems where more research is needed (Nyström et al. 2012; Maxwell et al. 2016).
Eelgrass (Zostera marina L.) is one of the most widely distributed species of seagrass in the northern hemisphere and the dominating species of the temperate North Atlantic (den Hartog 1970; Short et al. 2007). It is a foundation species in shallow coastal areas, where it provides many important ecosystem functions and services to humans, such as fish production and uptake and long-time storage of carbon and nitrogen (Short et al. 2000; Orth et al. 2006; Cole and Moksnes 2016). Similar to other seagrass species, large losses of eelgrass have occurred in many areas, including Northern Europe (Giesen et al. 1990; Kruk-Dowgiallo 1991; Baden et al. 2003; Fredriksen et al. 2004; Munkes 2005; Boström et al. 2014). Transplantation of eelgrass has been used successfully in restoration and mitigation projects in the USA since the 1940s, and it is becoming acceptable as a management tool to improve coastal ecosystems in many parts of the world (Fonseca et al. 1998; Paling et al. 2009; NOAA 2014), although the success rate of restoration projects is still low in Northern Europe (Cunha et al. 2012).
Along the Swedish NW coast, over 60% of eelgrass meadows have been lost since the 1980s (Baden et al. 2003; Nyqvist et al. 2009), equivalent to a loss of approximately 125 km2 eelgrass (Cole and Moksnes 2016). The losses have largely been attributed to the effects of coastal eutrophication and overfishing of large predatory fish, causing an increase in ephemeral macroalgae that cover the eelgrass meadows (Moksnes et al. 2008; Baden et al. 2010, 2012). A successful effort to reduce nutrient loading over the past 20 years has improved water quality in many coastal areas (Moksnes et al. 2015), but no recovery of eelgrass coverage has been observed (Nyqvist et al. 2009). Methods and guidelines to restore eelgrass at high latitude environments (ca 58° N), where the short growing season, ice scouring, and muddy sediments pose additional challenges for restoration, have recently been developed (Eriander et al. 2016; Infantes et al. 2016a; Moksnes et al. 2016), and national managers are presently planning large-scale restoration of eelgrass habitats along the Swedish NW coast to compensate for historical losses (SwAM 2015). However, it is presently unclear if the lack of eelgrass recovery in this area is caused by (1) a limitation in natural dispersal and recruitment of eelgrass, (2) continuing disturbance resulting from eutrophication and overfishing, and/or (3) if regime shifts have occurred in areas that have lost large eelgrass beds (> 10 ha) where unknown feedback mechanisms prevent the recovery of eelgrass. A number of feedback mechanisms with negative effects on seagrass have been suggested in the literature, including hydrodynamics and sediment stability affecting light conditions and erosion (e.g., van der Heide et al., 2007; Nyström et al. 2012), trophic cascades affecting epiphytic algae and shelter for mutualistic fauna (e.g., Maxwell et al. 2016), competition for space by burrowing animals and drift algae (e.g., Philippart 1994; Canal-Vergés et al. 2014), and sediment sulfide toxicity (e.g., Maxwell et al. 2016). Identification of feedbacks likely to affect seagrass growth is therefore considered critical for successful restoration (Maxwell et al. 2016). Along the Swedish west coast, eelgrass grows subtidally in monospecific meadows (Boström et al. 2003), usually in sheltered areas with muddy sediments high in organic content (10–25%; Jephson et al. 2008) and with the presence of glacial marine clay. Earlier studies suggest that seagrass growth may be negatively affected by high content of organic material and silt and clay in the sediment, due to the presence of toxic sulfides and limited porewater and oxygen exchange (reviewed by Koch 2001). Sulfide intrusion into seagrasses has been directly linked to seagrass decline (Frederiksen et al. 2007, 2008) and is thought to be important also for the loss of eelgrass along the Swedish NW coast (Holmer et al. 2009), but little is known if it poses a problem during restoration.
The aim of the present study was to assess the environmental conditions for eelgrass growth in an area along the Swedish NW coast targeted for large-scale restoration to possibly find areas where restoration can be recommended, to identify processes and possible feedback mechanisms that may prevent recovery of eelgrass and assess if regime shifts may have occurred, and to develop site-selection criteria for eelgrass restoration in Sweden.
Methods
Study System
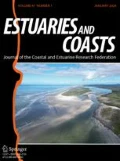
The area primarily targeted for eelgrass restoration in Sweden is located along the southern part of Swedish NW coast, inside the island of Marstrand, from the Nordre River in the south to the city of Stenungsund in the Hakefjord in the north (from here on referred to as the Marstrand area; Fig. 1). This area is affected by freshwater outflow from the Nordre River, which is mainly transported north, resulting in a salinity gradient from on average 6 close to the river mouth, to on average 18 in the northern part of the study area. The area consists of three catchment areas (Sälöfjord, Älgöfjord, and Hakefjord; Fig. 1), which according to the EU Water Framework Directive classification had moderate ecological status in 2009, mainly due to elevated levels of chlorophyll a and low Secchi depth, whereas nutrient levels in the water column had good status (WISS 2015).

Study area. Map of the study area along the Swedish NW coast showing the nine study sites in the Marstrand area (sites 1–9) and the three control sites in the Stigfjord (site 10) and the Gullmarsfjord (sites 11–12). The monitor station for environmental data in the Älgöfjord is marked with a blue dot. Black numbers mark study sites where eelgrass is present today, while red numbers mark areas that have lost large eelgrass beds (historic sites). The letters H mark the harvest sites for eelgrass shoots in the Gullmarsfjord and the Hakefjord
In the 1980s, the eelgrass beds on the mainland side of this area were mapped, showing the largest known distribution of eelgrass along the Swedish NW coast with over 1050 ha eelgrass, including continuous meadows covering > 200 ha in the southern part. In 2000, inventories of eelgrass along the Swedish NW coast found that large losses had occurred, but that the losses varied along the coast (Baden et al. 2003). The largest losses were recorded in Sälöfjord and Älgöfjord in the Marstrand area where close to 800 ha had been lost (≈ 80% loss), whereas the eelgrass in the Hakefjord was less affected (≈ 20% loss). In comparison, < 5% of the eelgrass had been lost in the Gullmarsfjord area (Baden et al. 2003; Fig. 1). Additional inventories in 2003 and 2004 confirm the losses in the Marstrand area but indicated that the situation was stable with no continuing loss (Nyqvist et al. 2009). The reason why the losses of eelgrass had been more severe in the Marstrand area compared to other areas is not known, and it has not been clear if the environment today would allow natural recovery or restoration of eelgrass in the area.
Assessing Historical Changes
To determine the historic and present distribution of eelgrass in the Marstrand area, maps of the historic distribution of eelgrass (1980–2004) were obtained from the County Administrative Board of Västra Götaland, and field surveys using aquascope and snorkeling were carried out in 2010. Based on these initial studies, nine field sites were selected including six potential sites for restoration where eelgrass had been lost, and three reference sites which still contained small eelgrass beds (sites 1, 2, and 5; Fig. 1). This preliminary survey indicated that large losses of eelgrass had occurred in the area since 2004, motivating a thorough study of historical changes in environmental conditions and eelgrass distribution in the area.
Changes in Water Quality
To investigate trends in the water quality close to the study sites in the Marstrand area, data from the regional marine environmental monitoring program (Bohuskustens vattenvårdsförbund) were collected from the national data host for marine environmental data (SHARKweb, Swedish Meteorological and Hydrological Institute, SMHI). Data from the monitoring station Instö Ränna was used (N 57° 54.07, E 11° 40.00), which has been sampled monthly for chemophysical variables since 1986. This is the only regional monitoring station in the Marstrand area, and it is located in the Älgöfjord, less than 2 km from sites 4 and 5 (Fig. 1). To assess temporal changes in water quality, linear regression analyses were carried out testing the average values of total nitrogen (total-N), dissolved inorganic nitrogen (DIN), chlorophyll a (Chl-a), and Secchi depth over the growth season for eelgrass (April–September) as a function of time (1986–2015).
Assessing Changes in Water Clarity and Eelgrass Depth Distribution
To estimate the changes of water clarity at five sites where large eelgrass beds had been lost (sites 3, 4, 6, and 7–8; Figs. 1 and 3), historic maps of eelgrass distribution and field measurements of bottom depths were used to approximate maximum depth distribution (Dmax) of eelgrass in the 1980s. Since eelgrass is presently missing at these sites, the historic Dmax were subsequently compared to the present estimated Dmax based on measured light attenuation in the water at the five sites 2011–2015 (see below) and the assumption that eelgrass on average requires 20% of the surface light in order to survive (Dennison et al. 1993; Duarte et al. 2007). In the Hakefjord, the historic eelgrass bed covered both sites 7 and 8, and data were only used from the deeper site 8 to get a better estimate of the light conditions at deeper areas.
Assessing Recent Changes in Eelgrass Areal Distribution
Since observations indicated that new, large losses of eelgrass had occurred since 2004, eelgrass was mapped in the study area in August of 2015. To be able to compare with earlier studies, the same methods, surveying eelgrass distribution from a boat using aquascope and GPS, were applied, where the boundary condition for a meadow was determined as the area where eelgrass covered more than 5% of the bottom (see Baden et al. 2003; Nyqvist et al. 2009 for details). Maps of eelgrass distribution and changes compared to 2004 and the 1980s were created using the Geographical Information System (GIS) program Arc View. The survey was carried out in collaboration with County Administrative Board of Västra Götaland.
Evaluation of Potential Restoration Sites
To assess the present conditions for eelgrass restoration in the Marstrand area, and to investigate which factors affect eelgrass growth today, monitoring of water quality variables, sampling of sediment, and test planting of eelgrass were carried out at nine sites 2011–2015.
Monitoring and Test Planting 2011–2015
In 2011, six sites in the southern part of the study area (Sälöfjord and Älgöfjord) were investigated from early May to November. Three of the sites had suffered a complete loss of large eelgrass beds and constituted potential restoration sites (sites 3, 4, and 6) and three sites had smaller beds of eelgrass remaining (although severely reduced compared the distribution in the 1980s) and served as reference sites (sites 1, 2, and 5). The large eelgrass beds at sites 3 and 6 were lost before 2000, whereas the bed at site 4 was present in 2000–2004, but no eelgrass could be found during surveys in 2010 (Fig. 1, see Supplementary Information and Table S1 in Online Resource 1). At sites with lost eelgrass, the sampling and test planting were carried out in the approximate center of the historic distribution of the eelgrass, at 2.3 to 2.5 m depth. At sites with eelgrass, sampling and test planting were carried out just outside (2–10 m) the existing eelgrass beds at 1.2 to 3.2 m depth (Table S1).
At all sites, light intensity (lm m−2) and temperature were continuously measured (at 15 min intervals) at two depths using loggers (Hobo, UA-002-64, Onset) placed approximately 20 and 120 cm above the bottom. The data was converted to PAR by calibrating against simultaneous measurements using a quantum sensor (MQ-200, Apogee Instruments) that were taken biweekly, when the loggers were also cleaned from fouling. The difference in PAR values between shallow and deep light loggers was used to calculate the attenuation coefficient (Kd) of light (Dennison et al. 1993) for each site at each measurement point and as a mean value throughout the growth season for the planted eelgrass. The percent surface light reaching the mean depth of each planting site was calculated as a daily and seasonal average for each bay based on the Kd values. The theoretical maximum depth distribution (Dmax) was calculated in the same way, based on the assumption that eelgrass on average requires 20% of the surface light in order to survive (Borum 1983; Dennison et al. 1993). Salinity was measured (at 15 min intervals) at three sites (1, 3, and 6) using conductivity loggers (Hobo, U24-002, Onset). Once a month (May to October), integrated water samples for analyses of chlorophyll a and turbidity (total suspended solids (TSS) and volatile suspended solids (VSS)) were collected from 0 to 2 m depth each site, using a 2-m-long tube. A volume of 1 L from each sample was filtered on to a precombusted glass-fiber filter (Whatman GF/F). The chlorophyll a concentration (Chl-a; μg L−1) was determined spectrophotometrically by measuring the absorption at 664, 647, and 630 nm according to Jeffrey and Humphrey (1975). The TSS (mg L−1) and VSS (mg L−1) were determined after drying at 105 °C and after combustion at 550 °C, respectively. Sediment composition in each bay was determined in the top 9 cm of the sediment, collected with a 3-cm-wide sediment corer (n = 3). Grain size analysis was measured by wet sieving, while organic content (loss on ignition (LOI); %) was determined as weight loss of dry sediment after combustion (5 h, 520 °C).
To assess the conditions for eelgrass growth, a smaller test-planting study was also carried out. Eelgrass was transplanted in the beginning of July 2011 using the plug method, where shoots are collected with a 15-cm Ø PVC corer, retrieving intact shoots and 10 cm of sediment (see Eriander et al. 2016 for details). The plugs were harvested in the Gullmarsfjord in a semisheltered bay at 1.5 m depth using diving and directly transported to the study sites (Fig. 1). During transportation, the plugs were kept inside the cores filled with seawater, which were held inside coolers until transplantation (maximum 6 h). Sediment plugs with shoots were planted at all six sites inside predug holes in the sediment surface. Two plugs were planted, 2 m apart at each site. The number of shoots was recorded monthly until November 2011.
In 2012, a larger test-planting study was carried out at the same sites to assess the effect of light and sediment characteristics, including the role of sulfide invasion for the growth of eelgrass. This year shoots were planted with the single shoot method (Orth et al. 1999) since studies in the Gullmarsfjord had shown higher lateral growth rate and survival of shoots planted with this method compared to the plug method (Eriander et al. 2016). Because of poor growth of planted eelgrass at references site 2, this area was not included in 2012. The shoot transplants were harvested by hand using diving in a 100-ha eelgrass meadow located in the Stigfjord (site 10, Fig. 1). This donor area has an apparently healthy eelgrass meadow and also constituted a control site for the study. Shoots were harvested in the beginning of June at 1.5–2.0 m depth and planted the same day at the six sites. At each site (including the control site), 12 replicate 0.5 × 0.5 m plots, separated by 1 m, were planted with nine single eelgrass shoots in each plot (equivalent of 16 shoots m−2). At all sites, light intensity and temperature were continuously measured with loggers, and sediment samples were collected, as described above. In addition, water samples were taken for sulfate analyses, and the sediment depth of dissolved sulfide in the porewater was measured using sticks of silver that were placed into the sediment in the field for 2 h. The presence of black precipitation of silver sulfide (Ag2S) indicates the presence of sulfide (Fossing et al. 1998). Once a month (July to September), shoots were counted in all plots, and eelgrass from two randomly selected plots were harvested for analyses of morphology, biomass, and sulfur content. Water and sediment samples for sulfate and harvested plants were kept on ice and frozen before analyses. A final shoot count was carried out in June 2013 to assess survival over the winter.
In the laboratory, above- and belowground biomass and leaf length and number of leaves per shoot were measured on the collected eelgrass. The water samples for sulfate analyses were prepared by boiling under acidic conditions followed by precipitation of sulfate with BaCl2 and BaSO4. The stable isotopic signal of sulfate (δ34S) was measured by elemental analyzer combustion, continuous flow isotope ratio mass spectroscopy by weighing the sample into tin capsules together with vanadium pentoxide. The stable isotopic signatures were reported in standard delta notation (units per mill, ‰). The international standard for δ34S (Canyon Diablo Troilite, a meteorite of FeS) was used as a standard zero point for expression of sulfur isotopes. The stable isotopic signal of sulfides (34S) in the sediment was obtained by retrieving the acid volatile sulfides (AVS) and chromium reducible sulfides (CRS) in the samples fixed with 1 M ZnAc (vol:vol) using the two-step distillation technique of Fossing et al. (1998). The precipitated Ag2S was filtered and packed in tin capsules with vanadium pentoxide and analyzed as described above for δ 34S sulfate. To assess sulfide intrusion in eelgrass, plant tissues (leaves, rhizomes, and roots) were analyzed for sulfur isotopic composition and total sulfur content. For the sulfur isotopic (δ34S) and total sulfur (TS) analysis, ground leaf, rhizome, and root material was weighed into tin capsules together with vanadium pentoxide and analyzed as described above for δ34S sulfate. The percentage of sulfur in the plants originating from sediment sulfide (Fsulfide) was calculated according to Frederiksen et al. (2006). Studies have shown that an increase in TS and a decrease in δ34S reflect sulfide invasion in plants (see Holmer et al. 2009 for methods).
In 2015, three new potential sites were investigated in the Hakefjord in 2015 (sites 7–9; Fig. 1) because of the poor growth of planted eelgrass in the potential restoration sites in Sälöfjord and Älgöfjord in 2011 and 2012. These sites had large eelgrass beds in 2004 (Nyqvist et al. 2009), which could not be found during initial surveys in June 2015. Relatively shallow planting depths were chosen at the sites (1.4–1.8 m) since observation of plumes of turbid water indicated issues with water clarity. The shoots were planted with the same methods as in 2012, but only 3 plots per site were used. At all sites, sediment samples were collected and light intensity and temperature were continuously measured with loggers as described earlier. Shoots were harvested in June from a large eelgrass meadow on the western side of the Hakefjord and planted within hours after harvest (Fig. 1). Shoot density was measured monthly until September.
Statistical Analyses
To test if growth and sulfur content of planted shoots differed between sites in 2012, number of shoots per plot in September, average number of leaves per shoot, and percentage of sulfur in the plants originating from sediment sulfide (Fsulfide) in leaves, rhizome and roots per plot (average values July–August) were used as dependent variables in one-factor ANOVA models with site (1–6) as independent variable. Number of leaves per shoot was analyzed since earlier studies suggest that it may indicate light stress in eelgrass (Carr et al. 2012) and could therefore potentially be used as an indicator of the health condition in planted eelgrass. To assess if sulfide intrusion affected growth of eelgrass, and also to test if the number of leaves per shoot could predict the growth, simple linear regression analyses were carried out using Fsulfide measured in July and the number of leaves per shoot measured in August as independent variables and the number of shoots in September as the dependent variable. Homogeneity of variance was tested using Cochran’s C test (Sokal and Rohlf 2011) and heteroscedastic data was square root transformed to meet assumptions of homogeneity. Multiple comparison post hoc tests were performed using the Student–Newman–Keuls (SNK) procedure.
To assess how light and sediment characteristics affect lateral shoot growth in test-planted eelgrass, a series of analyses were performed using all data from test plantings in the Marstrand area (2011–2015), including also data from two “control” sites in the Gullmarsfjord (sites 11–12; Fig. 1) where shoots were planted at two depths in 2011 using the same method and density as in the present study (Eriander et al. 2016). Simple linear regression analyses were carried out using light intensity at the planting depth (percent of the light at the surface), percent silt and clay in the sediment, and percent organic content (LOI) in the sediment, as independent variables, and the percent lateral shoot growth in September as the dependent variable. To test how sediment characteristics correlated with water clarity at the different sites, analyses were performed using percent silt and clay, and organic content in the sediment as the independent variable and light attenuation in water (Kd) as the dependent variable.
Assessing Factors Preventing Eelgrass Growth
Field Survey Assessing Sediment Resuspension
Field studies 2011–2012 indicated that wind- and wave-driven sediment resuspension may affect the water quality in areas that have lost large eelgrass beds. To test this hypothesis, a field survey was carried out at site 6 in 2013 to test how wind events and concentration of Chl-a correlated with turbidity and light conditions in the bay. A fluorometer (C3, Turner Designs) measuring Chl-a and turbidity every 15 min was deployed in the middle of the bay at approximately 2 m depth, close to the test-planting site 2011–2012. Light intensity was measured using loggers as described in earlier studies. The loggers were deployed for approximately 4 weeks from August 9 to September 5, 2013. Wind data (average velocity and direction at 60 min intervals) from the closest national marine weather station (Vinga), located approximately 30 km south of the field site, were obtained from the Swedish data host SMHI.
Field Experiment Assessing Effects of Light, Wave Exposure, and Drift Algae
To assess how light, drifting algal mats, and dislodgments of plants by waves affect growth and survival of eelgrass in areas that have lost large meadows, and to possibly find methods that can improve restoration success in these areas, a field experiment was carried at three of the sites were large losses have occurred (sites 3, 4, and 6; Fig. 1) in 2014–2015. At each site, shoots were planted in 1 m2 plots, along 2 to 3 depth transects (1.0–2.0 m), and subjected to three planting treatments: (1) unanchored single shoots (control), (2) single shoot anchored in the sediment by pushing a v-shaped bamboo skewer over the rhizome (Davis and Short 1997; anchor), and (3) unanchored single shoots protected by a 40-cm tall fence without a top (fence). The fences were constructed of 4.0 × 0.5 m plastic net (1.5 cm mesh) that was dug 10 cm into the sediment, and supported by fiberglass rods in each corner. Each experimental plot was separated with 2 m and planted with 16 single shoots, evenly spread in the plot. Three replicate treatments were planted along each depth transect in an orthogonal experimental design (Table 1). At sites 4 and 6, the effect of transplant origin was also assessed, by including “origin” as an additional orthogonal factor in the experiment, comparing shoots collected in a semi-exposed bay in the Gullmarsfjord and a protected bay in the Hakefjord (Fig. 1; n = 3).
The plots were sampled in July and September and after the winter in May 2015 when shoot density was measured. Presence of drift algae was noted and coverage measured when present in plots. Densities of adult shore crabs (Carcinus maenas) and lugworms (Arenicola marina) were also counted in the plots as they may disturb planted eelgrass (Philippart 1994; Davis et al. 1998). Sediment samples were collected from each transect, and light and temperature were measured continuously as described for earlier studies. Number of shoots per plot was analyzed as the dependent variable in two- and three-factor ANOVA models using planting treatment, depth, and origin (sites 4 and 5) as independent variables for each site and month (July and September) separately. No statistical analysis was carried out on the data collected in May 2015 due to very low survival.
Results
Assessing Historical Changes
Linear regression analyses of regional monitoring data of water quality between 1986 and 2015 (average values April–September) showed a significant decrease of total nitrogen (total-N) during the growth season for eelgrass (April–September) and a nonsignificant trend of decreasing dissolved inorganic nitrogen (DIN), but no clear changes in chlorophyll-a concentration or Secchi depth over the monitoring period (1986–2015; Table 2, Fig. 2). Average Secchi depths during the growth season for eelgrass have varied between 3.7 and 5.8 m since 2000 (on average 4.6 m) at the monitoring station and show no tendency of decreasing over the monitoring period (Fig. 2).

Regional monitoring data. Changes in seasonal averages (April–September) of organic and inorganic nitrogen concentration (total-N), chlorophyll-a concentration (Chl-a), and Secchi depth at the monitoring station Instö Ränna 1986–2015. The trend line denotes a significant decrease of total-N over the study period (Table 2)
Estimates of the historic depth distribution of eelgrass at the four areas that had lost large beds of eelgrass (sites 3, 4, 6, 8; Fig. 1) were 3.4–4.0 m in the 1980s (Table 3). Light measurements at these sites 2011–2015 suggest that eelgrass today can only survive down to 1.7–2.0 m. Assuming that the attenuation of light is the same at 3.4–4.0 m depth as at the measured depth (1.6–2.5 m), these results suggest that the water clarity has decreased with 1.5–2.3 m in these shallow bays since the 1980s (Table 3), equivalent to an average increase in light attenuation (Kd) from 0.45 to 0.87 since the 1980s.
Mapping of eelgrass beds in the Marstrand study areas 2015 revealed that large losses of eelgrass had occurred in the area since 2004. In total, the distribution of eelgrass has decreased with approximately 288 ha, equivalent to a 79% loss of eelgrass in comparison with the coverage in 2000–2004. Today, only about 75 ha of eelgrass remains in the area, consisting mainly of highly fragmented small meadows (Fig. 3). The proportional loss is largest in the Sälöfjord and Älgöfjord area where 90% of remaining eelgrass has vanished since 2004, and less than 2% remains of the eelgrass distribution in the 1980s. However, the largest areal loss had occurred in the Hakefjord area (208 ha), which was relatively unaffected in 2004, but where only 23% (62 ha) of the meadows remain today in comparison with the 1980s.

Changes in eelgrass distribution 1981–2015. Map showing the distribution of eelgrass in the Marstrand area mapped in the early 1980s, 2000–2004 (Baden et al. 2003; Nyqvist et al. 2009), and 2015 (this study). Colored areas denote areas where eelgrass covered ≥ 5% of the bottom 1981–2015. Areas with eelgrass from later inventories are placed on top of older ones. All areas mapped in 2015 overlap with earlier inventories, and a large majority of the areas mapped in 2000–2004 overlap with areas from 1980s. The enlarge sections with sites 4–5 and 7–8 include areas with the largest losses of eelgrass since 2004
Evaluation of Potential Restoration Sites
Monitoring of water variables once a month at the six sites in the Sälöfjord and Älgöfjord in 2011 showed only moderately elevated levels of Chl-a at the sites (on average 2.7–4.5 μg L−1), whereas levels of TSS were high at most sites (on average 6.5–15.2 mg L−1) where a majority of the suspended solids consisted of inorganic particles (75–79%; see Supplement Information with Table S1 in Online Resource 1). Salinity varied between 0 and 19 (on average 6.0) at site 1 close to Nordre River and between 8 and 24 (on average 17.0) at site 6 in Älgöfjord.
Analyses of sediment variables in the Marstrand area showed relatively high levels of organic material (2.5–7.5%) and silt and clay (33–77%) at the six sites where eelgrass beds have been lost. At sites where eelgrass was still present, the organic content was similar or higher (2.4–11.0%) and the percentage of silt and clay generally lower (30–53%; Table S1, Fig. 1). Dissolved sulfides in the porewater appeared to be low at most sites as silver stick measurements indicated that sulfide was not present in the top 7 cm of the sediment at all sites except at sites with larger eelgrass beds (site 5 and the control site 10), where sulfide was present from 3.5 to 0.5 cm depth, respectively; Table S1).
Continuous light measurement during the growth season for eelgrass in the Marstrand area in 2011–2015 indicated high light attenuation at all sites that had lost large eelgrass beds, with Kd values generally above 0.80, and the light at the bottom at test-planting depth was generally below 20% of the surface light. In contrast, light at the bottom in areas where eelgrass was still present was on average higher than 20% of the surface light (Table S1).
The low light conditions were reflected in very poor growth of planted eelgrass in areas that had lost large eelgrass beds. In 2011, the smaller test-planting study showed negative growth at all sites that had lost eelgrass, where all plants were gone already after 1 month at site 3, but positive growth on sites with eelgrass (see Fig. S1 in Online Resource 1 for detailed results). In 2012, the larger test-planting study demonstrated a similar result with a positive growth at all sites with natural eelgrass and a complete loss of shoots at the historic eelgrass sites 3 and 6 by September. However, this year, a positive growth was found at site 4, an area where eelgrass bed was lost after 2004 (Fig. 4a). Sampling the following spring showed high survival and growth at all sites that displayed positive growth the previous fall, except at site 5 where a thick mat of drifting macroalgae (mainly the brown algae Fucus serratus and Saccharina latissima) covered the planting plot, which were likely responsible for the mortality of transplanted shoots.

Test planting of eelgrass 2012. a Average numbers (+SE) of shoots planted with the single shoot method in June 2012 at five different sites in Sälöfjord and Älgöfjord of the Marstrand area and at the control site 10 (C) in the Stigfjord, and sampled until June the following year. Sites 1, 5, and 10 have existing eelgrass and the remaining sites are located within historic eelgrass meadows (see Fig. 1). Average numbers of b leaves per eelgrass shoot sampled in August and c average percent of sulfur in the leafs originating from sediment (Fsulfide) sampled in July and August at the six sites. Different letters above bars denote significantly different means at p < 0.05 (SNK test). The dotted lines denote the values at planting
Measurements on plants collected in July and August 2012 indicated that the shoots were stressed at the sites without natural eelgrass beds, where the number of leaves, leaf length, and aboveground biomass had decreased with 35–50% in comparison to the values during planting. In contrast, the morphology of shoots planted in areas with eelgrass (sites 1 and 5 and the control site 10) changed very little. The average number of leaves per shoot was significantly lower at the historic eelgrass sites 3 and 6, in comparison to the other sites (Fig. 4b, Table 4). Comparing the number of leaves per shoot in August with the lateral shoot growth in September revealed a significant positive relationship (Table 5). However, the results showed a nonrandom distribution of residuals, indicating a curvilinear relationship. The analyses of leaf number were therefore repeated using log-transformed data of shoot growth, which showed a better fit and where the number of leaves in August explained 61% of the variation in subsequent growth between plots and sites (Table 5; see Fig. S2 in Online Resource 1 for details).
Analyses of isotopic sulfur in the plants showed a higher sulfide intrusion at sites with sulfide present in the porewater, but no negative effects on growth rates. The percentage of sulfur originating from sediment sulfide (Fsulfide) was significantly higher in the leaves in July and August from shoots planted at site 5 (with eelgrass) and at the control site 10 in comparison with the other sites (Fig. 4c; Table 4). Comparing the Fsulfide in July with the lateral shoot growth in September among the different sites showed a significant positive relationship (Table 5; Fig. S2).
Analyzing the data from all test-planting studies (2011–2015) suggests that available light at the bottom and grain size of the sediment were the most important variables explaining eelgrass growth. Simple linear regression analyses demonstrated that lateral shoot growth of planted eelgrass showed a significant positive correlation with the light at the planting depth (percent of the light at the surface) and a significant negative correlation with percent silt and clay in the sediment, explaining 62 and 59% of the variation in growth at the different sites and years, respectively. In contrast, the organic content in the sediment did not correlate significantly with eelgrass growth (Table 6, Fig. 5). The percent silt and clay in the sediment also showed a significant positive correlation with the measured light attenuation in the water, indicating that the effect on growth may be indirect by affecting water clarity. No correlation was found between the organic content in the sediment and light attenuation (Table 6, see Fig. S3 in Online Resource 1 for details).

Test planting. Relationship between the percent lateral shoot growth of eelgrass planted at 12 different sites along the Swedish NW coast 2011–2015, and the average seasonal light (May–September) at the planting depth (percent of the light at the surface), the percent silt and clay in the sediment, and the percent organic content in the sediment (LOI) at the different areas. The data are separated into areas where eelgrass was present or lost at the time of planting. Trend lines show significant linear relationships (Table 5)
Assessing Factors Preventing Eelgrass Growth
Field Survey Assessing Sediment Resuspension
In the field survey, light conditions at 2 m depth were typically around 20–30% of the surface irradiance during days with calm weather conditions when turbidity was low (< 5 NTU). However, during moderate wind events (winds 5–8 m s−1), which occurred 3 times during the 4-week monitoring period, turbidity increased to 10–20 NTU, and light intensity at the bottom decreased to below 10% of surface irradiance for 1–2 days (Fig. 6). The effect of wind on turbidity and light was particularly evident during a stronger wind event (up to 15 m s−1) from the west (which has the largest fetch at site 6) on August 31 to September 2. During this period, turbidity peaked to around 80 NTU, and light intensity at the bottom dropped to close to zero for 3 days (Fig. 6). During the whole monitoring period, levels of Chl-a concentrations were relatively low and stable around 2–4 μg L−1, suggesting that the increased turbidity was caused by wind-driven resuspension of bottom sediment.

Wind effects on turbidity, light, and Chl-a at site 6 in 2013. During a moderate wind event on August 29, turbidity increases to over 15 NTU and light intensity at 2 m depth decreased to around 10% of the surface irradiance for 2 days. During a stronger wind event on September 1, turbidity peaked to around 80 NTU and light intensity at the bottom decreased to close to zero for 3 days. Levels of Chl-a remained relatively stable around 2–4 mg L−1 during the whole period
Field Experiment Assessing Effects of Light, Wave Exposure, and Drift Algae
The field experiment demonstrated that planted eelgrass only survived in very shallow habitats when they were protected inside fences that excluded drift algae. No significant effect of anchoring was found at any time, and no consistent effect of origin of the transplants was observed. The results suggest that poor light condition and drifting algal mats together prevent eelgrass recolonization in areas where large meadows have disappeared, whereas dislodgement of shoots from waves and currents is not an important factor in the assessed areas.
At site 3, a significant effect of planting depth was seen already 1 month after planting in July, when shoot density had increased at 1.2 m depth, but decreased at 1.6 m depth in all treatments. No significant effect of fencing was found in July (Fig. 7, see Table S2 in Online Resource 1 for ANOVA results). In September, large amounts of drifting macroalgae (mainly consisting of Fucus serratus and Furcellaria lumbricalis) had moved into the study area and covered many plots without fences, and a significant positive effect of fencing was found at both depths. No algae were found in any plots with fences. At 1.2 m depth, shoot densities had remained high in fenced plots but decreased significantly in the other treatment. At 1.6 m, densities had continued to decrease in all treatments, but less so in the fenced plots (Fig. 7, Table S2). After the winter in May 2014, a high number of shoots were still found in the fenced treatment at 1.2 m depth (on average 11 shoots m−2), but very few were found in shallow treatments without fences. No shoots remained in any treatment at 1.6 m depth.

Field experiment 2014–2015. Average numbers of eelgrass shoots (+SE) planted in June 2014 with three different treatments (unanchored controls, unanchored shoots inside fenced area, shoots anchored with a bamboo stick) at 2–3 depths at three different sites in the Marstrand area and sampled in July, September, and May 2015. Dotted lines denote the number of shoots planted per plot in June
At site 4, no significant effect of planting depth or origin of the transplanted shoot was found at any time, but shoot densities were significantly higher in the fenced plots, where shoot densities had increased in July, compared to the other treatments where densities had decreased. In September, densities had decreased in all treatments, but more so in the treatments without fences, many of which were covered by thick mats of drifting macroalgae (mainly F. serratus and F. lumbricalis) under which dead or dying eelgrass shoots were found. Under some algal mats, white sulfur bacteria (Beggiatoa sp.) had formed indicating anoxic conditions. No algae were found in any plots with fences, where the eelgrass appeared healthy. After the winter in May 2014, only a few shoots remained in a couple of plots, and most plots, including fenced treatments, were covered with drift algae, likely a result of winter storms lifting the algae over the fences at this more exposed site (Fig. 7, Table S2). Wet weight of algae in the plots was up to 5 kg m−2.
At site 6, no positive growth of eelgrass was found in any treatments, and a significant negative effect of planting depth, positive effect of fencing, and higher survival in shoots from the exposed site compared to the sheltered site were found already in July. No significant effect of anchoring was found at any time. In September, large losses had occurred in all treatments, and surviving shoots were mainly found in the fenced plots, where densities were significantly higher compared to the other treatments, and where shoot density decreased significantly with depths. Because of very few survivals in treatments without fences, particularly for shoots with the origin from the sheltered site, the depth and fence effects were weaker in these treatments, causing significant treatment × depth and depth × origin interaction effects (Fig. 7; SNK test at p < 0.05; Table S2). No surviving shoots were found after the winter in May 2014. Large mats of drift algae were not observed at site 6. Lugworms were only observed at site 6, but at only at 1–1.5 m depth at moderate densities (on average 6.1 worms m−2). Shore crabs were observed at all sites and treatments (also inside fenced plots), but at moderate and similar densities at the three sites (on average 0.3–0.4 crabs m−2).
Discussion
Seagrass meadows are disappearing at an alarming rate worldwide, and despite improving water quality in many areas, natural recovery has been limited and many restoration efforts have failed (Waycott et al. 2009; Duarte et al. 2009; van Katwijk et al. 2015). Recent studies suggest that since seagrass meadows strongly influence their physical and biological environment through positive feedback mechanism, the interruption of such self-generating processes may cause rapid shifts into a new regime where new feedback mechanisms make recovery very difficult (Nyström et al. 2012; Maxwell et al. 2016). The present study supports these ideas and suggests that the lack of natural recovery of lost eelgrass beds along the Swedish NW coast is not caused by recruitment limitation, or by continuing disturbance from eutrophication, but is caused by local regime shifts in areas that have lost large eelgrass beds, where high turbidity and disturbance from drift algae presently prevent eelgrass growth. The results suggest that the regime shifts have occurred on the scale of individual bays (40–200 ha) where increased wind-driven sediment resuspension and proliferation of perennial algal mats act as important self-amplifying feedback mechanisms that make restoration of eelgrass very difficult. Moreover, these disturbances appear to be spreading to neighboring areas, causing an accelerating loss of eelgrass in the study area. The results have important implication for a successful management and restoration of eelgrass in Scandinavian waters and suggest that a combination of measures on both regional and local scales will be necessary for eelgrass recovery.
Local Regime Shifts and Multiple Feedbacks
Test planting of eelgrass shoots over multiple years at six sites in the Marstrand area at sites and depths where large historic eelgrass meadows (39–214 ha) were found 10–30 years ago revealed very poor growth and survival of eelgrass. At these historic sites, shoots showed strong signs of stress with no lateral growth and decreasing number of leaves per shoot, and most of the planted eelgrass perished within months. The results from the correlative field studies and field experiments suggest that poor light conditions were the major reason for the low survival in these areas. In contrast, test planting at sites with existing eelgrass beds in the Marstrand area showed high growth and survival over multiple years and in general good light conditions, although these areas were only kilometers away from the historic sites with poor growth. These results suggest that the deterioration of the water quality in areas that have lost large beds of eelgrass is driven by processes acting on the local scale of the bay (i.e., 40–200 ha). This was supported by the analyses of changes in water quality at historic eelgrass sites, where the historic depth distribution of eelgrass was compared with light attenuation at the same sites today. These analyses suggest that the light attenuation in the water has doubled at these historic sites from 0.45 to 0.87 over the last 30 years and that the potential maximum depth distribution of eelgrass has decreased with on average 1.9 m. The dramatic change in water quality within these shallow bays differed from the trends in water quality variables monitored at deeper waters only some kilometers away from the study sites. Here, nitrogen concentrations in the water has decreased since the 1980s and Secchi depth has been constant or showing an increasing tendency over the same period. This is consistent with the general observation of improved water quality along the Swedish NW coast, where the load and concentrations of nutrients and Chl-a have decreased and Secchi depths have increased in many coastal areas (Anonymous 2016; Moksnes et al. 2015). Although the concentration of Chl-a in the study area (on average 2.7–4.5 μg L−1) is considered elevated in comparison with WFD-threshold value for good ecological status (SEPA 2007), these values are still low in comparison to suggested threshold values of Chl-a for eelgrass growth (> 15 μg L−1; Dennison et al. 1993). Moreover, average concentration of Chl-a at our sites did not seem to correlate with light attenuation or eelgrass growth (Table S1 in Online Resource 1). Thus, the dramatic drop in water quality at the sites where eelgrass has been lost appears not be related to a general decrease in water quality in the region, but to a local change of the environmental conditions.
The results from the field surveys monitoring turbidity, light, and wind conditions suggest that the high turbidity in these shallow areas today is mainly a result of wind-driven resuspension of the sediment, which has likely increased as a result of losing the stabilizing effect that eelgrass meadows have on the sediment conditions. Monitoring of total suspended solids in the water column at the study sites during relatively calm weather conditions showed surprisingly high levels (on average 8.6–15.2 mg L−1) where > 75% of TSS consisted of inorganic particles. The effect of wind-driven, sediment resuspension was very clear during stronger wind events at site 6, when turbidity peaked (approximately 80 NTU) and light conditions at the bottom dropped to near zero for several days (Fig. 6). However, the effect was also evident during relatively calm weather conditions in shallow areas where a slight breeze and small waves created plumes of gray water, which quickly decreased the visibility from 2–3 to < 0.5 m (see Fig. S4 in Online Resource 1). The surface sediment in the study area has a high content of silt and clay (30–77%), including glacial marine clay. Observations during field work showed that layers of glacial clay are exposed on the sediment surface in many areas that has lost eelgrass beds, likely because the layer of organic-rich sediment has eroded after the loss of the meadow. The observed plumes of gray water are likely a result of suspended clay particles. Thus, the water quality in areas with clay deposits close to the sediment surface may be extra sensitive to resuspension and may explain the dramatic decrease in water clarity in the study area since the 1980s. These suggestions were supported by a significant positive correlation between the percentage silt and clay in the sediment and the light attenuation in the water at different sites, explaining 34% of the variation in light. When excluding the data from site 1, next to the Nordre River where the water was affected by turbid water from the river, the silt and clay content of the sediment even explained ≈ 64% of the variation in light attenuation. In addition to affecting light attenuation, suspended sediment may also impact eelgrass growth negatively through sedimentation on the leaves, that may further decrease light available to the plants (Tamaki et al. 2002), and also affect gas exchange and oxygen concentrations in the plant (Brodersen et al. 2017), which may explain why the light requirement is higher for seagrasses that grow in turbid waters (Duarte et al. 2007). In addition, light requirements for eelgrass may increase as the sediment clay and organic content increase, although this mechanism is still not fully understood (Kenworthy et al. 2014). Such effects may explain the fast losses of transplanted shoots also in shallow waters where light conditions should not be limiting for growth (Fig. 7).
Taken together, these results suggest that local regime shifts have occurred at the sites that have lost large eelgrass beds, where hydrodynamics and sediment resuspension are acting as a feedback mechanism that prevents natural recovery of eelgrass and makes restoration very difficult. The positive effect of eelgrass meadows on water clarity is well documented in the literature. The canopy of the meadow attenuates water flow, and the mat of rhizomes and roots stabilizes the sediment, which together decrease sediment resuspension and water turbidity and improve light penetration and seagrass growth conditions (e.g., van Katwijk and Hermus 2000; Moore 2004; Orth et al. 2012; Hansen and Reidenbach 2012). However, when meadow size and shoot density decrease below a critical threshold, sediment resuspension may become too high to allow seagrass growth, causing an accelerating loss of the remaining meadow, and preventing the return of a vegetated state (Fig. 8), as have been suggested for subtidal eelgrass meadows in the Dutch Wadden Sea (van der Heide et al. 2007, 2011).

Conceptual model (a) and schematic illustration (b) of self-amplifying feedback loops during the regime shift observed in NW Sweden, from a stable vegetated eelgrass state with high light conditions, to the stable sediment state with low light conditions when perennial drift algae dominate. In a, the green line shows the change in state variables of eelgrass (i.e., areal extent, biomass, shoot density) over time, and green arrows denote a positive feedback with a positive effect on eelgrass (i.e., sediment stabilization having a positive effect on light conditions). Small black arrows denote feedbacks with negative effects on eelgrass (sediment resuspension decreasing light conditions and drift algae shadowing and dislodging eelgrass). The black line shows the change in turbidity and algal cover over time. The red dotted line denotes the threshold in the eelgrass state variables where the feedbacks switch from self-generating positive to negative effect on light and eelgrass growth. The large black arrow indicates an external pulse disturbance (e.g., storm, filamentous algal bloom causing anoxia, dredging activities) decreasing the eelgrass state variables below the threshold and resulting in a regime shift from the eelgrass state to the sediment state with drift algae. In b, the feedback loops are illustrated during the stable eelgrass state (i), the transient stage after the feedbacks have switch to self-generating negative effect on light and eelgrass growth (ii), and during the stable sediment state with drift algae (iii). Drifting algal mats moving at the bottom increase the resuspension of sediment through physical abrasion, and increased turbidity facilitates for drift algae to enter meadows by decreasing growth and density of eelgrass, resulting in a self-generating interaction between the two feedback mechanisms
The strong negative impact from mats of drifting macroalgae, demonstrated in the field experiment, suggests that they may act as an additional important feedback mechanism by competing for space with eelgrass in areas that have lost meadows. These mats consist of large, perennial species of brown and red algae (dominated by F. serratus and F. lumbricalis) that normally grow on hard substrate, but that appear to grow well also in this free-drifting form. The mass occurrence of these algal mats has not previously been described from the Swedish west coast, but they appear to thrive in areas previously occupied by eelgrass. Estimates from aerial photographs and field measurements suggest that approximately 90 ha of algal mats cover the bottom at site 3, close to half of the area previously occupied by eelgrass, with an average biomass of 328 g DW m−2. In areas with large and dense eelgrass meadows, smaller algal mats are mainly found at the edges of the meadows, which appear to function as a barrier for the drifting algae, resulting in apparent limited negative effects on the meadow (Fig. 8). However, if the density of the eelgrass meadow decreases, the algal mats may be transported into the meadow by currents and waves, where it can lead to mortality of shoots (e.g., through shading, uprooting, or by creating anoxic conditions at the bottom). Algal mats were regularly observed in the fragmented meadows that remain in the study area. These mats of drift algae, which move unpredictably with weather-driven waves and currents, pose a serious problem for natural recolonization of eelgrass and make restoration very difficult in these areas. The results from the field experiment showed that planted eelgrass quickly perished, also in shallow areas with good light conditions, when they were planted without a fence that protected against drift algae. An increased problem from drifting perennial algae has also been reported from Denmark, in areas that have lost eelgrass. In the Odense fjord, field studies showed that drifting Fucus spp. plants attached to small stones explained 40% of seedling mortality through uprooting and burial (Valdemarsen et al. 2010), and model studies suggest that up to 96% of the fjord area may be negatively impacted by macroalgal drift (Canal-Vergés et al. 2014).
Thus, eelgrass recovery and restoration along the Swedish NW coast appear to be challenged by two strong feedback mechanisms—sediment resuspension and drifting algal mats—that effectively prevent eelgrass growth. These two feedbacks likely interact and enhance each other, as studies have shown that drifting algal mats increase the resuspension of sediment through physical abrasion (Canal-Vergés et al. 2010). Since the increased turbidity of the water can decrease the growth and shoot density of the eelgrass, while algae can tolerate lower light levels, it might in turn facilitate drifting algal mats to enter eelgrass meadows and take over the habitat (Fig. 8). The co-occurrence and interaction among feedbacks has largely been overlooked to date due to difficulties in analysis and detection but is critical to understand for successful management and restoration of seagrass ecosystems (Maxwell et al. 2016). In the study area, an interaction between sediment resuspension and drifting algal mats may explain why the loss of eelgrass is continuing despite decreased nutrient loads and improved water quality in many deeper coastal areas. The results show that losses of eelgrass have accelerated in the Sälöfjord and Älgöfjord area, where < 2% of the historic eelgrass coverage remains today, and have spread north into the Hakefjord where > 200 ha has vanished over the last 10 years. This is alarming and may indicate that the local regime shifts are self-generating and spreading to neighboring areas, as plumes of turbid water and mats of perennial drift algae become larger.
Along the Swedish west coast, there appears to be additional important feedbacks related to the loss of cod (Gadus morhua) that operate on a regional scale and may further challenge the recovery of eelgrass. Loss of large predators from coastal ecosystems can result in trophic cascades that release epiphytic algae from grazer control in seagrass systems (Duffy et al. 2014; Östman et al. 2016), and recent studies suggest that overfishing of cod and other large fish predators along the Swedish west coast has contributed to a dramatic increase in mats of filamentous macroalgae, which are considered to be the major cause for eelgrass loss in Sweden (Moksnes et al. 2008; Baden et al. 2010, 2012). In addition, the abundance of shore crabs Carcinus maenas has increased along the Swedish west coast in response to decreasing cod populations (Eriksson et al. 2011). Shore crabs are efficient predators on eelgrass seeds and can cause significant losses of seeds in Swedish waters (Infantes et al. 2016b). Because eelgrass constitutes an essential nursery habitat for cod in Sweden (Pihl et al. 2006), the extensive loss of eelgrass from the Swedish NW coast has in turn likely contributed to a significant loss in cod recruitment (Stål et al. 2008; Cole and Moksnes 2016). Thus, the loss of eelgrass nursery habitats for cod and other large fish predators may act as self-generating feedback mechanism which reduces the recruitment of cod on a regional scale, which in turn increases the growth of filamentous algae and the abundance of shore crabs that further increase the loss of eelgrass, and so on. However, since mats of filamentous algae have increased in all areas along the Swedish NW coast (Pihl et al. 1999), e.g., also in the Gullmarsfjord area where the distribution of eelgrass has been stable in the last decade (Moksnes, unpublished data), these regional feedback mechanisms cannot by themselves explain the ongoing loss of eelgrass in the Marstrand area. Still, filamentous algae and shore crabs were present in many of the eelgrass plots and likely contribute to the poor growth of eelgrass in this area.
Hence, the challenges for eelgrass management along the Swedish NW coast are presently very large, as multiple strong feedback mechanisms not only prevent the recovery of eelgrass but also appear to cause an accelerating loss in affected areas. Urgent management actions are therefore needed to prevent the losses from spreading to neighboring areas. A key measure in the Marstrand area is to protect the few remaining eelgrass meadows to prevent losses from accelerating further. Increased spatial protection from coastal exploitation may be a key measure since the cumulative impact from piers and marinas has a large negative effect on eelgrass in Sweden (Eriander et al. 2017). In addition, a combination of new measures on regional and local scales will be required, including measures to increase the populations of cod and other large predators in the coastal zone, and local actions to break feedback mechanism in combination with eelgrass restoration.
Site Selection Criteria for Eelgrass Restoration in Sweden
Consistent with earlier studies (e.g., Short et al. 2002; van Katwijk et al. 2009; Leschen et al. 2010), the present study demonstrates the importance of careful assessment of the growth conditions for eelgrass before any attempts of large-scale restoration is started. Based on 5 years of monitoring and test planting, we presently cannot recommend using restoration as a measure to help the recovery of eelgrass at any of the sites targeted for restoration in the Marstrand area due to the present environmental conditions. Multiyear survival of eelgrass planted at historically vegetated sites was only found at one of the sites, but only during one of the 3 years when planting was performed.
Although this study did not find any suitable sites for eelgrass restoration within the Marstrand area, it did assess and identify a number of factors important for eelgrass growth in the study area, which could be useful for continuing the evaluation of potential restoration sites in Sweden and other areas. Similar to what have been found in earlier studies (e.g., Dennison et al. 1993; Moore et al. 1996; Fonseca et al. 1998; Thom et al. 2008), light availability at the planting depth was found to be the most important factor affecting eelgrass growth, explaining 62% of the variation in lateral shoot growth between planting sites. The results suggest that positive growth is obtained at around 20% of the irradiance at the surface, which is similar to what has been found in earlier studies (reviewed by Dennison et al. 1993).
Earlier studies have suggested that a high percentage silt and clay in the sediment could have negative effects on seagrass growth by decreasing porewater and oxygen exchange with the sediment surface, which may lead to increased phytotoxins such as sulfides (reviewed by Koch 2001). However, the suggested threshold for growth varies strongly in the literature, from < 20% silt and clay as a general requirement for seagrass growth (Koch 2001) to < 70% as a recommendation during site selection for eelgrass restoration (Short et al. 2002). In the present study, we found a surprisingly strong correlation between the percentage silt and clay in the sediment and the growth of planted eelgrass, explaining 59% of the variation in growth between sites. However, this correlation was likely not driven by an effect on porewater exchange and sulfide levels in the sediment (see below). Instead, it was most likely an effect of the fine sediment being more susceptible to resuspension, affecting the light available for the plants (as discussed earlier). The results showed a positive growth in sediment with a silt and clay content approximately < 35%, while no eelgrass survived when planted in sediments with a content > 60% (Fig. 5). These numbers are surprisingly similar to the results from an eelgrass restoration project in Boston Harbor, USA, where thresholds in silt and clay content for high growth rates and survival were 35 and 57%, respectively (Leschen et al. 2010), suggesting that these threshold values may be useful for site selection in many areas. This may also indicate that the negative effect from fine sediment on eelgrass growth may be related to resuspension also in other regions. In the Marstrand area, the presence of compact, glacial marine clay close to the sediment surface may further have hampered the ability of planted eelgrass to survive due to constrains on developing rhizome and roots in the sediment.
In contrast to the strong effect of silt and clay, we found little support that the organic content of the sediment or sulfide intrusion affected the growth of planted eelgrass. Although earlier studies have shown that transplanted eelgrass can grow in sediments with high organic content (Eriander et al. 2016), reviews have suggested that seagrass growth in general is limited to sediments with an organic content < 5%, mainly due to high concentrations of toxic sulfides in organic-rich sediments, although some species have been found to grow in sediment with higher content (Koch 2001). The organic and water content can also affect the stability of the sediment, and it has been suggested that at organic content and water levels above 2 and 40%, respectively, the sediment becomes more fluid, which increases the probability of sediment resuspension (Lillebø et al. 2011). At these levels, the anchoring capacity of shoots is also affected, with an increased risk of dislodgement (Lillebø et al. 2011). However, in the present study, we found high survival of eelgrass shoot planted in sediments with 11% organic content and no relationship between neither shoot growth nor light attenuation in the water and the organic content. The field experiment also showed that dislodgment of shoots is not an important factor for eelgrass loss in the area. Thus, along the Swedish west coast, eelgrass appears to be well adapted to growing in sediment with high organic content which can reach 25% inside larger eelgrass meadows (Jephson et al. 2008). Sediments with high organic content should therefore not pose a problem for eelgrass restoration.
Sulfide intrusion into seagrasses has been directly linked to seagrass decline (Frederiksen et al. 2007, 2008) and negative population dynamics (Marbá et al. 2005; Holmer and Nielsen 1997) and has been suggested to be important also for the decline of eelgrass along the Swedish NW coast (Holmer et al. 2009). However, less is known about how sulfide intrusion influences growth and survival of transplanted eelgrass shoots. In the present study, we found evidence of dissolved sulfide in the porewater close to the sediment surface next to existing eelgrass beds, but no indication of sulfide in sediments in areas where eelgrass had been lost. Sulfide intrusion into roots and leaves was higher at sites where dissolved sulfide was identified close to the sediment surface, but had no apparent negative effects on growth. In fact, lateral shoot growth was higher at sites with higher sulfide intrusion (Fig. 4). These results suggest that eelgrass planted at sites with high sulfide content, but with good light conditions can handle low levels of sulfide invasion without negative effects on growth, probably due to efficient detoxification (Hasler-Sheetal and Holmer 2015). In areas that have lost large eelgrass meadows, the organic-rich top layer of the sediment has likely been eroded, as indicated by presence of glacial marine clay at the sediment surface at several sites, thereby decreasing the concentration of sulfide. Thus, sulfide intrusion appears to be less of a problem for eelgrass restoration in these sediments.
In summary, the present study suggests that for site selection, light attenuation in the water, sediment grain size, and presence of drifting algal mats are key variables to monitor, whereas the organic and sulfide content of the sediment, salinity, and Chl-a concentration are of lesser importance for growth and survival of planted eelgrass along the Swedish NW coast. In addition, the study suggests that the number of leaves on planted shoots constitutes a good indicator of health and continuing growth in the transplants, consistent with earlier studies in Sweden (Eriander et al. 2016; Eriander 2017) and elsewhere (Carr et al. 2012). Although functional methods for eelgrass restoration in Sweden have been developed (Eriander et al. 2016; Infantes et al. 2016a) and detailed guidelines are available (Moksnes et al. 2016), large-scale restoration of eelgrass in the Marstrand area can presently not be recommended due to the strong feedbacks preventing eelgrass growth. To break these feedbacks, new methods need to be developed, which could include harvesting or fencing off perennial algal mats, dampening the wave energy or stabilizing the sediment with artificial structures, or sand capping to decrease sediment resuspension. If these measures could temporarily reduce the feedbacks that lock the system in the undesirable state, eelgrass could be planted and allowed to grow to a scale that exceeds the threshold where positive feedbacks that promote eelgrass growth shift the system back to the vegetated state. Further studies are needed both to identify the thresholds in eelgrass shoot density and areal extent that will prevent sediment resuspension and drift algae from negatively affecting the growth of eelgrass on a local scale, and to develop methods that could temporally reduce these feedbacks.
References
Anonymous, 2016. Havet 2015/2016 - Om miljötillståndet i svenska havsområden (in Swedish). The Swedish Institute for the Marine Environment.
Baden, S., M. Gullström, B. Lundén, L. Pihl, and R. Rosenberg. 2003. Vanishing seagrass (Zostera marina, L.) in Swedish coastal waters. Ambio: A Journal of the Human Environment 32: 374–377.
Baden, S.P., C. Boström, S. Tobiasson, H. Arponen, and P.-O. Moksnes. 2010. Relative importance of trophic interactions and nutrient enrichment in seagrass ecosystems: A broad-scale field experiment in the Baltic-Skagerrak area. Limnology and Oceanography 55: 1435–1448.
Baden, S., A. Emanuelsson, L. Pihl, C.J. Svensson, and P. Åberg. 2012. Shift in seagrass food web structure over decades is linked to overfishing. Marine Ecology Progress Series 451: 61–73.
Barbier, E.B., E.W. Koch, B.R. Silliman, S.D. Hacker, E. Wolanski, J. Primavera, E.F. Granek, S. Polasky, S. Aswani, L.A. Cramer, D.M. Stoms, C.J. Kennedy, D. Bael, C.V. Kappel, G.M.E. Perillo, and D.J. Reed. 2008. Coastal ecosystem-based management with nonlinear ecological functions and values. Science 319: 321–323.
Borum, J., 1983. The quantitative role of macrophytes, epiphytes, and phytoplankton under different nutrient conditions in Roskilde Fjord, Denmark. Proceeding International Symposium on Aquatic Macrophytes, Nijmejen, 35–40.
Boström, C., S. Baden, and D. Krause-Jensen. 2003. The seagrasses of Scandinavia and the Baltic Sea. In World atlas of seagrasses, ed. E.P. Green and F.T. Short, 27–37. Berkeley: University of California Press.
Boström, C., S. Baden, A.C Bockelmann, K. Dromph, S. Fredriksen, C. Gustafsson, D. Krause-Jensen, T. Möller, S.L. Nielsen, B. Olesen, J. Olsen, L. Pihl, E. Rinde. 2014. Distribution, structure and function of Nordic eelgrass (Zostera marina) ecosystems: implications for coastal management and conservation. Aquatic Conservation Marine and Freshwater Ecosystems 24:410–434.
Brodersen, K.E., K.J. Hammer, V. Schrameyer, A. Floytrup, M.A. Rasheed, P. Ralph, et al. 2017. Sediment resuspension and deposition on seagrass leaves impedes internal plant aeration and promotes phytotoxic H2S intrusion. Frontiers in Plant Science 8: 657.
Canal-Vergés, P., M. Vedel, T. Valdemarsen, E. Kristensen, and M.R. Flindt. 2010. Resuspension created by bedload transport of macroalgae: Implications for ecosystem functioning. Hydrobiologia 649: 69–76.
Canal-Verges, P., M. Potthoff, F.T. Hansen, N. Holmboe, E.K. Rasmussen, and M.R. Flindt. 2014. Eelgrass re-establishment in shallow estuaries is affected by drifting macroalgae—Evaluated by agent-based modeling. Ecological Modelling 272: 116–128.
Carr, J.A., P. D’Odorico, K.J. McGlathery, and P.L. Wiberg. 2012. Modeling the effects of climate change on eelgrass stability and resilience: Future scenarios and leading indicators of collapse. Marine Ecology Progress Series 448: 289–301.
Carstensen, J., M. Sánchez-Camacho, C.M. Duarte, et al. 2011. Connecting the dots: Responses of coastal ecosystems to changing nutrient concentrations. Environmental Science & Technology 45: 9122–9132.
Cole, S.G., and P.-O. Moksnes. 2016. Valuing multiple ecosystem services in Sweden: Fish production and uptake of carbon and nitrogen. Frontiers in Marine Science 2: 121.
Cunha, A.H., N.N. Marbá, M.M. van Katwijk, C. Pickerell, M. Henriques, G. Bernard, M.A. Ferreira, S. Garcia, J.M. Garmendia, and P. Manent. 2012. Changing paradigms in seagrass restoration. Restoration Ecology 20: 427–430.
Davis, R.C., and F.T. Short. 1997. Restoring eelgrass, Zostera marina L., habitat using a new transplanting technique: The horizontal rhizome method. Aquatic Botany 59: 1–15.
Davis, R.C., F.T. Short, and D.M. Burdick. 1998. Quantifying the effects of green crab damage to eelgrass transplants. Restoration Ecology 6: 297–302.
Den Hartog, C. 1970. The sea-grasses of the world. Amsterdam: North Holland Publ.
Dennison, W.C., R.J. Orth, K.A. Moore, J.C. Stevenson, V. Carter, S. Kollar, P.W. Bergstrom, and R.A. Batiuk. 1993. Assessing water quality with submersed aquatic vegetation. Bioscience 43: 86–94.
Duarte, C.M., N. Marbà, D. Krause-Jensen, and M. Sánchez-Camacho. 2007. Testing the predictive power of seagrass depth limit models. Estuaries and Coasts 30: 652–656.
Duarte, C.M., D.J. Conley, J. Carstensen, and M. Sánchez-Camacho. 2009. Return to Neverland: Shifting baselines affect eutrophication restoration targets. Estuaries and Coast 32: 29–36.
Duffy J.E., A.R. Hughes, and P-O. Moksnes. 2014. Ecology of seagrasses. In Marine community ecology and conservation, ed. Bertness et al., 272–298. Sinauer Associates
Eriander, L. 2017. Light requirements for successful restoration of eelgrass (Zostera marina L.) in a high latitude environment—Acclimatization, growth and carbohydrate storage. Journal of Experimental Marine Biology and Ecology 496: 37–48.
Eriander, L., E. Infantes, M. Olofsson, J.L. Olsen, and P.-O. Moksnes. 2016. Assessing methods for restoration of eelgrass (Zostera marina L.) in a cold temperate region. Journal of Experimental Marine Biology and Ecology 479: 76–88.
Eriander, L., K. LaaS, P. Bergström, L. Gipperth, and P.-O. Moksnes. 2017. The effects of small-scale coastal development on the eelgrass (Zostera marina L.) distribution along the Swedish west coast—Ecological impact and legal challenges. Ocean and Coastal Management 148: 182–194.
Eriksson, B.K., K. Sieben, J. Eklöf, L. Ljunggren, J. Olsson, M. Casini, and U. Bergström. 2011. Effects of altered offshore food webs on coastal ecosystems emphasize the need for cross-ecosystem management. Ambio: A Journal of the Human Environment 40: 786–797.
Fonseca, M.S., W.J. Kenworthy, and G.W. Thayer. 1998. Guidelines for the conservation and restoration of seagrasses in the United States and adjacent waters. NOAA Coastal Ocean Program, Decision Analysis Series No. 12.
Fossing H., P.B. Kristensen, T Dalsgaard, and S. Rysgaard. 1998. Teknisk anvisning for marin overvågning (in Danish). 14 Sediment, ilt og næringsstoffer. NOVA. Miljø- og Energiministeriet Danmarks miløundersøgelser
Fourqurean, J.W., C.M. Duarte, H. Kennedy, et al. 2012. Seagrass ecosystems as a globally significant carbon stock. Nature Geoscience 5: 505–509.
Frederiksen, M., D. Krause-Jensen, M. Holmer, and J.S. Laursen. 2004. Long-term changes in area distribution of eelgrass (Zostera marina) in Danish coastal waters. Aquatic Botany 78: 167–181.
Frederiksen, M.S., M. Holmer, J. Borum, and H. Kennedy. 2006. Temporal and spatial variation of sulfide invasion in eelgrass (Zostera marina) as reflected by its sulfur isotopic composition. Limnology and Oceanography 51: 2308–2318.
Frederiksen, M.S., M. Holmer, E. Díaz-Almela, N. Marbà, and D.C. Duarte. 2007. Sulfide invasion in the seagrass Posidonia oceanica at Mediterranean fish farms: Assessment using stable sulfur isotopes. Marine Ecology Progress Series 345: 93–104.
Frederiksen, M.S., M. Holmer, M. Pérez, O. Invers, J.M. Ruiz, and B.B. Knudsen. 2008. Effect of increased sediment sulfide concentrations on the composition of stable sulfur isotopes (delta S-34) and sulfur accumulation in the seagrasses Zostera marina and Posidonia oceanica. Journal of Experimental Marine Biology and Ecology 358: 98–109.
Giesen, W.B.J.T., M.M. van Katwijk, and C. Den Hartog. 1990. Eelgrass condition and turbidity in the Dutch Wadden Sea. Aquatic Botany 37: 71–85.
Hansen, J.C., and M.A. Reidenbach. 2012. Wave and tidally driven flows in eelgrass beds and their effect on sediment suspension. Marine Ecology Progress Series 448: 271–287.
Hasler-Sheetal H., and M. Holmer. 2015. Sulfide intrusion and detoxification in the seagrass Zostera marina. PLoS One. https://doi.org/10.1371/journal.pone.0129136
Holmer, M., and S.L. Nielsen. 1997. Sediment sulfur dynamics related to biomass-density patterns in Zostera marina (eelgrass) beds. Marine Ecology Progress Series 146: 163–171.
Holmer, M., S. Baden, P.-O. Moksnes, and C. Boström. 2009. Regional variation in stable sulfur isotopic composition of eelgrass (Zostera marina) along a salinity gradient from the Baltic Sea to Skagerrak. Aquatic Botany 91: 303–310.
Infantes, E., L. Eriander, and P.-O. Moksnes. 2016a. Eelgrass (Zostera marina) restoration on the west coast of Sweden using seeds. Marine Ecology Progress Series 546: 31–45.
Infantes, E., C. Crouzy, and P.-O. Moksnes. 2016b. Seed predation by the shore crab Carcinus maenas: A positive feedback preventing recovery of eelgrass Zostera marina? PLoS One 11: 1–19. https://doi.org/10.1371/journal.pone.0168128.
Jeffrey, S.W., and G.F. Humphrey. 1975. New spectrophotometric equation for determining chlorophylls a, b, c1 and c2 in higher plants, algae and natural phytoplankton. Biochemie und Physiologie der Pflanzen 167: 191–194.
Jephsson, T., P. Nyström, P.-O. Moksnes, and S. Baden. 2008. Trophic interactions within Zostera marina beds along the Swedish coast. Marine Ecology Progress Series 369: 63–76.
Kenworthy, W.J., C.L. Gallegos, C. Costello, D. Field, and G. di Carlo. 2014. Dependence of eelgrass (Zostera marina) light requirements on sediment organic matter in Massachusetts coastal bays: Implications for remediation and restoration. Marine Pollution Bulletin 83: 446–457.
Krause-Jensen, D., S. Sagert, H. Schubert, and C. Boström. 2008. Empirical relationships linking distribution and abundance of marine vegetation to eutrophication. Ecological Indicators 8: 515–529.
Koch, E.W. 2001. Beyond light: Physical, geological, and geochemical parameters as possible submersed aquatic vegetation habitat requirements. Estuaries 24: 1–17.
Kruk-Dowgiallo, L. 1991. Long-term changes in the structure of underwater meadows of the Puck Lagoon. Acta Ichthyologica et Piscatoria Supplementum 21: 77–84.
Leschen, A.S., K.H. Ford, and N.T. Evans. 2010. Successful eelgrass (Zostera marina) restoration in a formerly eutrophic estuary (Boston Harbor) supports the use of a multifaceted watershed approach to mitigating eelgrass loss. Estuaries and Coasts 33: 1340–1354.
Lillebø, A.I., M.R. Flindt, P. Cardoso, S. Leston, M. Dolbeth, M.E. Pereira, A.C. Duarte, and M.A. Pardal. 2011. Restoration of seagrass community to reverse eutrophication in estuaries. In Treatise on estuarine and coastal science, ed. E. Wolanski and D.S. McLusky, 151–164. Waltham: Academic.
Marbà, N., C.M. Duarte, E. Díaz-Almela, J. Terrados, E. Álvarez, R. Martínez, and A.M. Grau. 2005. Direct evidence of imbalanced seagrass (Posidonia oceanica) shoot population dynamics in the Spanish Mediterranean. Estuaries 28: 53–62.
Maxwell, P., J.S. Eklöf, M.M. van Katwijk, K. O'Brien, M. de la Torre-Castro, C. Boström, T.J. Bouma, D. Krause-Jensen, R.K.F. Unsworth, B.I. van Tussenbroek, and T. van der Heide. 2016. The fundamental role of ecological feedback mechanisms in seagrass ecosystems—A review. Biological Reviews. https://doi.org/10.1111/brv.12294
Moksnes, P.-O., M. Gullström, K. Tryman, and S. Baden. 2008. Trophic cascades in a temperate seagrass community. Oikos 117: 763–777.
Moksnes, P-O., J. Elam, A. Grimvall. 2015. Samlad analys av regionala och nationella havmiljödata (in Swedish). Swedish Institute for the Marine Environment. Report no. 2015:2 (212 pg).
Moksnes, P-O., L- Gipperth, L. Eriander, K. Laas, S. Cole, and E. Infantes. 2016. Handbok för restaurering av ålgräs i Sverige: Vägledning (in Swedish). Havs- och vattenmyndighetens rapport 2016:9, 146 pp, ISBN 978-91-87967-17-7.
Moore, K.A., H.A. Neckles, and R.J. Orth. 1996. Zostera marina (eelgrass) growth and survival along a gradient of nutrients and turbidity in the lower Chesapeake Bay. Marine Ecology Progress Series 142: 247–259.
Moore, K.A. 2004. Influence of seagrasses on water quality in shallow regions of the lower Chesapeake Bay. Journal of Coastal Research: 162–178.
Munkes, B. 2005. Eutrophication, phase shift, the delay and the potential return in the Greifswalder Bodden, Baltic Sea. Aquatic Sciences 67: 372–381.
NOAA. 2014. California eelgrass mitigation policy and implementing guidelines. USA: NOAA Fisheries West Coast Region.
Nyqvist, A., C. André, M. Gullström, S.P. Baden, and P. Åberg. 2009. Dynamics of seagrass meadows on the Swedish Skagerrak coast. Ambio: A Journal of the Human Environment 38: 85–88.
Nyström, M., A.V. Norström, T. Blenckner, M. de la Torre-Castro, J.S. Eklöf, C. Folke, H. Österblom, R.S. Steneck, M. Thyresson, and M. Troell. 2012. Confronting feedbacks of degraded marine ecosystems. Ecosystems 15: 695–710.
Orth, R.J., M.C. Harwell, and J.R. Fishman. 1999. A rapid and simple method for transplanting eelgrass using single, unanchored shoots. Aquatic Botany 64: 77–85.
Orth, R.J., T.J.B. Carruthers, W.C. Dennison, et al. 2006. A global crisis for seagrass ecosystems. Bioscience 56: 987–996.
Orth, R.J., K.A. Moore, S.R. Marion, and D.J. Wilcox. 2012. Seed addition facilitates eelgrass recovery in a coastal bay system. Marine Ecology Progress Series 448: 177–195.
Östman, Ö., J. Eklöf, B.K. Eriksson, J. Olsson, P.-O. Moksnes, and U. Bergström. 2016. Meta-analysis reveals top-down processes are as strong as bottom-up effects in North Atlantic coastal food webs. Journal of Applied Ecology 53: 1138–1147.
Paling, E.I., M. Fonseca, M. van Katwijk, and M. van Keulen. 2009. Seagrass restoration. In Coastal wetlands: An ecosystem integrated approach, ed. G.M.E. Perillo, E. Wolanski, D. Cahoon, and M.M. Brinson, 687–713. Amsterdam: Elsevier.
Philippart, C.J.M. 1994. Interactions between Arenicola marina and Zostera noltii on a tidal flat in the Wadden Sea. Marine Ecology Progress Series 111: 251–257.
Pihl, L., A. Svensson, P.-O. Moksnes, and H. Wennhage. 1999. Distribution and production of ephemeral algae in shallow coastal areas on the Swedish west coast. Journal of Sea Research 41: 281–294.
Pihl, L., S. Baden, N. Kautsky, P. Rönnbäck, T. Söderqvist, M. Troell, and H. Wennhage. 2006. Shift in fish assemblage structure due to loss of seagrass Zostera marina habitats in Sweden. Estuaries, Coasts and Shelf Science 67: 123–132.
Scheffer, M., S. Carpenter, J.A. Foley, C. Folke, and B. Walker. 2001. Catastrophic shifts in ecosystems. Nature 413: 591–596.
Scheffer, M., and S.R. Carpenter. 2003. Catastrophic regime shifts in ecosystems: Linking theory to observation. Trends in Ecology and Evolution 18: 648–656.
SEPA (2007) Swedish Environmental Protection Agency (in Swedish) Naturvårdsverket .Bedömningsgrunder för kustvatten och vatten i övergångszon. Bilaga B till Handbok 2007:4.
Short, F.T., and S. Wyllie-Echeverria. 1996. Natural and human-induced disturbances of seagrasses. Environmental Conservation 23: 17–27.
Short, F.T., D.M. Burdick, C.A. Short, R.C. Davis, and P.A. Morgan. 2000. Developing success criteria for restored eelgrass, salt march and mud flat habitats. Ecological Engineering 15: 239–252.
Short, F.T., R.C. Davis, B.S. Kopp, C.A. Short, and D.M. Burdick. 2002. Site-selection model for optimal transplantation of eelgrass Zostera marina in the northeastern US. Marine Ecology Progress Series 227: 253–267.
Short, F., T. Carruthers, W. Dennison, and M. Waycott. 2007. Global seagrass distribution and diversity: A bioregional model. Journal of Experimental Marine Biology and Ecology 350: 3–20.
Sokal, R.R., and F.J. Rohlf. 2011. Biometry: The principals and practices of statistics in biological research. USA: Freeman.
Stål, J., S. Paulsen, L. Pihl, P. Rönnbäck, T. Söderqvist, and H. Wennhage. 2008. Coastal habitats support to fish and fisheries in Sweden: Integrating ecosystem function into fisheries management. Ocean and Coastal Management 51: 594–600.
SwAM. 2015. Swedish Agency for Marine and Water Management (in Swedish). God havsmiljö 2020 Marin strategi för Nordsjön och Östersjön, Del 4: Åtgärdsprogram för havsmiljön. Havs- och vattenmyndighetens rapport 2015: 30.
Suding, K.N., K.L. Gross, and G.R. Houseman. 2004. Alternative states and positive feedbacks in restoration ecology. Trends in Ecology and Evolution 19: 46–53.
Tamaki, H., M. Tokuoka, W. Nishijima, T. Terawaki, M. Okada. 2002. Deterioration of eelgrass, Zostera marina L., meadows by water pollution in Seto Inland Sea, Japan. Marine Pollution Bulletin 44:1253–1258.
Unsworth, R.K.F., L.C. Cullen, J.N. Pretty, D.J. Smith, and J.J. Bell. 2010. Economic and subsistence values of the standing stocks of seagrass fisheries: Potential benefits of no-fishing marine protected area management. Ocean and Coastal Management 53: 218.
Thom, R.M., S.L. Southard, A.B. Borde, and P. Stoltz. 2008. Light requirements for growth and survival of eelgrass (Zostera marina L.) in Pacific Northwest (USA) estuaries. Estuaries and Coasts 31: 969–980.
Valdemarsen, T., P. Canal-Verges, E. Kristensen, M. Holmer, M.D. Kristiansen, and M.R. Flindt. 2010. Vulnerability of Zostera marina seedlings to physical stress. Marine Ecology Progress Series 418: 119–130.
van der Heide, E.H., E.H. van Nes, G.W. Geerling, A.J.P. Smolders, T.J. Bouma, and M.M. van Katwijk. 2007. Positive feedbacks in seagrass ecosystems: Implications for success in conservation and restoration. Ecosystems 10: 1311–1322.
van der Heide, T., E.H. van Nes, M.M. van Katwijk, et al. 2011. Positive feedbacks in seagrass ecosystems—Evidence from large-scale empirical data. PLoS One 6: e16504. https://doi.org/10.1371/journal.pone.0016504.
van Katwijk, M.M., and D.C.R. Hermus. 2000. Effects of water dynamics on Zostera marina: Transplantation experiments in the intertidal Dutch Wadden Sea. Marine Ecology Progress Series 208: 107–118.
van Katwijk, M.M., A.R. Bos, V.N. de Jonge, et al. 2009. Guidelines for seagrass restoration: Importance of habitat selection and donor popu- lation, spreading of risks, and ecosystem engineering effects. Marine Pollution Bulletin 58: 179–188.
van Katwijk, M.M., A. Thorhaug, N. Marbà, R.J. Orth, C.M. Duarte, G.A. Kendrick, I.H.J. Althuizen, E. Balestri, G. Bernard, M.L. Cambridge, A. Cunha, C. Durance, W. Giesen, Q. Han, S. Hosokawa, W. Kiswara, T. Komatsu, C. Lardicci, K.-S. Lee, A. Meinesz, M. Nakaoka, K.R. O'Brien, E.I. Paling, C. Pickerell, A.M.A. Ransijn, and J.J. Verduin. 2015. Global analysis of seagrass restoration: The importance of largescale planting. Journal of Applied Ecology 53: 567–578.
Waycott, M., C.M. Duarte, T.J. Carruthers, R.J. Orth, W.C. Dennison, S. Olyarnik, A. Calladine, J.W. Fourqurean, K.L. Heck, A.R. Hughes, G.A. Kendrick, W.J. Kenworthy, F.T. Short, and S.L. Williams. 2009. Accelerating loss of seagrasses across the globe threatens coastal ecosystems. Proceedings of the National Academy of Sciences 106: 12377–12381.
WISS. 2015. Water Information System Sweden (in Swedish) Vatten informations system Sverige. http://WISS.lansstyrelsen.se/
Acknowledgements
We thank Ingela Isaksson and Fredrik Larson from the County Administrative Board of Västra Götaland (CABVG) and Ingemar Andersson from the Swedish Agency for Marine and Water Management (SwAM) for playing important parts in initiating this research; Ewa Lawett and Anders Olsson from CABVG and Johan Rolandsson from EcoWorks AB for excellent collaboration in mapping eelgrass in the study area; and Malin Olofsson, Robert Eriksson, Filip Käll, and Kajsa Palmqvist for excellent assistance in the field and in the lab. The work was performed within the transdisciplinary research program Zorro (www.gu.se/zorro) at the University of Gothenburg.
Funding
This research was funded by grants to P-O Moksnes from the CABVG (contract no. 501-013164-2010), the Swedish Research Council FORMAS (contract no. 212-2011-758), the Swedish Agency for Marine and Water Management (contract no. 4832-12), and the Wåhlströms’ Memorial Foundation for the aquatic environment in Bohuslän, which are kindly acknowledged.
Author information
Authors and Affiliations
Corresponding author
Additional information
Communicated by Richard C. Zimmerman
Electronic Supplementary Material
ESM 1
(PDF 1525 kb)
Rights and permissions
Open Access This article is distributed under the terms of the Creative Commons Attribution 4.0 International License (http://creativecommons.org/licenses/by/4.0/), which permits unrestricted use, distribution, and reproduction in any medium, provided you give appropriate credit to the original author(s) and the source, provide a link to the Creative Commons license, and indicate if changes were made.
About this article

Cite this article
Moksnes, P.O., Eriander, L., Infantes, E. et al. Local Regime Shifts Prevent Natural Recovery and Restoration of Lost Eelgrass Beds Along the Swedish West Coast. Estuaries and Coasts 41, 1712–1731 (2018). https://doi.org/10.1007/s12237-018-0382-y
Received:
Revised:
Accepted:
Published:
Issue Date:
DOI: https://doi.org/10.1007/s12237-018-0382-y