
Abstract
A growing amount of research conducted in digital, cooperative with advances in Artificial Intelligence, Computer Vision including Machine learning, has managed to the advance of progressive techniques that aim to detect and process affective information contained in multi-modal evidences. This research intends to bring together for theoreticians and practitioners from academic fields, professionals and industries and extends to be visualizing cries such epidemic, votes, social Phenomena in spherical representation interactive model working in the broad range of topics relevant to multi - modal data processing and forensics tools developing. Furthermore, progress has been made in this research besides that in this research conducted progression of mapping claims in present epoch necessitate the capacities of virtual guide of any understandable Geo-Visualization of spatial features that talented to convert the quantities of spatial pattern into cartography. The enlargement of a novel approaches fit for visualization of spatial pattern constituencies Starting exclusive Input Set of object O, set associated with feature F for regenerating Output the set C , interested region I special target C Even so, as indicated by the construction of the prototype as listed earlier in this thread, does it have the incentive for improvements: Representation could be used by Google Earth can Using Project enhancement representation whereby provides a 3D or 4D interaction with life measures with a view to cartography. In addition, the initiative suggests that a tool not accessible for disseminating information to the public can be addressed by the use of online mapping, which fuses with trends visualization for political circles and electors. But as mentioned above the framework is developed and it's also possible in the current example, for improvements: The project's representation 3D or 4D interacting Earth can use measures of life Earth From the map viewpoint. That's what that says. That means that. Which just means. Developers have concerns that. So it. Designers concern about that. This study supports the new, multi - demission and deployed countries in conjunction with another data is processed. Comprehensive, well-interpreted source data for the Data like Malaysia Jabatan Pendaftaran (JPN).
1 Introduction
Geo-visualization is a recent cartographic field which derives approaches from multi-disciplinary areas, including Cartography, Scientific Visualization, Image Analysis, Information Visualization, Exploratory Data Analysis (EDA) and GIScience to provide theories, methodologies and technologies for the visual exploration, analysis, synthesis and presentation of data that contains geographic information [29]. Numerous web mapping applications are available over the Internet and among the popular ones are the 2D web mapping services such as Google Maps, Yahoo Maps, Bing Maps, OpenStreetMaps, ArcGIS Online and 3D virtual globes such as Google Earth, Bing Maps 3D, ArcGIS Explorer, Marble and others [39].
Visualization of spatial data over the web for electoral constituencies and voters in Malaysia are currently not yet available by Election Commission (EC) or any other parties, be it political organizations or non-partisan bodies. Unfortunately, the conventional access to the electoral constituencies and voters’ [45] the data can be achieved through the purchase of maps and voters roll in hardcopy or softcopy format over the counter from EC. Nevertheless, through this conventional means of making the data publicly accessible, the public are still have very limited access to the electoral data [39].Web mapping applications are one of optimum alternatives to be assembly presentation of spatial data to display them the public, as in this case, EC electoral data. Spatial databases or conventional databases with spatial features can be used to store the data such as MySQL, SQL Server, Oracle, PostGIS or even the recent introduction to the cloud computing databases such as Google Fusion Table, GISCloud.com, etc. Then the developers of the web-GIS only need to use Application Programming Interface (API) from the online mapping services to display their geographical data in a web cartography such as velocity ,verity ,Volume, and Place, space and time.To identifying determine the method of maps may help us comprehend geospatial big data scales [49], which in this project case, will probably be using Api Google Maps for the public to access with their Internet browsers [9]. Referring back to Geovisualization in both application tools including the core technologies to envisage geospatial data [32]. Fundamentally, geographical data preserve a clear description of any data that contains spatial features and attributes. A spatial feature is an attribute for some location on the map, either in a form expressed as a coordinate of latitude and longitude or an address [15]. Potentially, geography can explain majority of innovation, data analyze for information representation through the usage of interactive spatial visualizations.
This use is seen as in recognition of geographical information systems (GIS), virtual globes and all sort of Web-based mapping tools that are currently available to the masses [19].
Internet GIS is a field that utilizes the Internet to facilitate access, processing, and dissemination of geographic information and spatial data analysis knowledge [44]. Google, Microsoft and Yahoo released free Web mapping applications to their web-based maps that opened up digital mapping or mashups to mainstream Internet users in 2005. Importantly, these three companies also offered APIs for no charge on their platforms, allowing the Internet masses to visualize and map their data. These initiatives have started spatially aware Internet communities and provide new ways of enabling the masses to share their information to the world [40].
Web mapping is currently one of the techniques popular among the web cartographers or even non-IT savvy public masses for exploration and representation of spatial or pseudo-spatial data over the Internet.
Elections in Malaysia exist at two levels:
federal level and state level. Federal level elections are those for membership in the formed in Dewan Rakyat, the lower house of Parliament, while state-level elections are for membership in the numerous State Legislative Congresses. The heads of decision-making branch at both the federal and state.
A recurring this phenomenon; including its impact on the economy and the Asian region where the GDP is over 10 trillion dollars. The EC of Malaysia coming within 2018 has been bombarded by issues of dirty data and unjustified redrawing of political borders. Concerning the Media Statement of EC Chairman- Tan Sri Dato’ Seri Abdul Aziz Bin Mohd Yusof (19 April 2012), item numbered 5.3 addressed the issue of dirty data and item numbered 6.20 addressed the redrawing of political borders. In these time-critical situations, it is imperative that access to geospatial information including the height demands on providing the data for transparency marge with credibility purpose, to validate the address of each voter within an electoral constituency [18].
The need to visualize electoral constituencies besides voters spatial data are impending to require more accurate information in case of redrawing any constituencies (gerrymandering), Furthermore voters allocation for each constituency to satisfy the sudden concern of NGOs and the political organizations of the existence of irregularities in electoral roll (phantom voters).
The Suruhajaya Pilhan Raya (SPR) the English version the election Commission (EC) under the constituent of Malaysia empowered the electoral to the house representative and the legislative include assembly with the holder by election in event of a vacancy.
This research attempts to visualize geographically, the composition of voters by electoral constituencies with contextual descriptions of voter’s attributes using Web-GIS. In summary, the major contributions of this paper are:
-
1.
Identifying the electoral spatial data modelling for geovisualization.
-
2.
Proposed a web mapping technology for the geovisualization of spatial data on the Internet.
-
3.
Developed a Web-GIS application for spatial data of SPR Selangor.
The outline of the rest of the paper is as follows. We first present an extensive literature review in Sect. 2. We then present our methodology in Sect. 3. Results discussions and analyses are then presented in Sect. 4. A construction of electoral Web-GIS application is explained in Sect. 5. Conclusion and future work are then laid out in Sect. 6.
2 Literature review
This section, reviews several literature mechanisms obtaining in the academic world regarding geovisualization, spatial database model, Web-GIS framework besides architecture, includes the web mapping tools merged with technologies elaborate Fig. 1.

From a cartographic perspective a synthesis of the above trends results in geovisualization. Geovisualization integrates approaches from scientific visualization, (exploratory) cartography, image analysis (a technique used in interpreting satellite imagery), information visualization, exploratory data analysis (EDA) and geographic information systems (GIS) to provide theory, methods and tools for visual exploration, analysis, synthesis and presentation of geospatial data [36]
2.1 Geovisualization
Cartography in its simplest term would be map-making [4]. Maps rely heavily on visualization be it in its 2D or 3D perspective. Geovisualization in another meaning is short for Geographic Visualization, essentially signifies to a set of tools and technologies supporting spatial data analysis via usage of interactive visualization over the Internet. However, based on the definition given by one of the prominent and authoritative people in cartography, [33] defined geovisualization as “the execution of a procedure in using geospatial data applications for interpretation, exploration, problem-finding and decision-making”.
By definition above, [33] initiated a new way of thinking about map custom. Geographic visualization, as shown in Fig. 2, is a sort of map use that can be described as being performed in focused on revealing unknowns in the data, and involves a high degree of human-map interaction. Computational methods the third scientific paradigm. Multiple parameters generated a Big data are likely to show diversity and heterogeneity–highlighting the problem of mapping spatial heterogeneity. In this context refers, head/tail falls can also be used to iteratively filter the data in the tail. Focus should be conducted to assimilate computational and graphic strategies.

Cartography representation loop interactive with environment to mapping
The performers to geospatial massive data. This Conceptions could be rummage as part of a geo-visual analysis of a big data set. The collaborations can be engineered through joint stat-of-the art. Digital creativity support tools could provide a platform for collaboration between artists and scientists. We can look to fine art, cinema and music for techniques to represent big data in art. We could also look to caricaturing in illustrative art, an approach used by [43] for 3D rendering of 3D objects. The potential of sound could be realized through the use of sonic works.
In fractal geometry, we have a way of generating a complex artefact of an aesthetic, or even artistic value from simple global inputs. Certain styles of modern art such as Jackson Pollock's [16] drip maps can be used to create ‘messy maps' for revealing spatial and attribute veracity. The goal here is to depict the spatiotemporal narratives that may be implicit in big data. To identify meaningful linkages from artworks to typical spatial and spatial representations is a path towards a path to meaningful big data representations.
These links maps to other representations in a visual analytics context. Cartographers can use data mining to uncover structure in complex representations. Cartography can provide effective visual crops that leverage what we know approximately how folks see and brand sense out of geographic information. We call attention to the critical need for cartography to contribute new solutions to pressing problems that require novel approaches. We have presented a series of key research challenges and opportunities associated with mapping geospatial big data with the intention of spurring the next wave of forward-thinking cartographic factors
Geospatial with multi factors merges in big data visualizations are used in a wide variety of applications and domains. The challenge is cartographic visualization solutions that can Maps and map metaphors to significant attention in information visualization and visual analytics. In most analytical settings, maps must be combined with statistical methods or computational methods to explore or uncover underlying pat-terns or structure. Despite Big data are likely to show diversity and heterogeneous highlighting the problem of spatial heterogeneity.
Figure 3 shows the connection between visualization and communication (diagonally axe). The use of cartographic representations can be displayed with the concept of a three-dimensional coordinate system – “Map use cube”.

The “Cartography Cube” based
The 3 axes are divided as follows:
-
Purpose of use – from reveling unknowns to the presentation of known.
-
Target group – private map use to public map use (for example map from the school atlas)
-
Interactivity – degree of technical interaction with a value range from low to high.
The left lower corner represents the classical use of commonly available maps. Geodata is represented (“Presentation”) in the form of material maps such as topographic maps. The diagonally opposite represents the modern form of geodata using in GIS. The third axis shows the visually supported Analysis.
Geovisualization is the practice of using visual representations to aid in the comprehension and development of geographic data in geography.a multidisciplinary field of study that encompasses everything from scientific visualization to mapping, image analysis, information visualization, electronic data acquisition, and geographic information systems (GISystems)
Among the objectives are the study, comprehension, and explanation of spatial phenomena such as climate and population density.The following is a collection of some of the most often used definitions for geographic visualization, as well as some less frequently used ones.
Throughout the early era, geovisualization research was primarily focused on developing new methods and tools observed via primitive visualization work that was limited to the exploration stage, the exploration task has now extended to include all kinds of visualization work.Even seasoned researchers and students may use the map as an interactive tool to (re)discover new facts by interacting with the material.
The Conceptual Framework for Geovisualization system use [21, 33] defined 3 axes in Fig. 3 which are the nature of the tasks performed – from knowledge construction to information sharing .
The types of users – ranging from domain experts to the general public; and level of interaction with the data – the extent of control user have over the system and spatial data, it also defined the fourth primary functions of Geovisualization use space: explore, analyze, synthesis and present. Defining element of Geovisualization is the role and emphasis placed on human cognitive visual processing Fig. 4.

The sequence mapping from privation mapping to public and wide exploration applied on the Framework for Geovisualization
As a comparison between traditional cartography to modern web mapping Fig. 5. The major difference between traditional cartographic as in (a) and modern web mapping as in (b) is the user interface, which makes the gap between map users and spatial databases narrower and the interface more interactive.

Traditional cartography vs web-based mapping applications [27]
New data-driven approaches to geographic information management do not exclude the use of conventional techniques for developing and managing financial assets, infrastructure, and human capital. This article discusses two broad categories of software development processes: conventional and agile. Additionally, it demonstrates how a spatial database system might be developed from the ground up in the future. Geovisualization is the process of visualizing geographical data via the use of technology. The objective is to uncover unknowns and disseminate current information to a broad, public audience.
Geovisually exploratory activities may vary from the discovery of unknowns to the dissemination of new information.
This enables the creation of universally accessible visuals. Geovisualization is a novel method of displaying maps that enables people to interact with them and (re)discover information.
The map is increasingly being used as an interactive tool for seasoned scientists and students alike.
The objective is to uncover unknowns and disseminate current information to a broad, public audience.
Conventional or traditional static maps, whether its paper-based atlas map or globes have a very limited exploratory capability. Web mapping and geo-visualization allow for more interactive and immersive experience of maps exploration for the user; including the ability to explore different layers of the map that can be used in the web service layer to elaborated to user and simulation for geospatial data [14], to zoom in or out perspective, to rotate (which in the 3D virtual earth case), and to change the visual appearance of the map, usually on a computer display by using Internet browsers as demonstrated in Fig. 6.
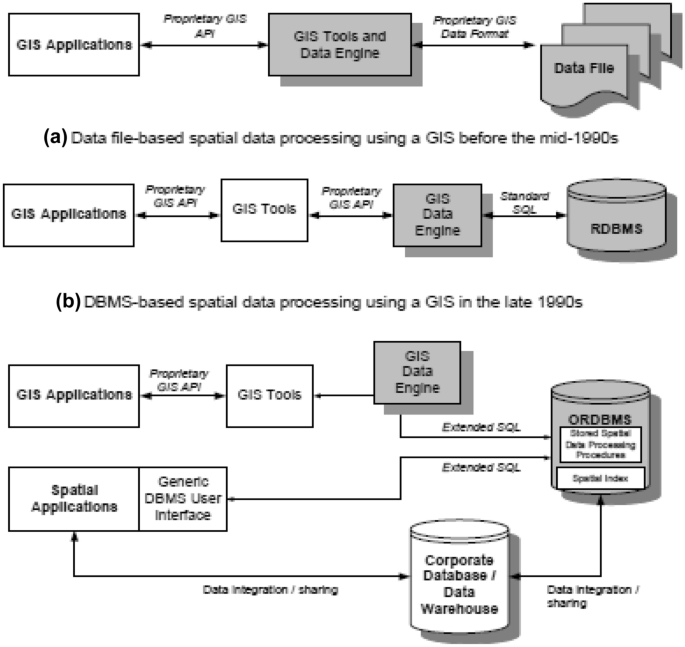
Evolution of spatial data processing (Yeung and Hall [47])
2.2 Spatial database model
Spatial information is approached from three perspectives, namely spatial data management, cartography, and spatial analysis. These perspectives can be described as an instrumental or tool-oriented view of spatial information The new spatial information metaphor is a new way of deploy perspectives in associated with level of information’s. In the past, we dealt with geographical information from three perspectives: data management, mapmaking, and analytics. This is no longer the case. In spite of the fact that [47]. Modified from the traditional views of spatial information, a new conceptualization of spatial information system has evolved, this suggestion led it re-thinking about spatial information from a media perspective, this concept is at odds with prior research, which have focused only upon visually represented spatial information. A sophisticated spatial database system can gather information relevant to a specific region in a short period of time. The technique usually referred to as data mining is referred to as data mining in short. Currently, development efforts are concentrated on making geographic data more readily accessible via the Internet for this sector of the business. Spatial database systems are often employed for much more than simply the administration, display, and analysis of geographically connected information, owing to the fact that they are being used in a variety of sophisticated applications. Despite the fact that contemporary GIS capabilities are based on a different file-based approach, they are vastly different from the conventional spatial data choices available as shown in Fig. 7.

A New Conceptualization of Spatial Information
The of Meta-model spatial Information based on the four components are essential to the re-structure of every web application: a database system, a mapping system, a communication system, and a geographic analytic system.
This new conceptual model consists of functional components known as the spatial system. A feature must be supported by at least one application, and the rectangle boxes that link the features together appear in the illustration to demonstrate this real usage context. Interaction occurs on the user's own computer, as shown by confirmation of the data buffers (client computer). Developers will be able to route all of the content and also to enhance geographic data. These actions, among others, will all be possible by using this method. The buffer will stay in effect indefinitely after the time restriction has passed.
Essential
critical factors to take on consideration the particular ties of having a differ usage clients simultaneity . If users engage with one other, they will be interacting in real time. In order for the user's computer interaction with the system to be effective, the client computer is the only one that is capable of plateful provide by main server. moreover has been discovered that spatial decision support design transfer will be made possible again via animated cartography . Every time new changes are made to the online transmission, it is under the supervision of the meta-model concept. The design contains the spatial information of the meta-model and solution in the form of layout patterns, which is a specific type of client-server system. Information technology architecture is designed using a three-layer structure: a geographically based architecture; a communication-based architecture; and an analytical-based architecture, which are based on different locations; applications, which depend on communications; and applications, which make use of analytical methods. The geographical contact of computational intelligence practitioners is highest when they use computational intelligence. The user will have to make use of an HTML or JavaScript web interface in addition to a CSS or HTML development framework when a link is clicked.
In certain situations, creation logic for application layers may be described as application layer logic that is included into the computer's intelligence layer or middle layer. Logic is built into the computer's machine learning margined with artificial intelligence layer. The connection between the display layer and the data layer that facilitates improved communication is referred to as a link between the visual mapping and spatial decision-making processes#, Java, C++, Python, Ruby, and other API-accessible objects, as well as other programming languages and libraries, are all common code ingredients.
According to [47], space data is also known as spatially linked data and geospatial data, and these terms may all refer to the same thing. It has been shown that geographic data characteristics seen through the lens of a database have somewhat different meanings than traditional definitions obtained from cartographic or mapping views. Spatial data are data that can be seen, queried, and analyzed in the context of geographic information systems, and they are data that can be viewed, queried, and analyzed by using a geographical characteristic that specifies a location on or near the Earth's surface. Spatial data are data that can be mapped, searched, and analyzed using geographic information systems. When defining a specific geographical feature, the location and shape are often defined in terms of coordinate pairs (x,y), which allow the position and form of a given spatial feature to be measured and graphically represented on a map.
Most spatial data is stored in two forms, as illustrated in Fig. 8: vector and raster, which are referred to as vector and raster, respectively.
The characteristics of spatial data from a database perspective has a somewhat different meaning from the conventional definition that stems from cartographic or mapping perspectives as indicated by
Figure 8 Spatial data are data that can be mapped, queried and analyzed using a spatial attribute that denotes a location on or near the surface of the Earth. This spatial attribute is normally presented in the form of coordinate pairs (x,y) that allow the position and shape of a particular spatial feature to be measured and represented graphically on the map. Spatial data are stored fundamentally in two forms which are called vector Fig. 8.

Types of Spatial Data Yeung and Hall [47]

The spatial attribute is presented in the form of coordinate couples (x,y) that permit the geo-location besides shape of a specific spatial feature to be unhurried and signified graphically on the map
According to [47], space data is also known as spatially linked data and geospatial data, and these terms may all refer to the same thing.It has been shown that geographic data characteristics seen through the lens of a database have somewhat different meanings than traditional definitions obtained from cartographic or mapping views. Spatial data are data that can be seen, queried, and analyzed in the context of geographic information systems, and they are data that can be viewed, queried, and analyzed by using a geographical characteristic that specifies a location on or near the Earth's surface.Spatial data are data that can be mapped, searched, and analyzed using geographic information systems.When defining a specific geographical feature, the location and shape are often defined in terms of coordinate pairs (x,y), which allow the position and form of a given spatial feature to be measured and graphically represented on a map.
Most spatial data is stored in two forms, as illustrated in Fig. 8: vector and raster, which are referred to as vector and raster, respectively.
2.3 A functional perspective of spatial data
In a spatial database environment, it is logical to classify data according to their respective functions in database management and application as shown in Fig. 10. There are four categories of spatial data in a functional classification, namely.

A functional classification of spatial data [46]
2.4 Web mapping tools and technologies
Web mapping applications are currently available through most of the web service provider such as Google, Yahoo, Microsoft and another initiative by a different provider such as Map Server, OpenStreetMaps, ArcGIS Online, GISCloud.com and such. Web mapping application is an application which concerns with spatial data visualization by GIS [34, 49] mostly as either raster images or as vector graphics stored in the spatial database and through the use of API accessible by using Internet browsers Fig. 11.

Vector and raster data
A raster map is similar to an image plot on a grid of pixel of a display device such as a computer screen, television or mobile screen. Whereas in vector maps, the spatial data attributes of a map features are plotted by using points, polylines and polygons [23] as shown in Fig. 11.
Gis Software is a technology (Hybrid cloud) interface that stretches beyond map creation to facilitate geographic data analysis. Adaptive Maps is designed in sequence with the "less-is-more approach" of Jones, Haklay, Griffiths, & Vaughan 2009. Carto Builder is an infomercial application that enables basic to medium level data analytics capabilities to evaluate geographic datasets. Public Google Data.
In recent years, web-based mapping applications have gained popularity due to the general public interest and involvement in web cartography which is called crowdsourcing and free web-based mapping applications that use a set of different technologies [37]. The Fig. 12 represent The Xerox parc viewer as reference of earlier web mapping applied in American cartography as experiment in providing to interactivities information rather than simplest access to statically model and files world word used in different filed such as health care and death per state assist illustration in Fig. 12.

Analysis of the ecological conditions of desert locust breeding regions Algeria in northern Mali and northern Niger.2020 https://asal.dz/?p=3115
Algerian Space Agency used and analyzed the Alsat satellite images open access data to identify the ecologically favorable zones for the development of the desert locust. This Open data portals have become a landmine for open geographic data sets worldwide. Existing thematic web maps are created by programmers and/or cartographers and therefore cannot be designed to be easily reused. This figures introduces a semi-automated method that can be used by users to create thematic network maps without prior map training. It was implemented as a network model and evaluated by Algerian government to deliberate wide user refer to Fig. 13.

source Algerian Space Agency used and analyzed Alsat satellite images to identify the ecologically favorable zones for the development of the desert locust. Five (05) Alsat-1B satellite images covering an area of 142,382 km2, were programmed and used to assess the ecological conditions of these regions. The treatments carried out made it possible to develop space maps intended for the evaluation of the ecological condition of locust biotopes. The maps will support decision-making during the forecast period and will allow the deployment and effective intervention of field teams during phytosanitary treatment. The analysis of ecological conditions in the regions of Tin Zaouatine, in Hoggar, northern Mali and northern Niger has revealed the following. The ATLAS case index provider preserves access to both current and virtual incidents. Map files are used for storing event index data. The evolution of future systems to a modern event indexing architecture based on Apache Phoenix was identified. There is a need to extend to a more general context in order to make fresh access to experience data simpler
X Map Viewer reflect as one of original map viewer that providing the interactive informations rather than simple not dynamic files
2.5 Web-based mapping
Web-based mapping visualizes spatial data over the Internet. Li and Wang [28] visualizes the spatial data of the states of Malaysia using Google Maps as shown in Fig. 13. Public interest in web mapping leads to mashups. Mashups is an application that integrates various spatial or non-spatial data sources to create new GIS using open APIs by the general public.
Maps API the Javascript code in Fig. 14, enclosed in tags are all there is to actually call or rather use Google Maps API to generate Google Maps on a client browser. Different web mapping service providers such as Google, Yahoo, Microsoft, OpenStreetMaps and others have different API for a user to call and use. But basically, several of the APIs have quite a few similarities because the fundamental language used is Javascript.
2.6 Mobile-based (app) mapping
Apart from web mapping services which now predominantly web-based, the mobile-based platform also flourishes, and Nokia with its Navteq has already made its mark on smartphone users for its Nokia Map (formerly known as Ovi Maps) as shown in Fig. 14. Android or iOS platform, to date, still rely on Google Maps on its navigational application [24].
2.7 Application programming interface (API)
Web mapping applications nowadays are easy to develop by simply using API which, most of the time but not always, provided free for use for the public by the web mapping service provider. Back then the development of a web-GIS application (such as MapServer or ArcIMS) required programming skill and server management (T. Holdener [22]).
Only recently, through the API, users have access to very high-resolution spatial data which includes web maps, satellite imagery, low-flying aerial imagery and street photography. APIs are relatively easy to use by the general public and thus made web mapping application more rapidly developed, which leads to the collaboration of mash up .
Refere to Fig. 12: Google’s API (Source: Google).
API is consist of Javascript files that contain classes with methods and properties that you can use to tell the map how to behave [42]. Refer to Fig. 12, in Google’s API case, it sits between spatial data of imagery source data, vector source data and terrain source data, and, users using Google Maps or Google Earth application.
For a simple demonstration of an API, the implication of the usage of JavaScript in Fig. 15 used to generate Google Maps in its simplest form by a few lines of JavaScript code.

Map of States in Malaysia using Google Maps Google [24]
It is also noteworthy to look at the empirical study of Google, Yahoo and Bing’s API, it shows that Google’s API performed the fastest, followed by Bing and then Yahoo based on response time and display time [13].
2.8 Web-GIS framework
GISs can be built using open source software, proprietary (license required) software, or a combination of the two [3]. GIS architecture fundamentally consists of several of four major components as shown in Fig. 14 [47].

Generic Architecture of a web-enabled spatial database system
Web-enabled spatial database systems are database systems designed especially for access over the Internet using the World Wide Web (Web) protocol. These systems combine the spatial database and Internet technologies to provide a distributed and network-centric approach to spatial information. They are increasingly used not only to enable external access to enterprise information by clients and business partners but also to support internal business operations such as data sharing among project teams and work groups at the same or different locations of an organization.
On another hand, the system proposed by [5] for web mapping application is an open web platform for spatial personalization and visualization shown in Fig. 16. The architecture of the system proposed is structured in 3 tiers: client tier, middle tier and data sources. This approach emphasizes the independence of the various components of the system that can be deployed and combined in different contexts [5]. Figure 16 illustrates the interaction between tiers, outlining the main components of the system and their logical position. The following sections describe these tiers in detail as Client tier: User interface) Middle tier: Web application server and GIS server and Database source tier: Spatial database [1].

Three-tiered architecture mapping from data source to client interface user
2.8.1 Client tier: user interface
Client web browsers: Interaction with the web-GIS generally done through web browsers such as Microsoft IE, Mozilla Firefox, Google Chrome and many others such [10].
Desktop software: Used for complex spatial data manipulation and visualization tasks with a direct connection to the GIS server. This is most prevalent in desktop GIS software such as ArcGIS, MapInfo and AutoCAD.
Mobile devices: Most smartphones nowadays support GIS application on several platforms mainly Symbian, Android, iOS and Blackberry Fig. 16.
2.8.2 Middle tier: web application server and GIS server
HTTP server: The Web server that processes the HTTP requests from the client which can be among the most popular ones are Microsoft IIS, Apache, Adobe ColdFusion, Oracle iPlanet Web Server etc.
Application server: Contains the Web application and supports client-side APIs (such as JavaScript) and server side logic (such as servlets, ASP.Net, PHP, Enterprise JavaBeans (EJBs)) to invoke GIS server tasks.
Database connection: MySQL ODBC, SQL Server ODBC, Java Database Connectivity (JDBC) or Open Database Connectivity (ODBC) API to connect to the database.
Provides visualization, spatial data analysis, mapping, and spatial data management services. It also serves georeferenced map images over the Internet that are generated by a map server using data from a GIS database.
2.8.3 Database source tier: spatial database
The database for GIS is normally a database server to store and provide access to spatial and nonspatial data. Database normally used are MySQL, PostGIS, Oracle, SQL Server or any database that has spatial feature. The architecture in Fig. 16 is a standard 3-tier architecture, where user interface, middleware (Web application server and GIS server), and database components are modularized.
2.9 Geovisualization of spatial data for election
Democratic Countries in the world depict several geovisualization of spatial data for election across different continents such as Africa, Europe and Asia. There are only electoral boundaries geovisualizations for every electoral map. Apparently, no geovisualization of voters included on the map.
Nonetheless, analysis and interaction features are provided for a user to explore spatial and non-spatial data on the polygons drawn on the map, which are the electoral boundaries. Pre-election predictions and post-election results are the main themes for the geovisualizations. Interactions by zooming, clicking, map-style changing and searching of electoral information are evident on the electoral web-based map interface refer to Fig. 17.

Web-GIS for Electoral Information System in Selected Democratic Countries in different continents America –Africa, Europe and Asia
3 Methodology
The discussion of the methodology in focuses for archiving the Electoral Information with its plot for geovisualization. An illustrative case of Web-GIS development to be presented.
3.1 Case study
This research as opposed to other empirical study techniques during the initial part of the project. Case study as an empirical strategy normally studies a real project, and hence the situation is “typical”. Case studies are used for monitoring projects, activities or assignments. Data is collected for a specific purpose throughout the study. A case study is an observational study while an experiment is a controlled study [2]. Case study for this project involves studying several similar projects in electoral web-GIS especially in democratic countries. The visualization of the electoral constituencies and voters is the main concern for this case study.
Research on the political constituencies and an electoral roll of voters in Malaysia must also be done before the project development commencement. Drawing of constituencies in Malaysia involves three levels which are Parliament, Dewan Undangan Negeri (DUN) and Daerah Mengundi (DM). Voters’ data in its raw and tabular format, together with the digital map of constituencies will be obtained from the relevant authorities.
3.2 Spatial data modeling
Spatial data is used to represent points, polylines, and polygons on a surface which relates to actual physical locations on Earth so that they can be described a geospatial data. The geography data type provides a storage structure for spatial data that is defined by latitude and longitude coordinates. By storing spatial data in relational tables, the spatial database makes it possible to combine spatial data with any other kind of non-spatial data; this removes the need to maintain a separate, dedicated spatial data store and enables high-performance queries that do not need to combine data from multiple external sources as in Fig. 18 above.

Spatial data is used to represent points
Database design for spatial data of constituencies and voters in Malaysia involves identifying the several entities and attributes in this research. McCarthy and Thatcher [30]. Proposed a spatial database model which will be used throughout in this research as presented in Fig. 19. Modelling for this project:

Spatial ER Database Mode In urban and simple user as unite
3.3 Data collection
The data collection for this research is sourced from two main different providers which are the EC for an electoral roll of voters and Jabatan Ukur dan Pemetaan Malaysia (JUPEM) for the constituencies’ spatial database as shown in Fig. 19. Application for the official approval from relevant authorities as the owner of these data is forwarded through the faculty and research supervisor.
3.4 Web-GIS development
A GIS system must be conceived, planned and taken through a series of analysis, design, testing and implementation steps to reach the points that are turned on and put to use (B. Pick 2008). A standard set of system development phases as in Fig. 20 can also be applied in GIS.

System Development for GIS [25]
According to [35], there are a wide variety of choices for software development methodologies that can be categorized into two large types:
The traditional methodologies (Waterfall, Spiral, Unified Process, Rapid Application Development, etc.) are derived most often from the methodologies used in industrial engineering or civil engineering (i.e., building and public works sector).
The agile methodologies, of which the most popular are Extreme Programming XP), Dynamic Software Development Method, Adaptive Software Development, SCRUM, and so forth. Their major characteristics are their potential for adaptation and common sense in action Continuous Integration Unified Process used for GIS development cycle stage based on planning analyses, design and finally implementation maintenance and integration. Fig. 21.

Continuous Integration Unified Process
Miralles et al. [35] designed a new methodology to realize GIS more easily and more interactively, called the continuous integration unified process as shown in Fig. 21, which the new method is an extension of the unified process method incorporating some practices of the extreme programming method. The definition of the new method as define “the continuous integration unified process method superimposes, on the main cycle of the unified process method, a cycle of rapid prototyping, which is provided with a process automating the evolution of the models from the analysis to the implementation” [35]. This methodology generalizes the Model Driven Architecture (MDA), which is a software design approach proposed by the Object Management Group (OMG) with the objective of improving application developments. This approach refines the models into three types of models: the analysis model, the preliminary design model, and the advanced design model. The first one is used to analyze the system with the actors, the second one is dedicated to the concepts coming from a domain in relation to the studied domain (point, line, or polygon from geomantic domain, for example), and the third is specialized for the description of the computer concepts or models independent of the programming language [6]. The representation of the Table 1 summarize the Sources of Data Collection into categories such as surface, skeleton analyses, structure source and the strategic used in specific visualization. In addition the Table 1 cluster the web map beside interface and web display layer.
3.5 Sources of data
Geographic data is related to the question of whether they were collected specifically for the research purposes of the researcher himself. If so, we call the data system. One example is a geographer who conducts interviews about people's attitudes towards agriculture using biological engineering technology. Alternatively, if the data is collected for other purposes, usually by someone other than the researcher, we call it seconds. An example is a geographer who used Land sat imagery to study landslides off the coast of California. These photographs were not collected by the investigator and were not actually collected to investigate the avalanche. The main benefit of preliminary data is that they are collected specifically for specific research, which means that they may be the most appropriate data to answer this question. In the example above, the geographer will specifically design the questionnaire to address attitudes towards biological and agricultural engineering, including adaptation to suit those who answer the questionnaire and where they live. However, doing this job well takes a lot of time and energy. On the contrary, the main advantage of secondary data is that it is sometimes the only moderate data that can be used to solve a specific research problem. In addition, secondary data is always cheaper than primary data (in terms of money, time and effort). In one devastating example, a geographer will receive a lot of data for free, which can be obtained in an hour or less, depending on the geographic analysis unit, but the geographer must obtain the Landsat satellite collection. Through a picture. Secondary data is usually cheaper (in terms of money, time and effort) than primary data to investigate the problem of analyzing the scope of available data sets. Geographers can directly awaken and document human behavior (similarly, bio geographers can awaken animal behavior) Quantitative data consist of values measured at least on a regular basis. Qualitative data are non-numerical values or, like nominal data, numerical values without quantitative significance. The calculation model applies to physical geography and human geography. They can be perceived conceptually, physically, graphically or mathematically. Scientists and early humans were undoubtedly heterogeneous in their experimental methods. They used everything they thought they had deep insight into. According to geographers, this is still the preferred method. This is a necklace that can connect up to two sharp types Quantitative method is a method that imposes a relatively large amount of a priori structure on the collected data. On the other hand, quality methods are a clear precedent for data collection. Very clear quality data collection can start with a number of research topics or questions. Combinations and variables, especially the proportional values of the variables, are determined during or after excitation. The data collection method (in this case, explicit reporting) can be used in a relatively quantitative or qualitative way. Not only do researchers use numbers, but also whether the data is collected quantitatively.
4 Result and analysis
This research describes the effort done in getting perspectives from the subject matter expert (SME) and focus group in relation to this research, prior to the web-GIS development. Furthermore This research adopts this new methodology for the development as opposed to the other conventional methodologies as it is best-suited to realize the research deliverable.
Qualitative research for this project in which an individual or a group of people are asked about their perceptions, opinions, beliefs, besides attitudes towards the concept before idea pertaining to the web-GIS is done exhausting two methods which are interview plus focus group. Questions are asked in a personal environment or in an interactive group setting where participants are free to talk with other group members.
SMEs interviewed are Dr Rosmadi Fauzi from Faculty of Art and Social Science of University of Malaya (UM), Dr Zuraidi Ishak from UMNO Headquarters and Mr Rosman Salleh from SPR (Suruhanjaya Pilihan Raya) or EC of Selangor for their professionals’ opinions on the project.
A group comprises of ninth students of Master Science of IT, Faculty of Science Computer and Mathematics, University Technology of MARA (UiTM) including sixth students of Faculty of Art and Social Science of UM were selected for the focus group.
Requirements for the students to be eligible are Malaysian citizen and registered voter of SPR. This is to ensure the results of findings from the focus group are relevant and accurate to the research itself.
4.1 Requirements of electoral geovisualization
Requirements gathering of electoral geovisualization has been conducted in two (2) iterations: ME Interview; and Focus Group. The subsequent sections elaborate the requirements gathering iteration in details.
4.1.1 Analysis of SME interview
Interviews with three SMEs in their respective fields which are Dr Rosmadi, Dr Zuraidi and Mr Rosman yielded several important points for consideration before the web-GIS development commencement as shown in Table 1.
Table 2 and model in Fig. 22 above describe how features and functions of the web-GIS derived from the SME confirmations. According to Dr Rosmadi, with regards to the current political-based web-GIS scenario, there is a need for geovisualization of electoral constituencies and voters through the Internet as what has been done in several democratic countries such as US, UK and recently in Taiwan to facilitate general public access to data and information about the electoral domain. This will educate the public in general and voters specifically of the political boundaries and inform voter’s location on the map for validation [11].

Modeling of SME View Analysis
Web mapping technique is suitable for this scope as geovisualization through the use of API of the map service provider can accelerate the estimated delivery time of the prototype. Spatial data of the constituencies coordinate will have to be stored in any form of database such as MySQL, SQL Server, XML etc. and through the API, the coordinates will later be presented in any web-based map such as Google Map as polygons. The same drives for the circumstance of voters’ particulars, talks and polling districts where geocoding will help visualize the data in points form whereas Dr Zuraidi mentioned, geovisualization of electoral constituencies and voters through web-GIS will greatly accommodate the need to have logistic planning and voters’ voting behavioural study pre and post-election. This is beneficial for interested parties where visualization of data in graphical format is easier to present and understand as opposed to textual and number format. As for now, no visualization over the Internet of the electoral constituencies have been done for the public to access and relying on the paper-based electoral map is out-dated and inefficient.
Another interesting point of view is that, with the help of the coincident electoral constituencies’ polygons and voters’ points, much can analysis can be derived from the web-GIS itself. Among them is to see the distribution of voters in any particular constituency, to validate voter’s location, to derive demographic features of the voters with relation to the constituency, to locate any particular constituency on the map with easy to use a navigational method such as click, zoom, pan etc.
The search feature of the web-GIS should also be incorporated to assist information found by the public. Dynamic drop-down list of constituencies will help the public to search for any constituency of interest to them. Looking up voter’s point of location on the map can also be done in a textual search by providing a form on the interface [20].
4.1.2 Analysis of the focus group session
The features and functions of the web-GIS derived from the focus group confirmations. A focus group of 15 students gave their perspectives with regards to web-GIS application that should provide election-related information to the general public and other interested parties. According to the perspective of UiTM’s focus group, it should be a single application that can be used by citizens on a desktop PC, mobile phone, and tablet device. It offers a map-based view of electoral constituencies and voters that allow users to locate a constituency or an address or voting precinct and voter’s location where an information popup for each boundary and point is made available.
This application provides 24x7 access to the organization and supplements other methods used to disseminate election information. The web-GIS application provides interested parties with an easy way to discover election data in graphical format. To do that, they can enter their constituency name or click, zoom and pan on the map to find a precinct.
With regards to the perspective of the UM’s focus group, the web-GIS application should also be able to disseminate election results configured to use the data from post-election results in times of general election or by-election. With the help of a geovisualization, it can hinder baseless accusations to SPR in the issues of political-motivated in redrawing of electoral boundaries and phantom voters. In turn, this can help SPR to have a transparent and non-partisan reputation to the public [49].
4.2 Web-GIS functions and features
A web-GIS mapping functions and features acquired from the interview and focus group research can be summarized into two important elements. With regards to voters, the web-GIS should provide information to voters on polling place locations. Through geocoding and address matching processes, address information in an Electoral Roll can be pinpointed on the map. The capability to see where registered voters reside is useful not only for constituency management decisions but also for a process called “voter cross-checking” that should be an early step in developing a nationwide voter registration database.
4.2.1 Voters
Geocoding voters' addresses is the best way to maintain an accurate and up-to-date nationwide voter registration system. With the help of web-GIS, the geocoding process assigns latitude and longitude coordinates to each address, thereby standardizing how voters' addresses are represented in an Electoral Roll.
Addresses can then be matched against streets on a digital map. After mapping voters' locations, constituencies can be overlaid or redrawn while keeping an accurate account of voter assignments. Voter points or addresses can be color-coded so that invalid constituency assignments can be easily identified.
4.2.2 Constituencies
Web-GIS generates constituency maps showing the physical locations of political boundaries which are DM, DUN and Parliament which are a coincidence to the administrative boundaries, States as polygons on the web-based map. By a click of the mouse over the map, the information is made available to the user. The information contained includes the parliamentary, DUN and DM data.
4.2.3 Requirement specification of electoral web-GIS
Functional requirements capture the intended behaviour of the web-GIS application. This behaviour is expressed as functions the application is required to perform. There are eight (8) functional requirements identified during interviewing SME and focus group for their opinions.
The functional requirements for the electoral web-GIS application can be conceptually divided into two, which are visualization and interaction. The input item on the functional requirement is the data or action required for the geovisualization whereas the output item is the result of geovisualization on the input data.
The model allows us to describes how spatial data modelling of electoral constituencies and voters are interpreted and modelled with an adaptation of Calkins’s spatial data modelling in this sections. Each Parliament has DUN coincident in its area. And followed by each DUN has DM coincident in its area. The spatial data type for these areas is in polygons when mapped.
Eventually, the voter is assigned to every DM, and every voter is points when mapped to its related polygon of Parliament, DUN and DM.
Designates entities and attributes in the spatial data model above. For Parliament, DUN and DM, the spatial data type is on the geometry attributes whereas, for the voter, the pseudo-spatial data type is on the address attribute.
4.2.4 Use case of electoral web-GIS application
The diagram in Fig. 23 depicts the overall use case construct which is used to define the behavior of the web-GIS application entity without revealing the entities internal structure. Each use case specifies a sequence of actions, including variants that the entity can perform, interacting with actors of the entity.

The important and innovative step to bring Cloud Computing to GIS
5 Construction of electoral web-GIS application
This section explains in great details of how the electoral web-GIS application work done in developing web mapping application using several tools at the author’s disposal and techniques in translating semantic to the syntax of how the web-GIS project’s objective should be achieved.
Typical web application phases or stages according to [38]. The development of a web application is a multifaceted activity, involving not only technical questions but also non-technical issues. Due to the complexity factors of web application development, many software vendors are providing instruments for supporting the construction of new applications or the migration of existing ones. Notwithstanding their common goal, the available products greatly diverge in many aspects, which reflects different conceptions of the nature of a web application and its development process.
5.1 Cloud-based GIS
The emergence of cloud computing provides many opportunities as an information technology revolution. GIS, as a powerful spatial analysis tool, has been successfully used in many fields. However, today's Geographic Information Systems also face many challenges. Certain cloud computing-based map services have also appeared in the market.
Google Maps and Google Earth are two popular cloud-based map products. They provide fast and user-friendly map query and display functionalities to massive numbers of public users. The backbones of these two systems are supported by Google's cloud infrastructure, namely Google File System and Google Big Table. This is an important and innovative step to bring Cloud Computing to GIS (Kang 2011) Fig. 23 as an innovative step to bring Cloud Computing to GIS.
Refereeing to Google Fusion Table mention on Fig. 24

Google Fusion Table (Table View)
directly navigate and modify the visualizations, as well as select subsets of the data for further operations which include interactive filtering, interactive zooming [31].
Construction of the electoral web-GIS application can be divided into several phases which are the geovisualization of Parliaments, DUNs, DMs and voters. Data collected from JUPEM and SPR Selangor consisted of shape (.shp) files for polygons of states of Malaysia, constituencies in Selangor and tabular (.mdb) data for points of Selangor voters.
Desktop GIS and web publishing software are two of the used in the prototyping of web-GIS for this research. PitneyBowes MapInfo Professional for desktop GIS and Adobe Dreamweaver CS5 for web publishing are among the commercial software of choice for this research, which is available in the market.
5.2 Construction of electoral web-GIS application
The construction of the electoral web-GIS application for this research is stressed into two elements which are visualization technique and interaction technique. The visualization technique used may be classified as standard 2D/3D displays, and interaction techniques allow users to
MapInfo Professional is needed to process the shape files into Keyhole Markup Language (KML) which is the format supported by Google Fusion Table. Each file of Parliaments, DUNs and DMs then uploaded to Google Fusion Table for storage using its Table data type. Once uploaded, the KML file then can be straight away visualized to Google Maps as polygons through its location-based features [7].
The electoral roll is a different matter altogether, the tabular data was edited using Microsoft Access and exported to Excel for further editing. The files are saved as CSV file format as Google can only support CSV file format for upload. The CSV file is then geocoded to produce points or markers on Google Maps which will show the location of voters with relation to their addresses.
5.3 Geovisualization technique
This section discusses the geovisualization techniques of electoral constituencies and voters during the construction of this electoral web-GIS application.
5.3.1 Geovisualization of all constituencies
Initially, geovisualization of all constituencies in one Google Maps is done by integrating 4 layers of spatial data as shown in Figs. 25, 26 and 27. They are namely States in Malaysia followed by Parliaments, DUNs and DMs in Selangor. The layers will change accordingly with regards to the zoom level by the user. At certain zoom level only the state layer will be shown, and further down, the Parliaments will appear while the state layer disappears and so on. This is to avoid cognitive overload and data transmission bottleneck when the user is navigating the map.

Google Fusion Table (Map View)

Web-GIS Application Snapshot of Geovisualization of All Constituencies

Prototype Snapshot of Geovisualization of Parliaments
5.3.2 Geovisualization of duns
Geovisualization of DUNs in Selangor is as shown in Fig. 28. The Javascript codes are as shown below which was written using Adobe Dreamweaver CS5.

The Javascript codes are as shown below which was written using Adobe Dreamweaver CS5.
5.3.3 Geovisualization of DMS
Geovisualization of DMs in Selangor is as shown in Figure The Javascript codes are as shown below in Fig. 29 which was written using Adobe Dreamweaver CS5.

Web-GIS Application Snapshot of Geovisualization of DUNs
5.3.4 Geovisualization of voters
Geovisualization of voters in Selangor are as shown in Fig. 30 in general and Figs. 31, 32 and 33 respectively for gender. Demographic attributes of voters are quite limited concerning the data collected from SPR Selangor. There is only one usable demographic feature of the data which is gender apart from Name, MyKad No, address and election-based information [41].

Web-GIS Application Snapshot of Geovisualization of All DMs

Web-GIS Application Snapshot of Geovisualization of Voters

Geovisualization toward Web-GIS applied for algorithm 1 with data of Voters of the Selangor malaise

Web-GIS usage of algorithm 1 via Geovisualization of Voters for both east and west Malaysia
Voter’s point then mapped to Google Maps according to voter’s gender by using different icon and colour for differentiation. The Javascript codes are as shown below which was written using Adobe Dreamweaver CS5 Fig. 34.

Web-GIS of Geovisualization of Constituencies and Voters
6 Artful mathematical model used to map out the plot
Let Ω Encompass all that must be inside an administrative region, whether it has any connection to the outside world. β (x, y, t)-β (ζ, η, t ). However, only high-value are electronically considerable compering to to low-value that will not in the opposite direction. so the definitions of G Where is considered dote in a region with asscoted vfactore or features as G(x,y;ζ,η,t) as defined with
is more appropriate to express the gravitational factor of localization difference. When the with individuals at the point (x, y) is higher than the point (ζ, η ), G (x, y; ζ, η, t) = β (x, y, t)-β (ζ, η, t); and when the individuals elected the same value point as at the point (x, y) is different than the point (ζ, η ), G (x, y; ζ, η, t) = 0. In order to elaborated an adjustment role, the gravity factor uses G μ (x, y; ζ, η, t ), where μ is the parameter. From t to t + 1, the population at point (x, y) is attracted by the surrounding high-values points (ζ, η). Another factor is the number of people allowed to change their localization due to content factors such as work or other mobilization factors.
in at point (ζ, η) θ (ζ, η, t ), so the population diffusion potential from point (x, y) to point (ζ, η) can be expressed as
where: D (x, y; ζ, η, δ, ν) is the distance increasing function, which can be rδ(x, y; ζ, η) or eνr(x, y; ζ, η) or rδeνr, etc.; δ, ν are parameters, 0≤δ<2.
Then the point G(x,y) performs a circling motion
Using the following double integral, we can calculate the total capacity of dispersion:
Similarly, from t to t + 1, From the low-value point, the entire potential for population agglomeration is calculated. (ζ, η) around the point (x, y) to the point (x, y) can also be used from t to t + 1 The double integral of the surface denotes the following:
Then from t to t+1, the point (x0, y0)may be able to move in the anticipated population should be equal to the total of the population spread from the low-value electronically point to the high-value electronically point. (x, y) around it to the point (x0, y0). For a specific point (x, y ), to the point (x 0, y 0) The diffusion potential of) is G μ (x 0, y 0; x, y, t )θ (x 0, (, ;Ζ ,η,,) Dxy δν
There is population flow; (x, y) in which is the coordinate of the inner point of (Ω); t in which is the time change
Quantities.
Set the following function to be executed: u (x, y, t) is the individual who is present at the time of t. (x, y)
Density of the mouth; (x, y, t) is permitted at the position (x, y) between t and t + 1.
The number of people who moved to eleceted in; (x, y, t) is the point (x, y) from t to t + 1; (x, y, t) is the number of people who moved to elected in;
There is a limit on the number of individuals who may emigrate; x, y, t are the coordinates of the time interval from t to t + 1.
Total diffusion potential G(x0,y0;x,y,t)θ(x0,y0,t) per capita income at point (x, ); (x, ,t) is the period from t to t 1 y φy + Dx0y0xyδνf Expansion of the proportion of xyt force
There is the number of individuals who may mobilization during the electoral votes is ; β (x, y, t) is the period from t to t + 1 y 0, t )/ D (x 0, y 0; x, y, δ, ν), it occupies the point (x 0, y 0) and the total diffusion potential Gμ(x0,y0;x,y,t)θ( x0, y0, t) The lower electric voter point (x,) that consider as bot interested or in not selected factor to following up in this case ; (x,, t) is the period from t to t 1 y φy + Dx0y0xyδνf expand xyt.
To sum up, the expected total value of votes at the point (x 0, y 0) from t to t + 1 can be expressed by the following integral:
Similarly, the point (x0, y0) is expected to move out in the same time period .
The proportion of force is G (,;,,,)(,,). Therefore, amount of individuals who relocate from one location to some other (x, y) to point (x0, y0) is Gμ (x0, y0; x, y, t)θ(x0, y0, t)α(x,y,t) D(x0,y0;x,y,δ,ν)f expand(x,y,t ).
Finally, a prediction model of this type may be used to estimate the expected movement volume at the point of ingress. (x 0, y 0) from t to t + 1 The following integral may be used to explain this idea in more detail.
Individuals' natural electoral votes in a growth rate of this magnitude were observed during the period of the observation.
(x, y); r(x, y; ζ, η) is the linear distance from the point (x, y) in Ω to the point (ζ, η). The set voted group at the point (ζ, η) inside Ω to the point (x, y) is mainly affected by the difference in opinion or ideologies influence other parameters . Simultaneously, the number of individuals who may be eligible to vote at this time is likely to be limited. (ζ, η) and the point (x, y) are allowed to be used
Another element to consider is the number of individuals who will be voting in such the region, as well as the distance between the two neighboring areas or zones.
In this way, the population migration model in Ω can be expressed as
7 The problem with spatial dynamics model for simulating
Modeling of electoral across areas and districts regions, as well as between cities and towns, using spatial dynamics. This model is obviously a differential form for temporal variables and an integral form for spatial variables in terms of mathematical form. This form should be widely used in geographic study. It is natural complicated and very hard to grasp that spatial simulations have an impact on space zones. Variables (x, y) will have smooth properties such as continuity and differentiability, making it difficult to describe the spatial distribution characteristics of geographic simulations using differential equations.
Discretization of the theoretical model for practical use, the spatial variable (x, y) may be decentralized. For this reason, the region, the region Ω is divided into N small areas, Ω1, Ω2,..., ΩN. The idea of division should be founded on administrative reasons.
In this manner, the average population density may be used to indicate the population density in each tiny region.
Let: Mi(t) be the total voter population at region\zone Ωi at time t; ui(t) is the average population density at Ωi at time t; θi(t) is the permissible number of voter in Ωi from t to t+1; αi(t) is from t to t+1 Segment the amount of individuals who are likely to voted; (t) denotes the time period beginning with t to t 1 Ωi βi+Ωi The voter per total inhabitant on the above; φ i (t) is the natural ratio of the votors with t rate rise on Ω i from t to t + 1; see the equation 7
in this way, when (x, y) ∈ Ω i, the entire potential of diffusion and the complete potential of aggregation
The force may be represented as :
The expected migration population of the area Ωi from t to t+1 is :
The anticipated number of voters should be:
Where:
It is easy to see that the function G (x, y; ζ, η, t) may increase the factors,
-
1.
If we think that a single voted per number of place residents cannot produce the complete final outcomes, we must incorporate other important factors.
-
2.
The modeling methods given here are broad in nature and are not restricted to population models.
The discrete voting model is represent in 14
Due to its ability to simulate the interaction mechanism of regional development and project such events in both rural areas and urban group development, the spatial dynamic model played an important role in the research process of both projects "The Interaction Mechanism of Comprehensive Development of Votes Areas and Urban Group Development," as well as the research process of "The Interaction Mechanism of Comprehensive Development of Votes Areas and Urban Group Development."
Using large amounts of data, we develop a new set of spatial dynamics models that simulate votes and connect temporal presentation and prediction in accordance with the pertinent results.
This is the result of a collaborative effort by students from the departments of geography, applied mathematics, and computer science, who worked in a challenging environment with a huge amount of data
8 Algorithm 1
The algorithm 1 illustrates the details of pattern visualization of spatial pattern constituencies: the main part of the algorithm of the spatial clustering-based colocation patterns.

Once occurrences of a colocation are not spatially situated in a single site, there would be numerous altitudinal representations for such colocation to signify these diverse spatial circulations. In this setting, the strategy is to connotation a clustering technique with the colocation visualization algorithm more precisely, instead of processing point based on the whole table instance of a colocation C, we partition this table instance in several clusters based on their spatial coordinate’s step 1.clustering). Then, each partition (represent typical location of instances of C) is used to construct a spatial representation of C based on the centroids method described in the previous subsection (step 2.centroids) and step 3 create the spatial pattern for the coordinate XYZvia merging step 1 and step2 for the seeking of regenerate the centroid refer to Table 2 for more explication Fig. 32 is consider as optimal visualization of algorithm 1 with data of Voters of the Selangor malaise.
8.1 Geovisualization of constituencies and voters
Finally, we arrived at the geovisualization of all constituencies and voters in Selangor then integrated into one Google Maps for a comprehensive view of the spatial and electoral data from SPR Selangor as shown in Figs. 35, 36 and 34.

Web-GIS of Geovisualization of Constituencies and Voters (Parliament Zoom Level)

Web-GIS of Geovisualization of Constituencies and Voters (DUN Zoom Level)
9 Comparison
9.1 Based the features and functions of the web-GIS
The features and functions of the web-GIS derived from the focus group confirmations. A focus group of 15 candidates gave their perspectives with regards to web-GIS application that should provide election-related information to the general public and other interested parties. According to the perspective of UiTM’s focus group, it should be a single application that can be used by citizens on a desktop PC, mobile phone, and tablet device. It offers a map-based view of electoral constituencies and voters that allow users to locate a constituency or an address or voting precinct and voter’s location where an information popup for each boundary and point is made available.
This application provides 24x7 access to the organization and supplements other methods used to disseminate election information. The web-GIS application provides interested parties with an easy way to discover election data in graphical format. To do that, they can enter their constituency name or click, zoom and pan on the map to find a precinct.
With regards to the perspective of the UM’s focus group, the web-GIS application should also be able to disseminate election results configured to use the data from post-election results in times of general election or by-election. With the help of a geovisualization, it can hinder baseless accusations to SPR in the issues of political-motivated in redrawing of electoral boundaries and phantom voters. In turn, this can help SPR to have a transparent and non-partisan reputation to the public [49] in Table 3 below.
9.2 Based approaches
Inclusive impartiality of rambling is the Web-GIS application depends on the parameters plot mapping of the study area depend on (the Equity index, integrated equity situation spatial equity of district, spatial equity of municipal). These factors accounts for the highest percentage of the accuracy or evaluation. Furthermore the mapping has evolved from traditional role in display equipment to a very interactive interface for accessing and exploring geospatial data. The human-centered aspect is very important to play an important role in designing future gadgets. The goal of creating apps for Geo-visualization a wide range of users remains a huge challenge. The Open API delivery method can be difficult for casual users, despite it is a convenient way for developers and data visualization experts. The newly added data from existing 2D data consists of detailed information on four types of plots: facilities for the disabled, centers, entrances, and subway and urban used. The 2D map consists of engineering information that includes the interiors of buildings created with absolute coordinates.
9.3 Web-GIS application election-related
Web-GIS application should provide election-related information to the general public. It should be a single application that can be used by citizens on a desktop PC, mobile phone. For customizing the mapping such voting machine or electoral visualizations based on Web-GIS generates constituency maps showing locations of political boundaries. Each voter is assigned to every DM, and every voter is points when mapped to its related polygon of Parliament. Map can be overlaid or redrawn while keeping an accurate account of voter assignments. It is useful not only for constituency management decisions but also for "voter cross-checking" that should be an early step in developing a nationwide voter registration database. The map is then made available to the user by a click of the mouse over the map and can be used to interact with the data. The API credible from government could help individuals obtain geo-data, doroute-planning tasks, the integration model can be tailored for other sustainable development cases, such as site analyses. Despite positive assessments from users confirming full access, the prototype is still in an early stage and needs further improvement. Developing new strategies will make it easier for operators to choose the scale of the data.
9.4 Specific details about the implementation
The Slow loading of large graphics files can handle their compression. Lossless algorithms are used when the image is treated as a one file as block. The proposes a specific alternative to database-based maps that use a lossless compression method. The open access "Theoretical and Applied Maps" and is open source and free to the public. Home page. "Maps on the Internet". The site. "Navigation on the map", "geographical portals". Geospatial analysis Geomantic, land and landscape. "Map navigation", "map navigation", "geographical portals", "web maps" 'Go on the map'. "Georports". Map navigation, "Map navigation". Geopartners 'Maps', 'Map Navigation', 'Map Analysis', 'Map Analysis', and Map Analysis with Normalization was performed with the help of zero uniformity, which uses the maximum and minimum values. This means that the values of the variables expressed in the statement. Specific details about the implementation of the optional GIS web the work is done with the development of web maps in several applications. Available tools and the interpretation of semantically techniques into grams. Typical phases or phases Development environment as described in applications for web development are a multi-layered strategy Not only a technical one but also non-technical problems. Many programs are being developed because companies offer supporting tools for the complexity of a web-based application. Despite their involvement objective,
10 Signification of this study
Interaction techniques provided for the electoral web-GIS application are interactive filtering and interactive comprehensives of mass votes. Using Javascript to compose filtering method, were the user can filter any constituencies or voters on the fly which means page need not resubmission to display dynamically changes on the map.
Selection-based filtering is provided on the vision to select Parliament [48]. DUN or DM polygon on the map and a snippet of Javascript coding of how the interactive filtering is constructed is shown Fig. 37.

Web-GIS of a Graphical User Interface
Whereas input-based filtering is provided on the page to select voter’s point on the map and a snippet of Javascript coding of how the interactive filtering is constructed is shown below :
For answering the main question how will geovisualization develop over the next years?
The clarification that usability requirements differ significant between researches tackles for specialists and public applications used in this regards the mass of non-expert users. Human-centered aspects are very essential to play a significant role in the design of future tools in order to sort for fitting the needs of their audience. In the upcoming, stationary perceive the map as the prime tool to modern, the usage, deduce, and comprehend geo-data. Nevertheless, it has become seeming in the past that the map can and will take a variety of forms, some of which quite astonishing. The map has evolved from its traditional role as a presentational device to an interactive and highly dynamic interface to access and explore geospatial data.
Another common feature pattern of current geovisualization tools is that they consist of multiple linked displays, each depicting an alternative representation of the mapping under examination to stimulate visual thinking. This will certainly remain a central aspect in visualization.
Concerning the tasks and users of geovisualization tools a transition from explorative, individual use by experts towards the whole range of tasks from exploration to presentation and heterogeneous groups of users is taking place. While individual expert tools will continue to develop, there will be an increasing
The goal of universal us- ability, i.e., creating applications for wide ranges of users from children to senior citizens in different languages and respecting visually disabled users, remains a big challenge.
Data collection from SPR Selangor tremendously helped the project as it is one of the most important elements of the prototype. Shape files for constituencies and tabular data for voters in digital format have made the data processing effortlessly easy to be done with the available but limited resource at hands as opposed if the data format was to be in hardcopy. Using the SPR Selangor electoral data, the third objective of this project which is to develop web-GIS for SPR Selangor has been fulfilled [17].
11 Future recommendations
This research proposes an option of solving the unavailability of a medium to disseminate information to the public through the use of web mapping merging with pattern visualization with regards to the electoral constituency’s includes voters of SPR. Nevertheless it still has room for improvements as noted through the construction of the prototype as listed below:
Google Earth can be used for further enhancement of the project which offers a 3D view to the map. Geocoding for Google Maps in Malaysia still has a lot to be desired. Some geocoded addresses for voters are incorrect. With better algorithms in future by Google, the result for voter’s location can be geocoded in an accurate manner.
Electoral roll from SPR is still inadequate and incomplete for some of the important attributes. The data needs to be processed by matching another source of data such as Jabatan Pendaftaran Negara (JPN) to produce detailed and well-interpreted data.
References
Abd Manap M et al (2013) A knowledge-driven GIS modeling technique for groundwater potential mapping at the Upper Langat Basin. Malaysia. Arab J Geosci 6(5):1621–1637
Ahlquist JS et al (2018) How do voters perceive changes to the rules of the game? Evidence from the 2014 Hungarian elections. J Comp Econ
Aras G, Crowther D (2008) Governance and sustainability: An investigation into the relationship between corporate governance and corporate sustainability. Manag Decis 46(3):433–448
Atallah RR et al (2018) Face recognition and age estimation implications of changes in facial features: A critical review study. IEEE Access 6:28290–28304
Ballatore A et al (2010) RecoMap: an interactive and adaptive map-based recommender. In Proceedings of the 2010 ACM Symposium on Applied Computing
Baldera MA et al (2017) Application template creation and management. Google Patents
Bao J et al (2015) Recommendations in location-based social networks: A survey. GeoInformatica 19(3):525–565
Blower JD (2010) GIS in the cloud: implementing a Web Map Service on Google App Engine. In Proceedings of the 1st International Conference and Exhibition on Computing for Geospatial Research & Application
Brovelli MA et al (2017) MIGRATE: A FOSS Web Mapping application for educating and raising awareness about migration flows in Europe. Int Arch Photogramm Remote Sens Spat Inf Sci 42:51
Calloway T, Megherbi DB (2020) Three tiered visual-inertial tracking and mapping for augmented reality in urban settings. In 2020 IEEE International Conference on Computational Intelligence and Virtual Environments for Measurement Systems and Applications (CIVEMSA). IEEE
Caramani D, Grotz F (2018) Voting rights in the era of globalization. Routledge
Chen P-H, Nguyen TC (2017) Integrating web map service and building information modeling for location and transportation analysis in green building certification process. Autom Constr 77:52–66
Clarke TB et al (2010) Recognition of peptidoglycan from the microbiota by Nod1 enhances systemic innate immunity. Nat Med 16(2):228
Dauda AB et al (2017) Effect of serialized messaging on web services performance. In 2017 International Conference on Computing Networking and Informatics (ICCNI). IEEE.
De Santis D et al (2018) Heavily calcified coronary arteries: Advanced calcium subtraction improves luminal visualization and diagnostic confidence in dual-energy coronary computed tomography angiography. Investig Radiol 53(2):103–109
Dooley KA et al (2017) Standoff chemical imaging finds evidence for Jackson Pollock’s selective use of alkyd and oil binding media in a famous ‘drip’painting. Anal Methods 9(1):28–37
Ghani MHA, Besar JA, Jali MFM (2017) Isu dasar kerajaan dalam politik pengundi pasca Pilihan Raya: Kajian kes DUN Teratai, Pandan, Selangor Darul Ehsan (Government policy issues in electorate post-election politics: A case study of the Teratai constituency, Pandan, Selangor Darul Ehsan). Geografia Malays J Soc Space 12(4)
Goossens J (2017) Electoral reforms in Belgium’s sixth state reform: Historic split of electoral constituency BHV, reform of the senate, and coincident elections. Election Law Journal: Rules, Politics, and Policy 16(2):316–324
Greene CA, Gwyther DE, Blankenship DD (2017) Antarctic mapping tools for MATLAB. Comput Geosci 104:151–157
Haruna K et al (2019) A soft set approach for handling conflict situation on movie selection. IEEE Access 7:116179–116194
Hernandez PA et al (2006) The effect of sample size and species characteristics on performance of different species distribution modeling methods. Ecography 29(5):773–785
Holdener, A.T., HTML5 geolocation. 2011: " O'Reilly Media, Inc.
Hudson-Smith A et al (2009) Mapping for the masses: Accessing web 2.0 through crowdsourcing. Soc Scie Comput Rev 27(4):524–538
Ibrahim OA, Mohsen KJ (2014) Design and implementation an online location based services using Google maps for android mobile. Int J Comput Netw Commun Secur (CNCS) 2(3):113–118
Kim K, Lee K (2018) Handling Points of Interest (POIs) on a Mobile Web Map Service Linked to Indoor Geospatial Objects: A Case Study. ISPRS Int J Geoinf 7(6):216
Kim JY, Eun SJ, Park DK (2018) Malaria vulnerability map mobile system development using GIS-based decision-making technique. Mob Inf Sys
Kotsev A et al (2020) From Spatial Data Infrastructures to Data Spaces—A Technological Perspective on the Evolution of European SDIs. ISPRS Int J Geo-Inf 9(3):176
Li W, Wang S (2017) PolarGlobe: A web-wide virtual globe system for visualizing multidimensional, time-varying, big climate data. Int J Geograph Inf Sci 31(8):1562–1582
Longley PA et al (2005) Geographic information systems and science. John Wiley & Sons
McCarthy J, Thatcher J (2011) Visualizing new political ecologies: a critical data studies analysis of the World Bank’s renewable energy resource mapping initiative. Geoforum
McMahon G, Kiem AS (2016) Major floods-random or irregular? In 37th Hydrology & Water Resources Symposium 2016: Water, Infrastructure and the Environment. Eng Australia
Matthews MJ, Wolfe DA (2017) Unified ranked sampling. Stat Probab Lett 122:173–178
MacEachren AM et al (2004) Geovisualization for knowledge construction and decision support. IEEE Comput Graph Appl 24(1):13–17
Milutinovic G, Seipel S (2018) Visual GISwaps-An interactive visualization framework for geospatial decision making. In International Conference on Information Visualization Theory and Applications (IVAPP'18), Funchal, Madeira-Portugal
Miralles A et al (2017) Alignement, union et intersection de modèles: 3 transformations pour l'analyse des systèmes d'information. In INFORSID 2017
Palka G, Serrhini K, Andrieu D (2018) How evacuation maps work: comparison of stakeholders’ visual strategies. Int J Cartogr 4(1):25–48
Paju M et al (2010) Framework and indicators for a sustainable manufacturing mapping methodology. In Simulation Conference (WSC), Proceedings of the 2010 Winter. IEEE
Read J et al (2017) The stellar mass–halo mass relation of isolated field dwarfs: a critical test of ΛCDM at the edge of galaxy formation. Mon Notices R Astron Soc 467(2):2019–2038
Rouse LJ, Bergeron SJ, Harris TM (2009) Participating in the geospatial web: collaborative mapping, social networks and participatory GIS. The geospatial web. Springer, pp 153–158
Scharl, A., et al., D5. 2.2 PHEME Visual Dashboard–Final Version. 2017.
Shekhawat P (2018) Geographical Information System (GIS) web applications for data visualization of Drinking Water pipelines. Virginia Tech
Svennerberg, G., Beginning Google Maps API 3. 2010: Apress.
Trapp M et al (2019) Rendering procedural textures for visualization of thematic data in 3D geovirtual environments. In VISIGRAPP (3:IVAPP)
Veenendaal B et al (2017) What is web mapping anyway? Int Arch Photogramm Remote Sens Spat Inf Sci 42(2W7):155–160
Williams CB, Gulati GJJ (2013) Social networks in political campaigns: Facebook and the congressional elections of 2006 and 2008. New Media Soc 15(1):52–71
Yeung AK, Hall GB (2007) Spatial data and spatial database systems. Spatial Database Systems. Springer, pp 93–127
Yeung AK, Hall GB (2017) Spatial database systems: Design, implementation and project management. Vol. 87. Springer Science & Business Media
Yue G, Qi XF (2918) Channel estimation in large scale MIMO systems using iterative location based spatial filtering. Google Patents
Zerdoumi S et al (2018) Image pattern recognition in big data: taxonomy and open challenges: survey. Multimed Tools Appl 77(8):10091–10121
Zheng Z et al (2020) Spatial equity of park green space using KD2SFCA and web map API: A case study of zhengzhou, China. Appl Geogr 123:102310
Acknowledgement
This paper was a life challenge. I lost my home and work and covid-19 add the extract obstacle, although i have broken and lost my life and locked down in Wuhan -china (no residence, no income, and no communication with outside world). it was crisis in all perspectives of life , future only hope .in particular, the hope of unique lord the best planner of future .with faithful heart. I have face these challenges.
Thank you so much for allowing me to present this article in this journal. As editors and managers, you have been light my life and give me hope that there is hope you said can develop knowledge and focus in This conditions.
Author information
Authors and Affiliations
Corresponding author
Additional information
Publisher’s note
Springer Nature remains neutral with regard to jurisdictional claims in published maps and institutional affiliations.
Rights and permissions
About this article

Cite this article
Zerdoumi, S., Hashem, I.A.T. & Jhanjhi, N.Z. A new spatial spherical pattern model into interactive cartography pattern: multi-dimensional data via geostrategic cluster. Multimed Tools Appl 81, 22903–22952 (2022). https://doi.org/10.1007/s11042-021-11339-4
Received:
Revised:
Accepted:
Published:
Issue Date:
DOI: https://doi.org/10.1007/s11042-021-11339-4