
SlMYB102 expression enhances low-temperature stress resistance in tomato plants
- Published
- Accepted
- Received
- Academic Editor
- Renate Scheibe
- Subject Areas
- Biochemistry, Molecular Biology, Plant Science
- Keywords
- Tomato, SlMYB102, Over-expression, Cold-resistance
- Copyright
- © 2020 Wang et al.
- Licence
- This is an open access article distributed under the terms of the Creative Commons Attribution License, which permits using, remixing, and building upon the work non-commercially, as long as it is properly attributed. For attribution, the original author(s), title, publication source (PeerJ) and either DOI or URL of the article must be cited.
- Cite this article
- 2020. SlMYB102 expression enhances low-temperature stress resistance in tomato plants. PeerJ 8:e10059 https://doi.org/10.7717/peerj.10059
Abstract
Herein, we identified the tomato SlMYB102 gene as a MYB family transcription factor of the R2R3-MYB subfamily. We additionally determined that the SlMYB102 promoter region contains photoresponsive, abiotic stress-responsive, and hormone-responsive regulatory elements, and we detected higher SlMYB102 expression in the reproductive organs of tomato than that in vegetative organs, with the expression being highest in ripe fruits and in roots. SlMYB102 expression was also shown to be cold-inducible. The protein encoded by SlMYB102 localized to the nucleus wherein it was found to mediate the transcriptional activation of target genes through its C-terminal domain. Overexpression of SlMYB102 in tomato plants conferred enhanced tolerance to cold stress. Under such cold stress conditions, we found that proline levels in the leaves of SlMYB102 overexpressing transgenic plants were higher than those in WT plants. In addition, S1MYB102 overexpression was associated with the enhanced expression of cold response genes including SlCBF1, SlCBF3, SlDREB1, SlDEB2, and SlICE1. We also found that the overexpression of SlMYB102 further enhanced the cold-induced upregulation of SlP5CS and SlAPX2. Taken together, these results suggest that SlMYB102 may be involved in the C-repeat binding transcription factor (CBF) and proline synthesis pathways, thereby improving tomato plant cold resistance.
Introduction
Plants are highly susceptible to environmental changes that can negatively impact their growth and development, with low temperatures, high salt levels, and drought conditions all being common adverse stress conditions (Knight & Knight, 2012). Low temperatures, in particular, are a relatively common form of abiotic stress capable of impairing plant growth, survival, and spatial/temporal distribution (Zhu, 2002).
Tomatoes are considered to be both a vegetable and a fruit, and are widely cultivated worldwide owing to their high nutritional value such that they hold an important position in global trade markets. Tomato plants are native to warm tropical environments, and temperatures below 10 °C can hinder their growth and development. Temperatures of 8 °C can significantly slow this growth, which is completely arrested at 5 °C (Wang et al., 1998). Cold-induced damage can vary based on the stage of tomato growth, potentially resulting in reductions in fruit quality or yield (Saito, Katana & Wang, 1981). There is thus a clear need to improve the cold resistance properties of tomato plants.
Exposure to cold stress leads to the induction of specific signal transduction and gene expression programs within plant cells, thereby inducing compensatory physiological and biochemical reactions aimed at alleviating this form of stress to improve plant growth and survival (Almadanim et al., 2017; Domon et al., 2013; Kielbowicz-Matuk, Rey & Rorat, 2008). These compensatory stress response pathways are complex multigene processes (Thomashow, 1999). Indeed, a wide range of transcription factors and stress-related signaling pathways have been identified to date in plants (Chinnusamy, 2003; Chinnusamy, Zhu & Zhu, 2006; Mahajan & Tuteja, 2005; Shinozaki, Yamaguchi-Shinozaki & Seki, 2003; Tran et al., 2004; Yamaguchi-Shinozaki & Shinozaki, 2006), with the MYB (Du et al., 2009), WRKY (Jiang & Deyholos, 2008), bZIP (Hu et al., 2016), NAC (Tran et al., 2004), and AP2/ERF (Gu et al., 2017) families of transcription factors being well-documented mediators of stress responses.
Plant responses to cold stress can be either ABA-dependent or ABA-independent (Roychoudhury, Paul & Basu, 2013). ABA-dependent cold stress responses are typically associated with the regulation of downstream target cold resistance genes such as HOS9 (Zhu et al., 2004), SFR6 (Knight et al., 1999), and WRKY6 (Li et al., 2017b). In contrast, the ABA-independent pathway primarily relies on the C-repeat binding transcription factor (CBF) pathway-mediated regulation of cold stress responses (Guo, Liu & Chong, 2018). The cold-regulated gene CBF / DREB1 transcription factor was originally identified in Arabidopsis thaliana (Guy et al., 1994; Thomashow, 2010). Cold stress rapidly induces the expression of CBF transcription factors which then interact with the promoter region of the cold-regulated (COR) gene so as to activate its expression. The promoter of the COR gene contains one or more dehydration response elements (DRE) / C repeat (CRT) cis-elements (Yamaguchi-Shinozaki & Shinozaki, 1994; Stockinger, Gilmour & Thomashow, 1997).
The MYB family is one of the largest transcription factor families in plants (Li et al., 2019a; Li et al., 2019b), with four distinct MYB subfamilies that are designated according to their structural repeat composition (Dubos et al., 2010). These families include the 1R-MYB/MYB-related subfamily that includes MYB domain-containing proteins with a single R structure (Nemie-Feyissa et al., 2014), the R2R3-MYB subfamily which includes MYB domain-containing factors with two R structures, the R1R2R3-MYB subfamily which includes MYB domain-containing transcription factors containing 3 R structures (Haga et al., 2007), and a group of MYB domain-containing transcription factors containing 4 R structures similar to the R1/R2 structure (Hou et al., 2014). Of these factors, the R2R3-MYB subfamily is the most abundant and diverse class, with R2R3-MYB transcription factors playing essential roles in regulating plant growth, development, secondary metabolism, and responses to both biotic and abiotic stressors (Albert et al., 2014).
R2R3-MYB family transcription factors have been found to mediate plant temperature stress responses (Wang, Cao & Hao, 2013). For example, when the soybean GmMYB76 and GmMYB177 genes were overexpressed this was shown to improve cold resistance in these plants (Liao et al., 2008), much as OsMYB4 overexpression in tomatoes enhanced their cold resistance (Vannini et al., 2007). In rice, the OsMYB2 gene has further been reported to regulate salt, cold, and drought resistance (Yang, Dai & Zhang, 2012). In A. thaliana, overexpression of TaMYB2A enables plants to better resist multiple abiotic stressors (Mao et al., 2011). AtMYB15 negatively regulates A. thaliana cold resistance such that when it is overexpressed these plants are more sensitive to low temperatures (Agarwal et al., 2006). MdMYB88 and MdMYB124 actively regulate frost tolerance and cold response gene expression in apples and in A. thaliana (Xie et al., 2018), while PbrMYB5 controls AsA synthesis by regulating the expression of dehydroascorbate reductase (DHAR2), thereby improving the cold resistance of transgenic tobacco plants (Xing et al., 2019). These past studies provide clear evidence for the vital role of plant MYB family transcription factors in abiotic stress responses (Abe et al., 1997; Li et al., 2019a; Li et al., 2019b).
While these individual transcription factors can orchestrate plant stress responses, the responses themselves are complex multigenic pathways, with MYB transcription factors serving as intermediate targets of other regulatory factors within the overall gene regulatory network. After a plant is impacted by biotic or abiotic stress, MYB synergizes with related transcription factors to activate the expression of specific stress-related genes, thereby coordinating an appropriate response to a given stressor. As such, a better understanding of the function of plant MYB genes has the potential to offer greater insight into low-temperature stress response regulatory networks in these plants.
The SlMYB102 gene (Solyc02g079280) analyzed in the present study was identified as a low temperature-responsive gene in a transcriptomic analysis of radiation-induced cold-resistant mutant tomato plants. Through the use of tobacco mosaic virus-induced gene silencing (VIGS), researchers have previously confirmed that this gene is responsive to low-temperature stress and that its silencing can reduce plant cold stress tolerance (Chen et al., 2018). Based on the important role of the MYB transcription factor in plant abiotic stress and the important role that SlMYB102 may play in tomato responses to low-temperature stress, in the present study we further analyzed the function of this gene under low-temperature stress conditions, revealing that SlMYB102 overexpression enhanced tomato cold resistance. Our results further suggest that SlMYB102 may be involved in the CBF pathway and the proline synthesis pathway, thereby leading to enhanced plant resilience upon exposure to cold stress conditions. Our characterization of SlMYB102 will facilitate a better understanding of cold stress response mechanisms in tomatoes.
Materials and Methods
Plant growth
The S1MYB74 gene used for cloning purposes in the present study was derived from the laboratory Russian tomato variety Bolgogragsky (variety 25), while the genetically transformed tomato variety with higher transformation efficiency was designated O-33-1 (variety 63). Tomato seeds underwent an initial 3-day germination step at 25 °C in the dark. The germinated tomato seeds were then sown into a plug tray with a nutritional soil composition of peat and vermiculite (2:1), and were placed in a light incubator at 25/20 °C (16 h / 8 h day/night cycle; 60% humidity; 12000 lux light) for cultivation. After 5 weeks, plants exhibiting god growth and consistent morphology were used for experimental treatment. Tobacco plants used in the present study were of the N. benthamiana variety and were grown identically to the tomato plants, with 1-month-old seedlings being used for testing.
Biochemical characterization
We utilized NCBI (https://www.ncbi.nlm.nih.gov/) for nucleic acid BLAST alignment and ORF predictions of gene coding regions. The molecular weight and isoelectric point of the protein encoded by S1MYB74 were predicted using ProtParam (http://web.expasy.org/protparam/). Transmembrane predictions were made using TMHMM Serverv.2.0 (http://www.cbs.dtu.dk/services/TMHMM/), while signal peptides were analyzed with the SignalP 4.1 Server (http://www.cbs.dtu.dk/services/SignalP/), SOPMA was used for hydrophobicity analyses, the PlantCARE web tool (http://bioinformatics.psb.ugent.be/webtools/plantcare/html/) was used for promoter region binding element analyses, and the ProtComp 9.0 web tool was used for the prediction of protein subcellular localization. The software MEGA5.0 was used to identify sequence homology and to construct an evolutionary tree.
Cold stress treatment
After plants had grown for 5 weeks, they were grown under low-temperature conditions at 4 °C (16/8 h light/dark cycle, 60% relative humidity, 12000 lux light). Plant samples were then collected after 0, 1, 3, 6, 9, 12, and 24 h from the second fully-expanded functional leaf at the top of the individual plants. These samples were quickly snap-frozen in liquid nitrogen and were then stored in −80 °C refrigerator for gene expression detection and gene cloning experiments. After 5 days of low-temperature treatment, fresh tomato leaves were collected and used for malondialdehyde, soluble sugar, proline, antioxidant enzyme activity, and O2− physiological indicator measurements. On days 0 –7 of low-temperature exposure, samples were collected at the same time every day and fresh tomato leaves were weighed to determine relative conductivity. Each of the above experiments was performed using three biological replicates.
Subcellular localization analyses
Agrobacterium containing the expression vector pBI121-GFP-MYB74 (35S::GFP-MYB74) that was to be linked to the CDS region of the SlMYB102 gene and control pBI121-GFP (35S::GFP) vectors were grown in YEB liquid medium (yeast extract 10 g, peptone 10 g, MgSO4.7H2O 0.5 g, sucrose 5 g, per 1 L medium) at 28 °C until reaching an OD600 value of 0.8, after which these bacteria were centrifuged at 5,975× g for 10 min at 4 °C, resuspended in permeate (10 mmol/L MgCl2, 10 mmol/L pH 5.6 MES buffer, 200 µmol/L acetosyringone), and adjusted to an OD600 value of 1.0. This mixture was then combined with P19 (an RNA silencing repressor derived from tomato plexiform stunt virus) before injection into the back of leaves of 1-month-old N. benthamiana plants using a disposable syringe. Plants were then grown for 3 days under standard conditions, after which samples were collected for analysis. These samples were stained using DAPI for 4 h and were then imaged via Nikon A1 laser confocal microscope (Nikon Japan).
Assessment of transcriptional activation activity
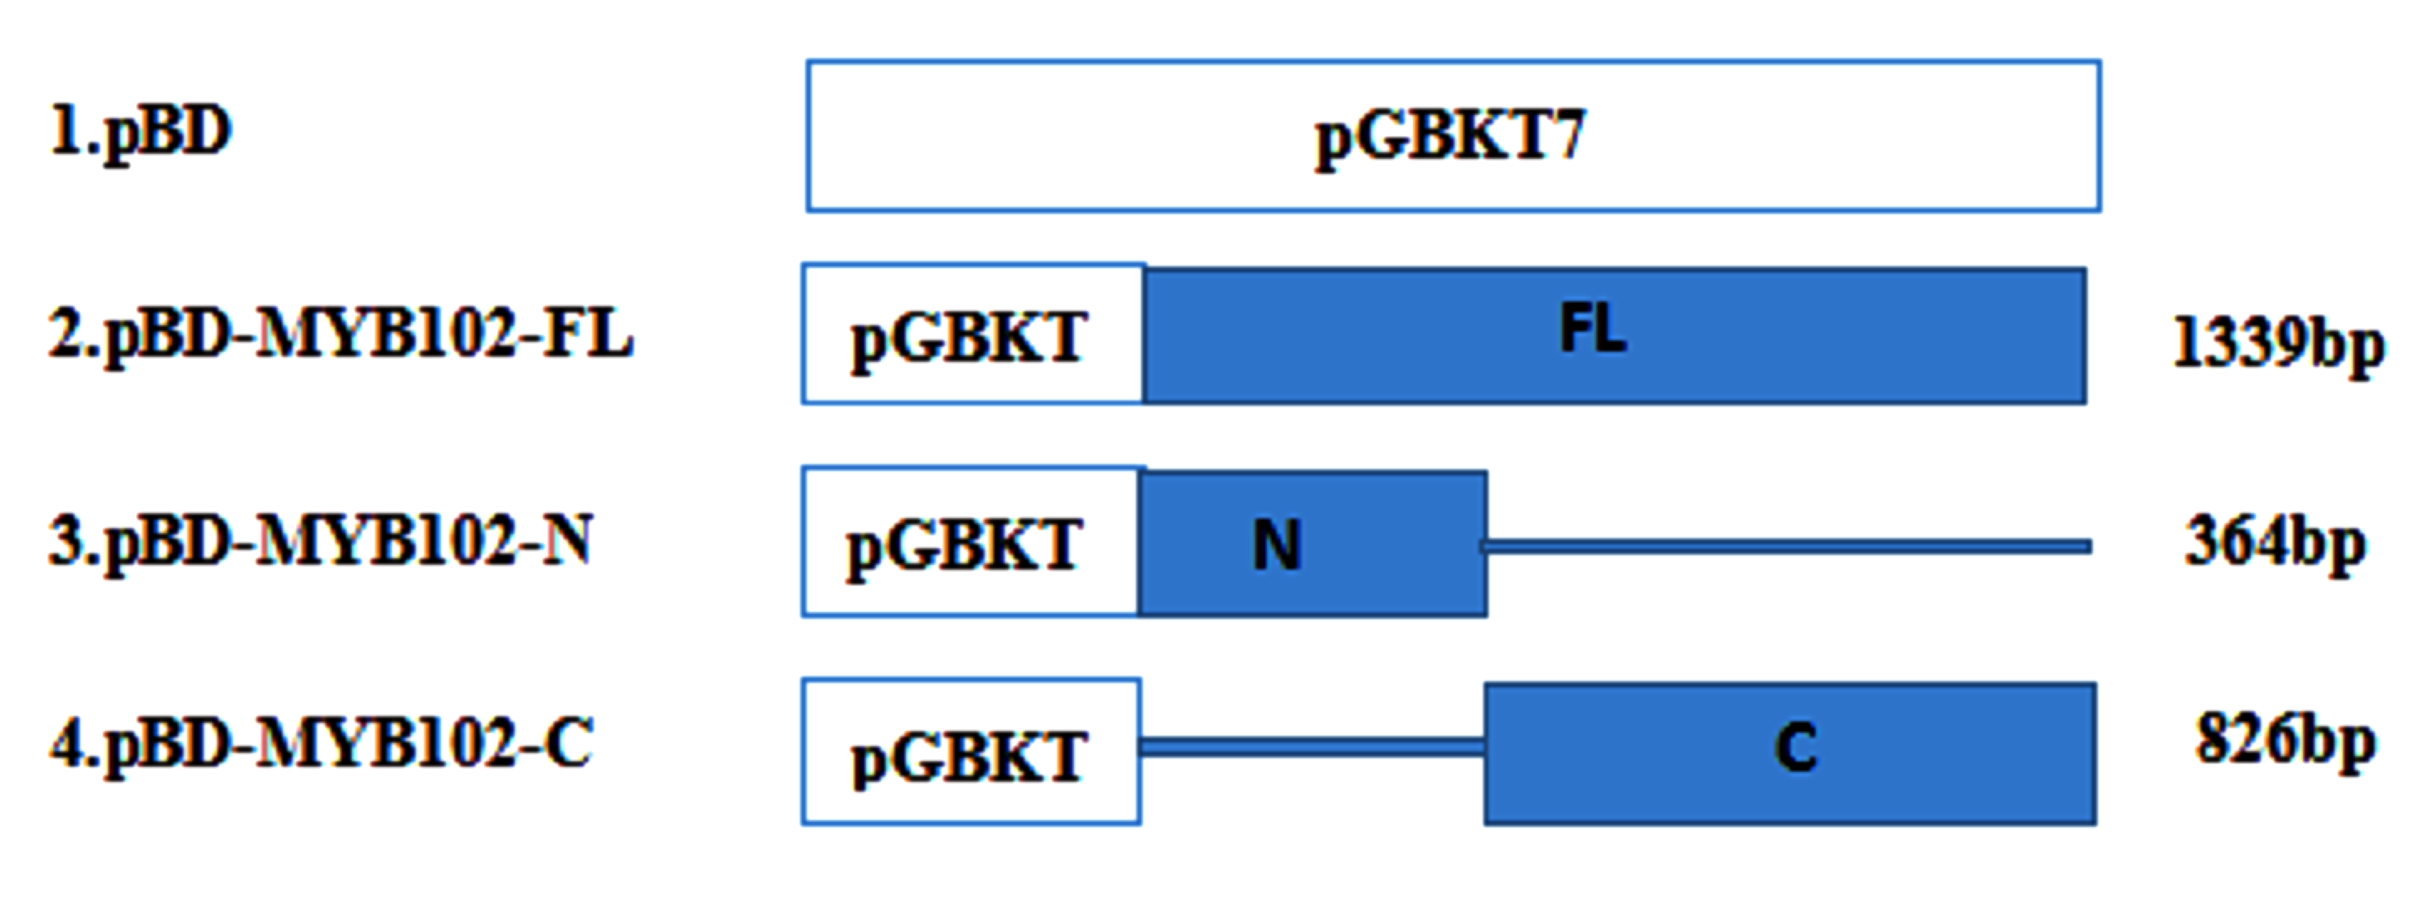
The ability of the SlMYB102 transcription factor to mediate target gene transcriptional activation was confirmed using a yeast single hybrid system. Briefly, the AH109 yeast strain was transformed using plasmids encoding either the full-length version of this gene (MYB74-pGBKT7) or plasmids encoding just the N- and C-terminal domains of this transcription factor (MYB74N-pGBKT7 and MYB74C-pGBKT7, respectively; see Fig. S1). After these transformed yeast were grown on SD-Trp medium (SD-Trp powder 8 g/L, agar 20 g/L, 40% glucose 50 ml/L), a single colony was isolated for each transformant, diluted with water, and 10 µL of this diluted yeast mixture was spread over the surface of another culture plate of SD-His-Ade-Trp triple-negative medium (SD-His-Ade-Trp powder 8 g/L, agar 20 g/L, 40% glucose 50 ml/L) containing X-α-gal (a chromogenic substrate for yeast galactosidase), with three replicates being prepared per condition. Cells were then grown at 30 °C for 3 days, after which yeast growth was analyzed.
Galactose activity was analyzed based on the fact that yeast cells capable of self-activation produce galactosidase, with these yeast cells turning blue when grown on X-α-gal-containing medium. β-galactosidase activity can additionally be confirmed by measuring its activity directly. A colony was selected on SD-Trp medium plates and was then cultured in liquid medium (30 °C, 328× g ). When the OD600 reached 0.5–0.8, 1.5 ml of the yeast solution was collected, centrifuged at 12,000 rpm for 1 min, resuspended in Z-buffer, spun again, resuspended, and 100 µL of this suspension was added to a new tube that was snap-frozen with liquid nitrogen, warmed to 37 °C, and this procedure was repeated for up to 5 times to ensure complete cell lysis. Next, 300 µl of Z-buffer/2-mercaptoethanol (2%) was added to each tube, and 100 µL of the prepared ONPG solution was then added and samples were warmed to 37 °C in a water bath. Colorimetric changes in the solution were then monitored over time until the solution turned yellow, at which time 400 µL of 1 M Na2CO3 was added to terminate the reaction and the supernatant OD420 value was measured.
β-galactose activity = 1000 × OD420/(t × V × OD600)units:U
Transgenic tomato plant preparation
Tomato seeds were first soaked for 4–6 h in sterile water, after which they were immersed for 2 min in 75% ethanol prior to transfer to a 4% sodium hypochlorite solution for 10 min. Using a clean bench, seeds were then washed 7 times using sterile water and were dried with filter paper. The seeds were sown in 1/2 MS medium (MS powder 4.43 g, Sucrose 30 g/L, Agar 8 g/L) in a sterile console. They were then placed in a light incubator for cultivation. The PBI121-SlMYB102 overexpression vector was transferred into the Agrobacterium tumefaciens GV3101 strain, with these bacteria (OD600 = 0.3 – 0.5) then being used to infect the leaves of these tomato plants. Kanamycin was next used to screen for resistant plants, after which vector-specific PCR primers were used to confirm overexpression. RT-PCR (Semi-quantitative PCR) and qRT-PCR (Real-time PCR) were further used to confirm relative gene expression levels in these plants, and additional kanamycin selection (50 mg/L) was used to screen for recombinant plants until T2 homozygous transgenic lines were obtained, with two of the resultant overexpression lines (OE-4 and OE-9) that performed well being selected for functional validation.
RT-PCR and qRT-PCR
TRIzol (RA101-11, Biomed, China) was used to isolate sample RNA, with a mAll-in-One-Mix-QPCR kit (TransGen Biotech, China) then being used to generate cDNA. Primers were designed at NCBI using tomato actin-7 (NC-015440.2) as a control. A list of all primers used in this study is included in the supplementary files (Table S1). The High-fidelity enzyme Primerstar Max kit (R450, Takara, Japan) was used for PCR reactions, and qRT-PCR reactions were conducted using a Bio-Rad CFX96TM machine with the TB Green Fast qPCR Mix (RR430, Takara, Japan). The reaction system details are listed in the supplementary files accompanying this manuscript (Tables S2 and S3). Thermocycler settings were as follows: 95 °C for 30 s; 40 cycles of 94 °C for 15 s, 60 °C for 30 s. The 2−ΔΔCt method was used to quantify relative gene expression.
Relative conductivity measurements
The exposure of plant tissues to abiotic stressors can result in initial damage to the cellular membrane that results in increased cell permeability. Relative conductivity is one means of measuring such permeability. In this study, we utilized a conductance measurement method that has previously been reported (Xu & Li, 2014). Briefly, 0.2–0.3 g of fresh plant leaves were isolated, cut into thin sections, and added to a 50 mL tube containing 20 mL dH2O for 4–5 h. A DDs −11 conductivity meter was then used to measure relative conductivity. Samples were then boiled for 15 min, cooled to room temperature, and conductivity was again measured. The following formula was then used for analytical purposes:
Electrolyte exudation rate (%) = L1 (soaking fluid conductivity) / L2 (conductivity after boiling) × 100.
MDA and soluble sugar measurements
MDA is a key decomposition product generated during membrane peroxidation, and as such MDA levels are reflective of the degree of plant cell membrane peroxidation. Plant cold stress resistance can thus be indirectly measured via measuring MDA content. The “Modern Plant Physiology Experimental Guide” (Shanghai Institute of Plant Physiology, 1999) and previous studies (Kumar & Knowles, 1993) were used to guide our approach to measuring plant MDA and soluble sugar contents. Briefly, 0.5 g of freshly isolated plant leaves were added to a mortar containing 2 mL 10% trichloroacetic acid (TCA) and a small amount of quartz sand. The mixture was then ground into a homogenate, after which it was again ground with 2 mL of additional TCA prior to spinning for 10 min at 5,975× g. A total of 2 mL of the sample supernatant was then mixed with 2 mL dH2O and 2 mL 0.6% thiobarbituric acid (TBA), after which this mixture was boiled for 15 min, cooled, and spun for 10 min at 5,975× g. Supernatant absorbance was then measured at 450 nm, 532 nm, and 600 nm.
Soluble sugars were quantified as follows:
MDA content formula:
Note: A450, A532, A600 - represent the absorbance at 450 nm, 532 nm, and 600 nm, respectively; V - the volume of the extract (ml); W - plant tissue fresh weight (g).
Proline content measurement
Proline contents were measured using a modified version of the protocol originally described in the “Modern Plant Physiology Experiment Guide” (Zhou, Zhao & Lin, 1997). Briefly, 0.2 g of samples were added to a mortar containing 5 mL 3% sulfosalicylic acid. Samples were then homogenized, immersed in boiling water for 10 min, cooled to room temperature, and spun for 10 min at 5,975× g. A total of 2 mL of the sample supernatant was then added to 2 mL glacial acetic acid and 3 mL 2.5% ninhydrin (ninhydrin dissolved in glacial acetic acid and 6 mol/L H3PO4 at a 3:2 mixture). This solution was then boiled for 40 min, cooled to room temperature, combined with 5 mL toluene, shaken for 10–30 s, allowed to stand at room temperature, and then the absorbance values for the upper layer were measured at 520 nm to quantify protein contents based upon a standard curve.
O2− quantification and measurement of antioxidant activity
Sample antioxidant enzyme activity was measured via preparing a 0.2 g sample of fresh tomato plant leaves that were homogenized in three portions in a pre-cooled mortar containing a total of 1.6 ml (0.6 ml, 0.5 ml, 0.5 ml) of 50 mmol/L pre-cooled PBS (pH 7.8). Samples were then spun at 12,000× g for 20 min at 4 °C, with the supernatants then being used for enzymatic activity assays. Superoxide dismutase (SOD) activity was measured via the previously described nitrogen blue tetrazolium (NBT) approach (Quintanilla-Guerrero et al., 2008). Peroxide (POD) activity was analyzed via the guaiacol method (Rao & Davis, 1999). We used a kit (Nanjing Jiancheng Bioengineering Institute, China) to determine the catalase (CAT) activity and total antioxidant enzyme (T-AO) activity of plants based on provided instructions. O2− levels were measured in samples using a modified version of the NBT protocol as previously described by Sun Q (Sun et al., 2007). Briefly, fresh tomato leaves were combined with 0.1 mg/mL NBT staining solution overnight at 25 °C protected from light. These leaves were then immersed for 10 min in a solution of ethanol:lactic acid:glycerol (3:1:1) in a boiling water bath, after which they were cooled to room temperature and imaged.
Statistical analysis
All assays were conducted in triplicate, and the data are the means + SD (standard deviation). Student’s t-testswere used for significant differences, *P-value < 0.05, **P-value < 0.01.
Results
SlMYB102 bioinformatics analysis
The SlMYB102 gene is 1,800 bp long and contains a 735 bp ORF (810-1544) that encodes a 362 amino acid protein. An analysis of the conserved domains of this predicted protein indicated that it contained a DNA binding domain typical of MYB family transcription factors as well as PLN03212, REB1, and SANT domains. This protein was unstable, hydrophilic, had a predicted molecular mass of 41,522 Da, a theoretical isoelectric point of 5.60, and an instability coefficient of 41.10. Further predictive analyses suggested that this protein is neither secreted nor is it a transmembrane protein, and it does not contain any signal peptide sequences.
In order to analyze the relationship between SlMYB102 and similar proteins, we compared it to MYB family genes in A. thaliana and constructed a phylogenetic tree (Fig. 1). We found that SlMYB102 was closely related to AtMYB74 and AtMYB102, with all three of these genes being associated with abiotic stress responses (Xu et al., 2015; De Vos et al., 2006). We additionally conducted a predictive analysis of cis-acting elements in the SlMYB102 gene promoter sequence (3,000 kb in length) using the online PLACE and Plant CARE software tools (Table 1). This analysis suggested that this promoter region contains photoreactive elements, hormonal and stress response elements, and cell differentiation and meristem growth-related elements. Of these response elements, 8 different stress response elements were identified including sites responsive to auxin (2 sites), abscisic acid (ABA; 4 sites), and salicylic acid (1 site). Transcription factors can recognize and bind these motifs in order to activate stress responses through different ABREs, DRE / CRTs, and MYB/MYC activity (Abe et al., 2003; Liu et al., 2015; Mahajan & Tuteja, 2005; Zhang et al., 2020). This analysis suggests that SlMYB102 can be activated in response to specific stressors via these cis-acting promoter elements, and further indicates that SlMYB102 may be associated with these stress- and hormone-related signaling pathways.
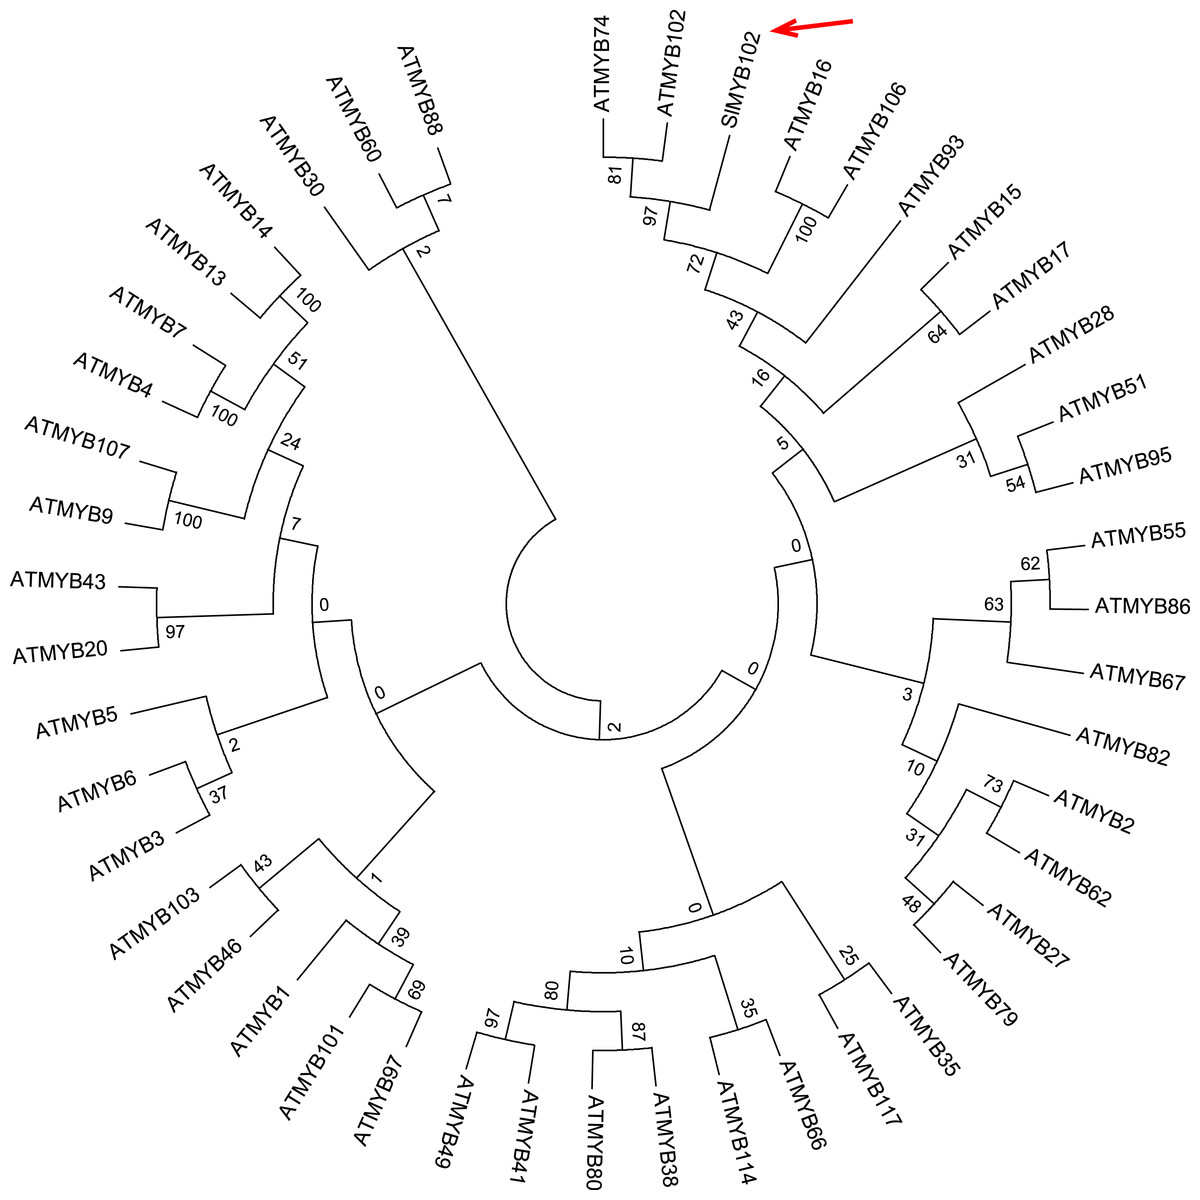
Figure 1: Phylogenetic tree analysis of SlMYB102 and members of the Arabidopsis MYB family.
SlMYB102 is indicated by an arrow. The complete amino acid sequences of 46 R2R3MYB were used to construct NJ tree using MEGA5.0. Multiple sequence alignments were performed using ClustalX with default parameters, and the alignments were then adjusted manually before phylogenetic tree was constructed. The neighbor-joining (NJ) method was used with the following parameters: maximum composite likelihood, complete deletion, and bootstrap (1,000 replicates).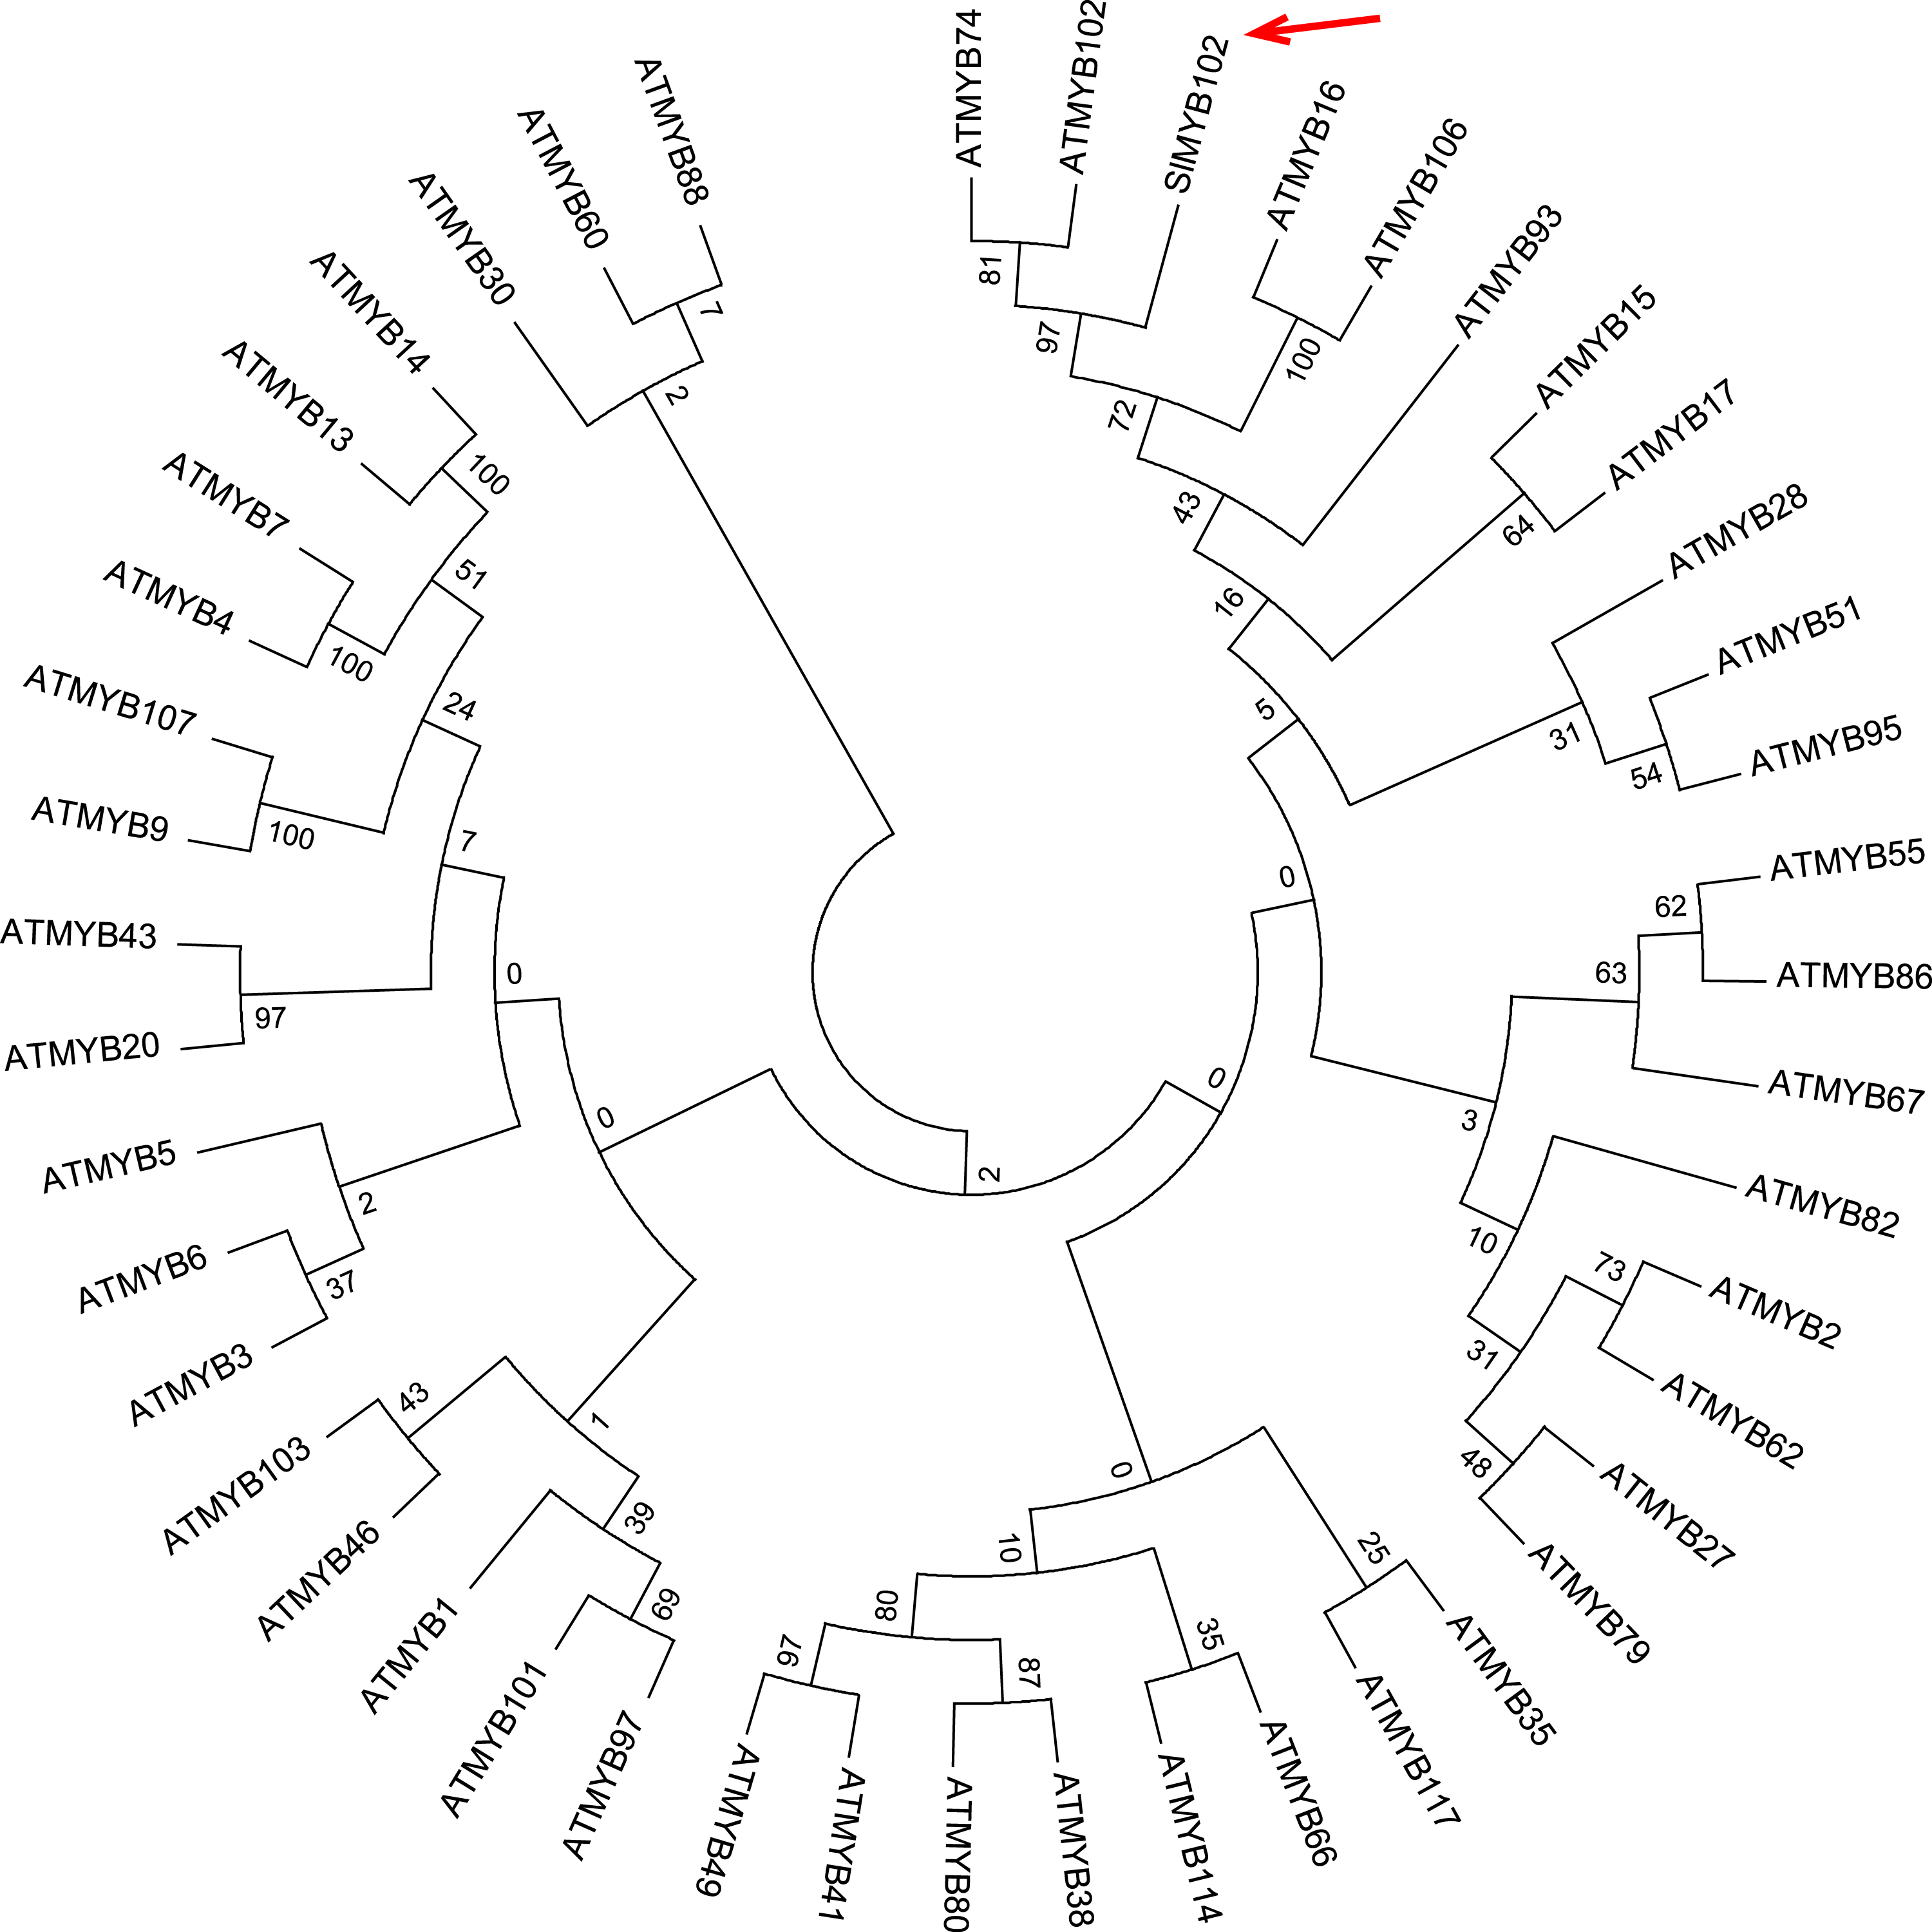
| Types | Names | Sequence | Number | Species |
|---|---|---|---|---|
| cis-acting element involved in abscisic acid responsiveness | ABRE | ACGTG | 4 | |
| cis-acting regulatory element essential for anaerobic induction | ARE | AAACCA | 2 | Zea mays L. |
| part of a conserved DNA module involved in light responsiveness | ATC-motif | AGTAATCT | 1 | Spinacia oleracea Linn. |
| Box 4 | ATTAAT | 3 | Petroselinum crispum L. | |
| G-Box | CACGTTTAAACGT GCACGAC | 5 | Pisum sativum Linn. Brassica napus L. Zea mays L. | |
| GTGGC-motif | GATTCTGTGGC | 1 | Spinacia oleracea Linn. | |
| TCT-motif | TCTTAC | 2 | Arabidopsis thaliana | |
| cis-acting element involved in phytochrome down-regulation | GGATTTTACAGT | 1 | Pisum sativum Linn. | |
| cis-acting regulatory element essential for anaerobic induction | AuxRR-core | GGTCCAT | 1 | Nicotiana tabacum |
| TGA-element | AACGAC | Brassica napus L. | ||
| cis-acting regulatory element related to meristem expression | CAT-box | GCCACT | 1 | Arabidopsis thaliana |
| element involved in differentiation of palisade mesophyll cells | HD-Zip 1 | CAAT(A/T)ATTG | 1 | Arabidopsis thaliana |
| cis-acting regulatory element involved in zein metabolism regulation | O2-site | GATGACATGG | 1 | Zea mays L. |
| cis-acting element involved in salicylic acid responsiveness | TCA-element | CCATCTTTTT | 1 | Nicotiana tabacum |
| cis-acting element involved in defense and stress responsiveness | TC-rich repeats | ATTCTCTAAC | 1 | Nicotiana tabacum |
| wound-responsive element | WUN-motif | AAATTTCCT | 1 | Brassica napus L. |
Assessment of SlMYB102 gene expression patterns and localization
The highest levels of SlMYB102 expression were measured in red fruits, with reproductive organs exhibiting higher average expression levels relative to vegetative organs (Fig. 2A). Of the vegetative organs, SlMYB102 expression was highest in the roots, with clear differences in expression levels between tissues. We further found the expression of SlMYB102 in tomato plant leaves, stems, and roots to be induced by exposure to low temperatures (Fig. 2B). Maximal SlMYB102 expression in leaves (16×baseline) occurred after 7 h of cold exposure, whereas in stems and roots maximal SlMYB102 expression (8×and 9× baseline, respectively) was measured after a 5 h exposure to cold stress conditions. This thus suggests that the expression of SlMYB102 was directly associated with tomato cold resistance. We also found that SlMYB102 functions as a transcription factor, and we determined that the GFP-tagged version of this protein was able to localize to the nuclei of cells (Fig. 2C).
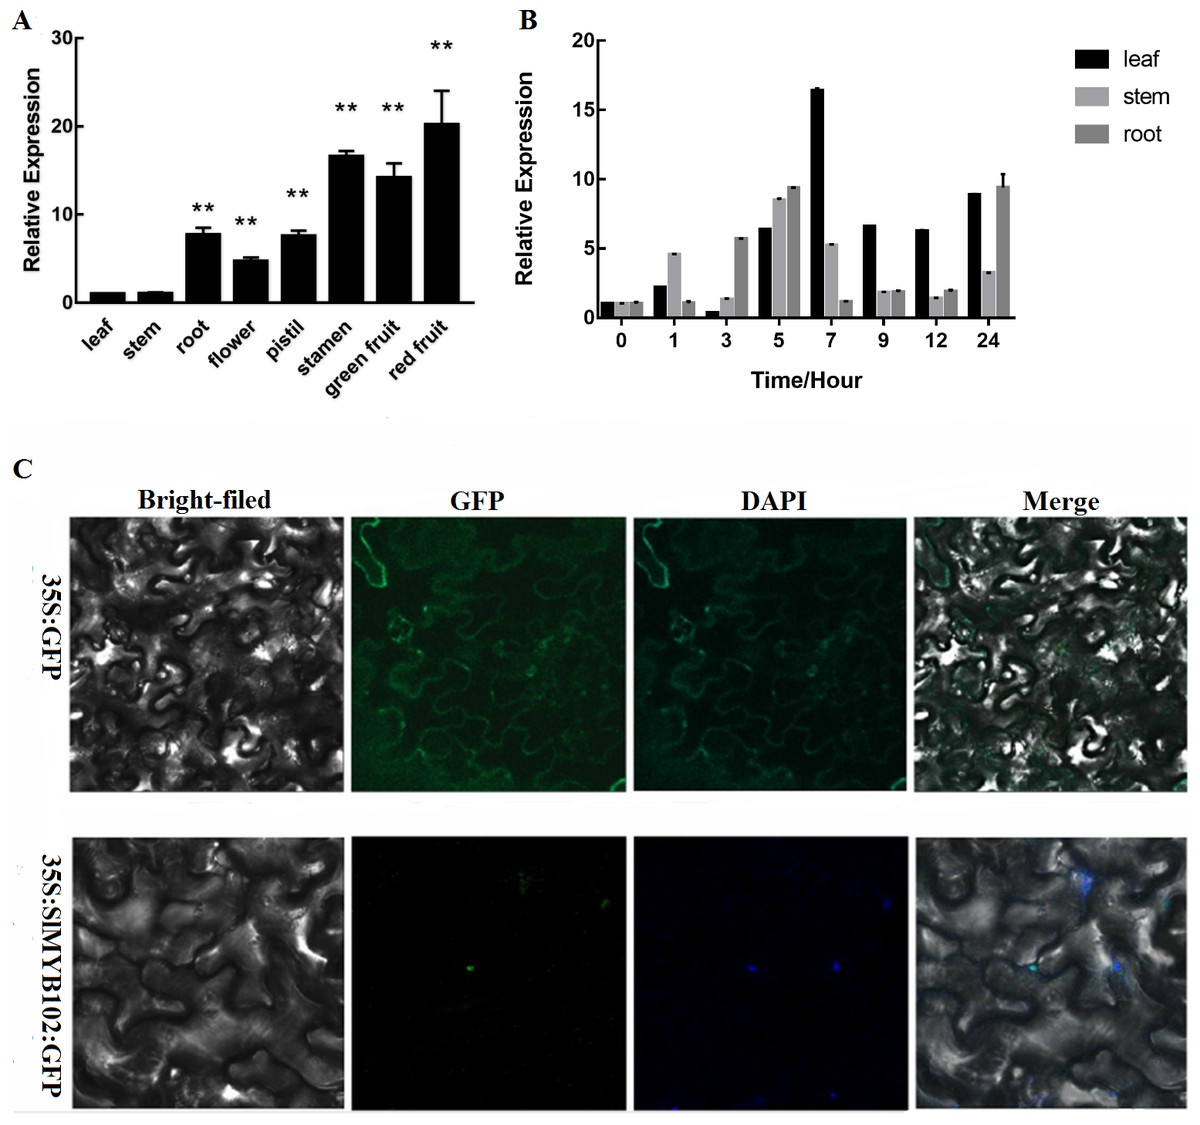
Figure 2: SlMYB102 expression profiles under cold stress conditions and protein localization.
(A) Measurement of SlMYB102 expression in different parts of the tomato plant (L: leaf; S: stem, R: root, F: flower; P: pistil, ST: stamen; GF: green fruit; RF: red fruit). (B) Measurement of SlMYB102 expression at 4. (C) The SlMYB102 protein localizes to the nucleus of tobacco leaf epidermal cells. GFP, green fluorescent protein. The data are means + SD (standard deviation) of three biological replicates analyzed by Student’s t-test; *P < 0.05; and **P < 0.01. Error bars represent standard deviation.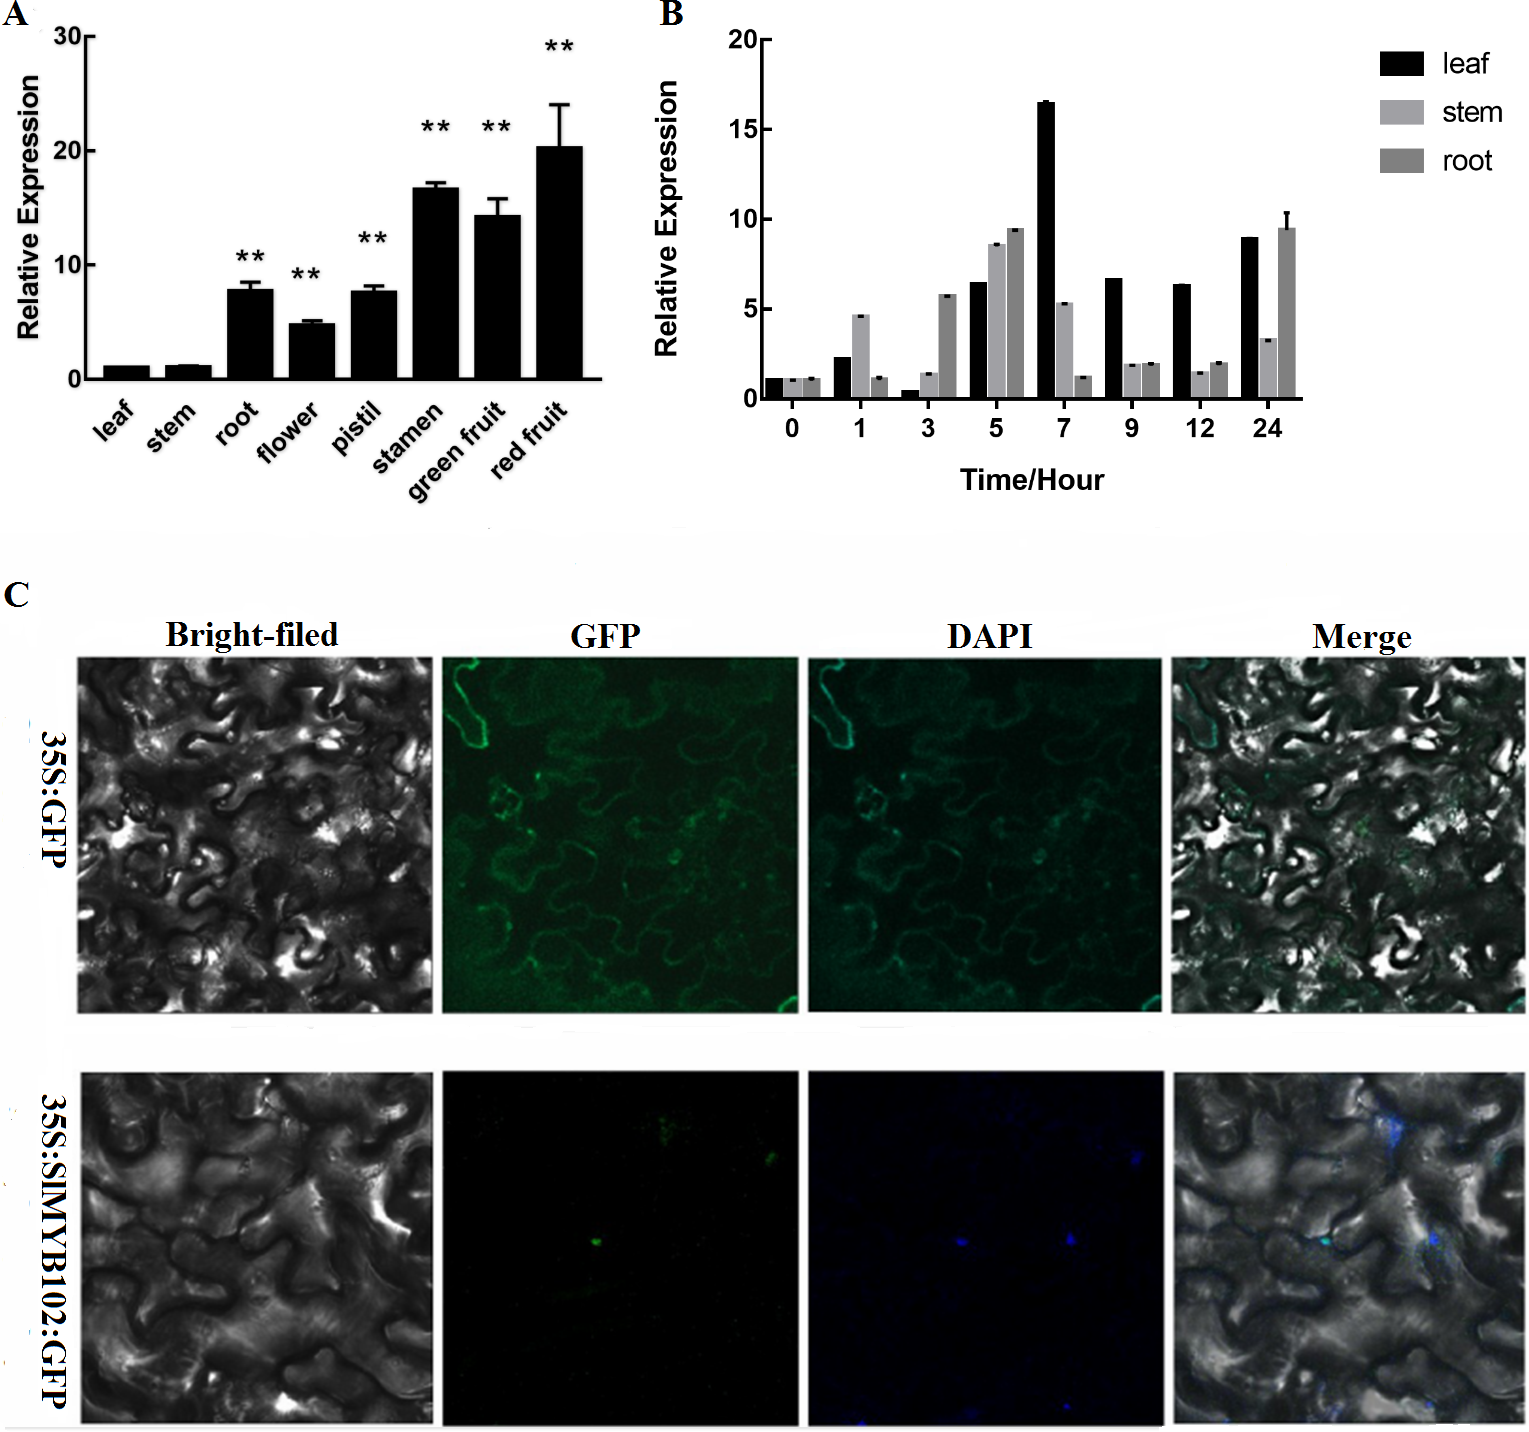
Assessment of SlMYB102 transcriptional activation activity
As SlMYB102 was identified as a putative transcription factor, we next sought to confirm whether it exhibited self-activating activity (Fig. 3A). We found that all strains of yeast were able to grow normally on SD-Trp medium (Fig. 3B), whereas only yeast expressing the full length and SlMYB102 C-terminal plasmids were able to grow on the SD-Trp-His-Ade+X–gal medium and to produce a blue color (Fig. 3C), thus confirming that SlMYB102 can activate transcription, with its C-terminal domain being sufficient to mediate this transcriptional activation. A β-galactosidase activity assay further revealed that the full-length protein exhibited maximal β-galactosidase activity (28 U), while the C-terminal protein exhibited less activity (8 U) and the N-terminal fragment exhibited no activity (Fig. 3D).
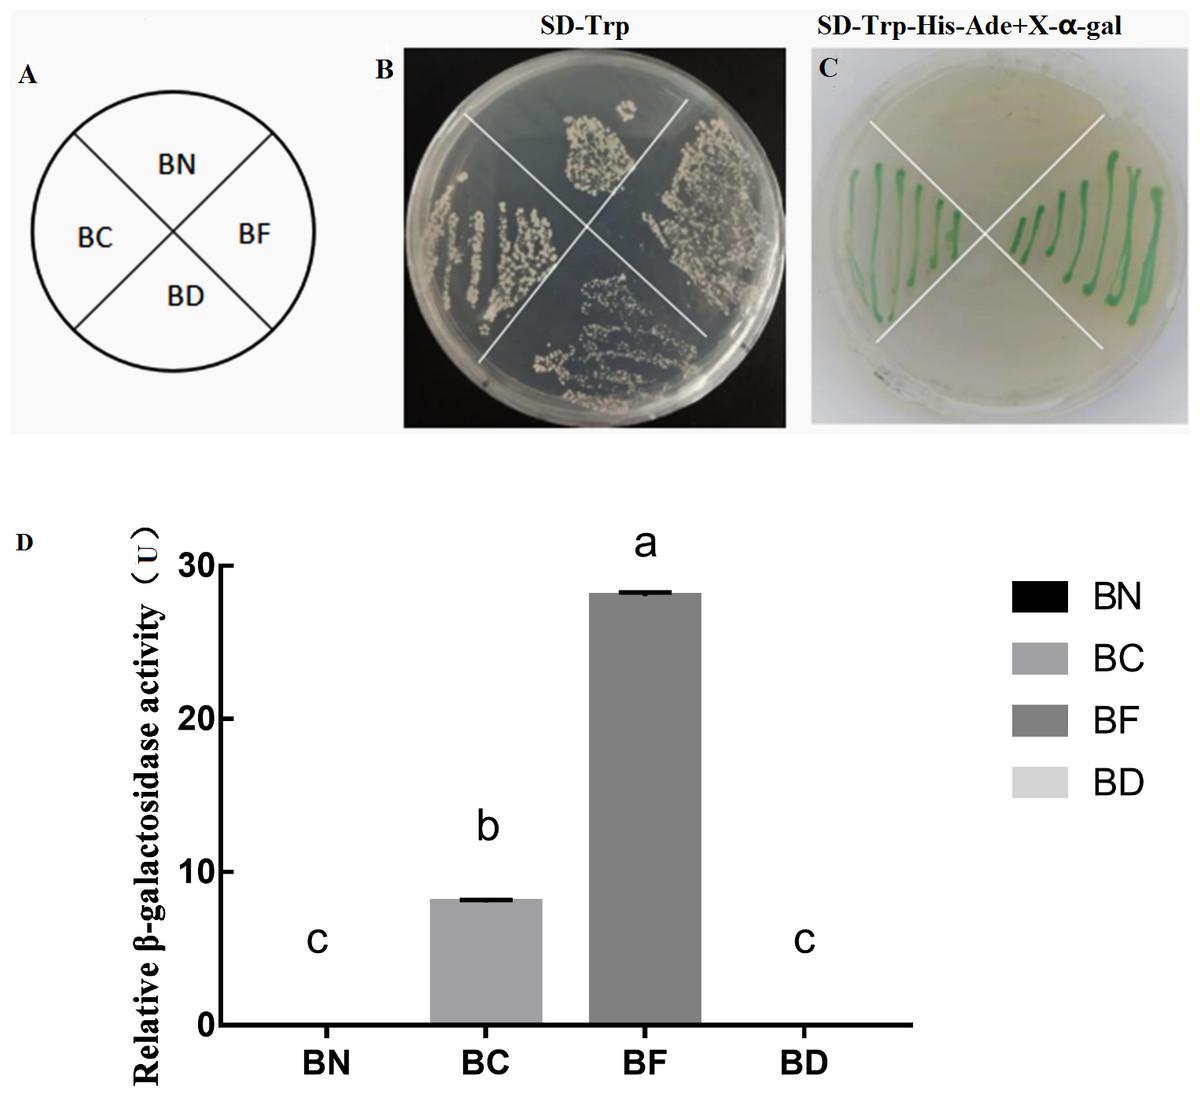
Figure 3: Assessment of SlMYB102 transcriptional activation and β-galactose activity.
Note; BN: pGBKT7-MYB102-N; BC: pGBKT7-MYB102-C; BF: pGBKT7-MYB102 full length; BD: pGBKT7 vector. (A) Legend; (B) SD-Trp single-deficient medium; (C) SD-Trp-His-Ade+X-α-gal triple-deficient medium (X-α-gal is a chromogenic substrate for yeast galactosidase, such that yeast capable of self-activation produce galactosidase and turn blue on medium containing X-α-gal.); (D) Galactose activity analysis. The data are means + SD (standard deviation) of three biological replicates analyzed by Student’s t-test; Lowercase letters indicate P < 0.05; Error bars represent standard deviation.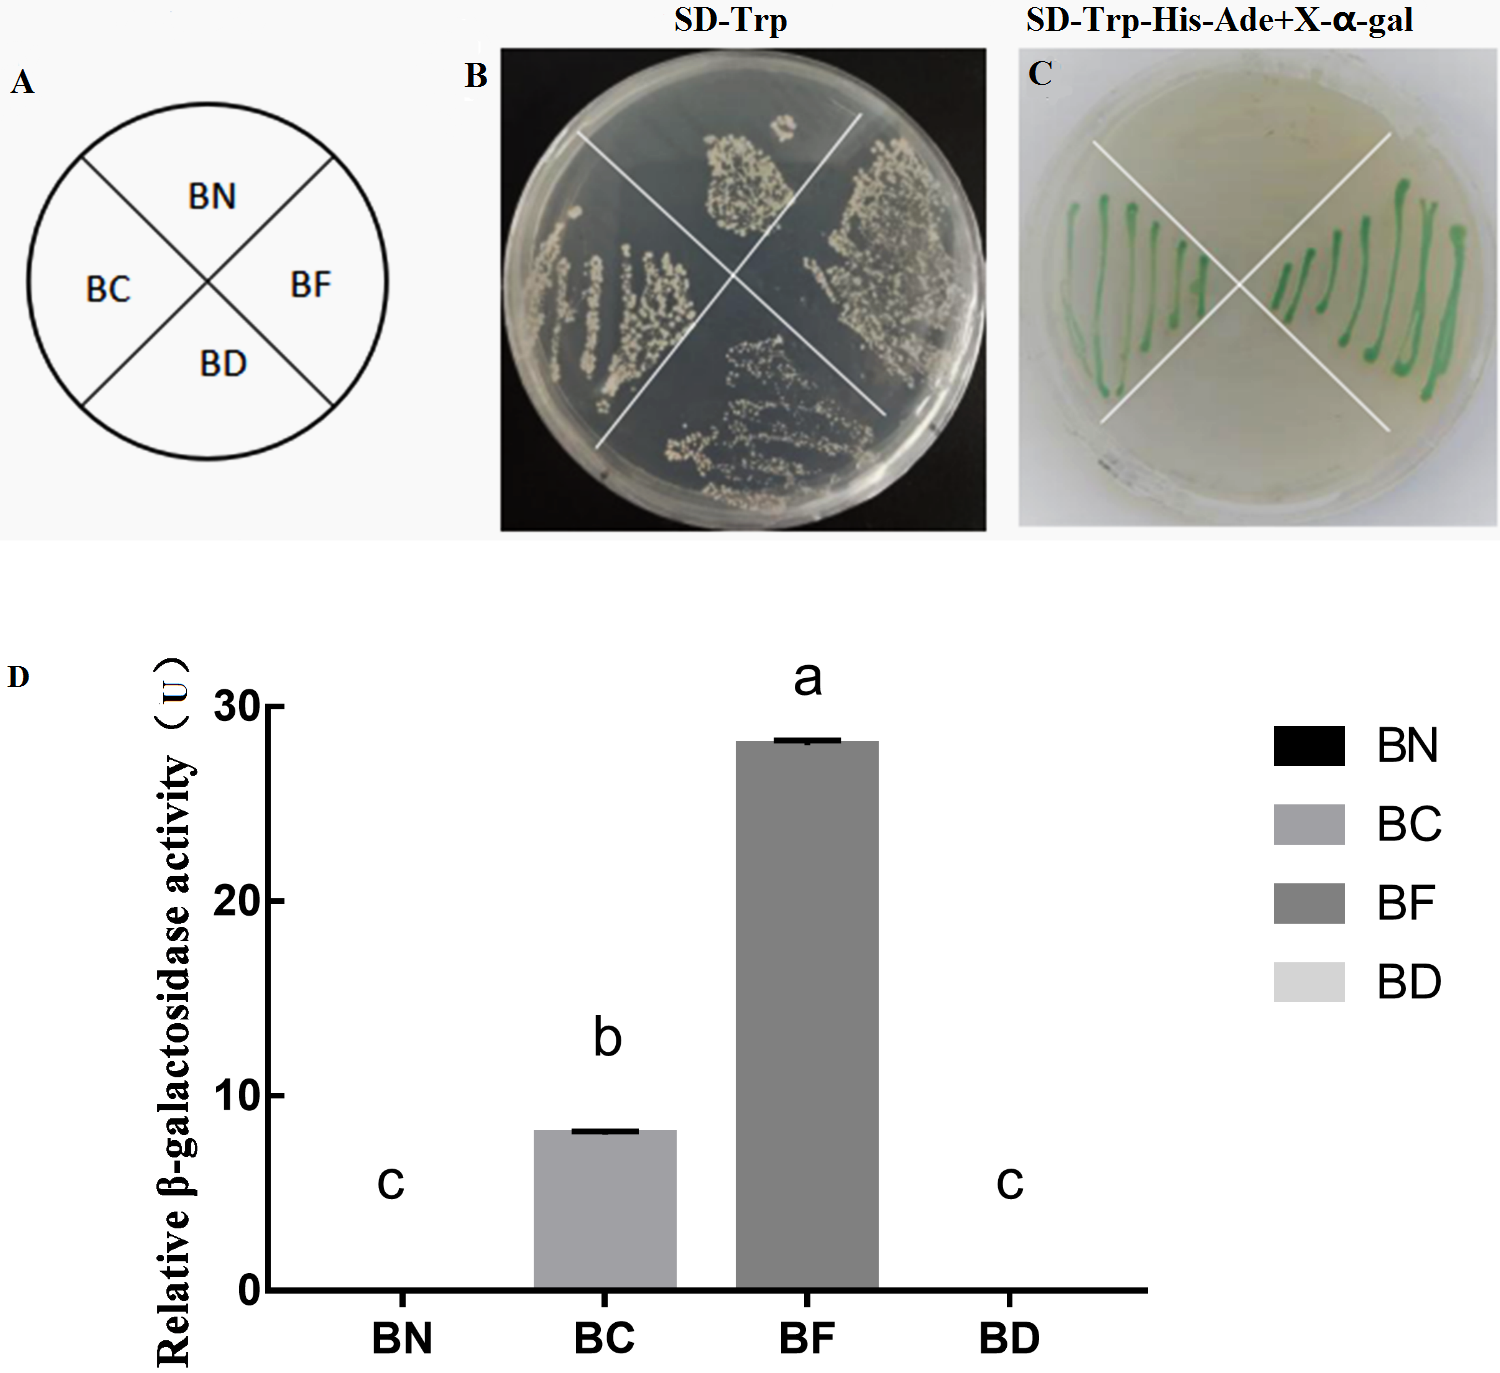
SlMYB102 overexpression in transgenic plants
Our results thus far indicated that SlMYB102 is closely related to low-temperature stress, and as such we next wanted to explore the role of this gene in plant stress responses. We confirmed the successful overexpression of this gene in tomato plants following PCR amplification based upon the presence of a 1,479 bp band that was present in these transgenic plants and in bacteria encoding this gene, whereas no corresponding band was evident in WT plants (Fig. 4A). SlMYB102 overexpression was confirmed by RT-PCR (Fig. 4B), and qRT-PCR was then performed, revealing that these transgenic plants expressed SlMYB102 at levels up to 32-fold higher than in WT controls (Fig. 4C). This indicates that we had successfully generated SlMYB102-overexpressing transgenic tomato plants.
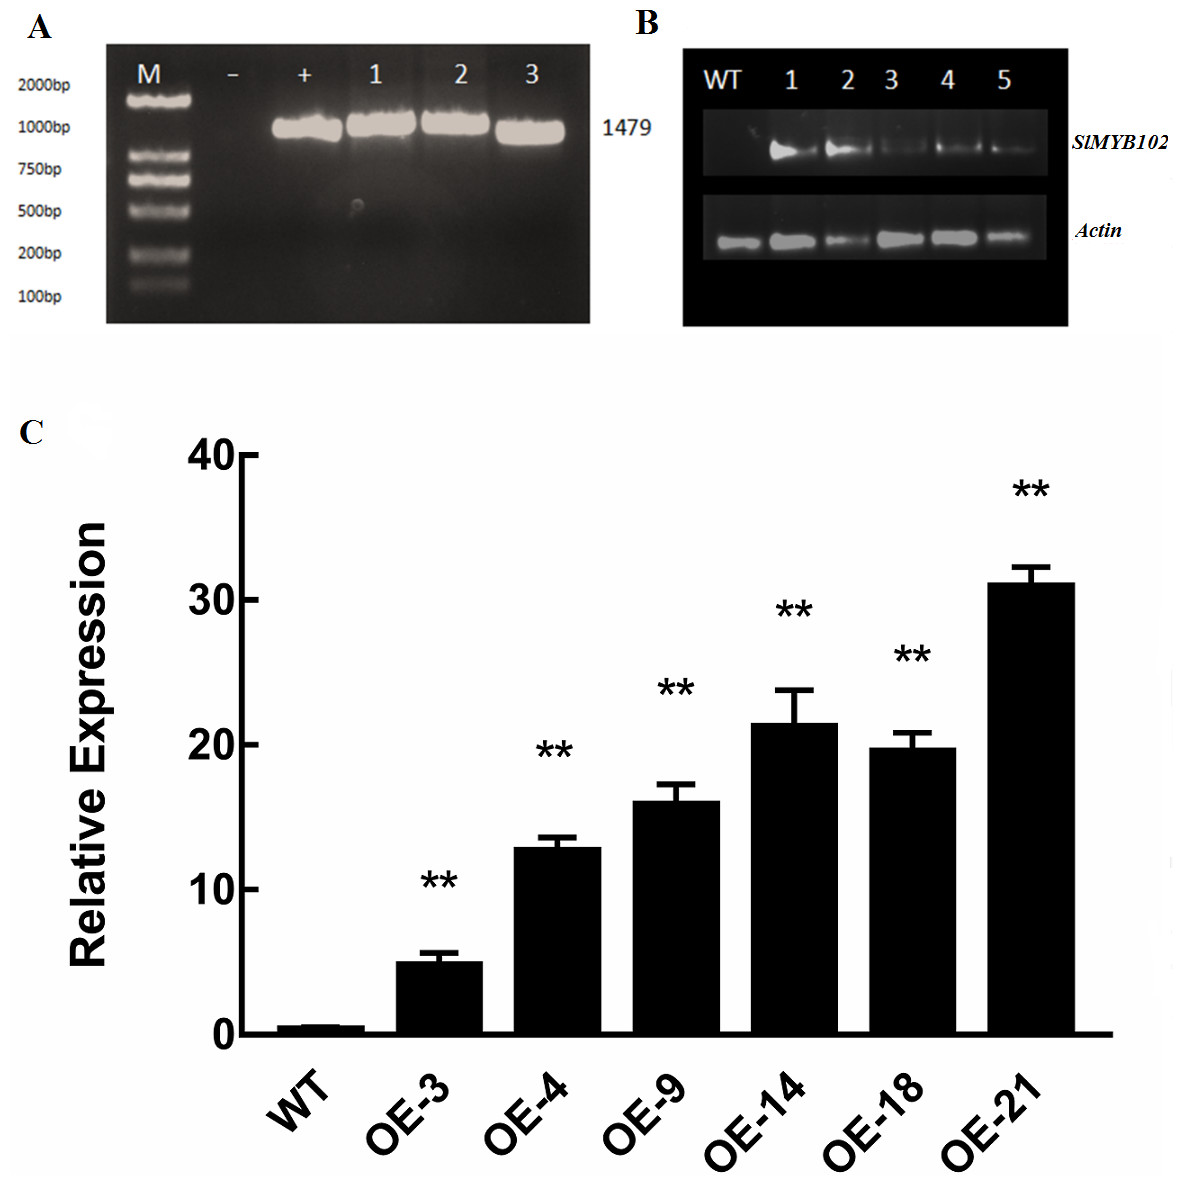
Figure 4: Validation of transgenic lines.
(A) PCR amplification of the recombinant gene (M: 2000 DNAMarker, -: negative control, +: bacterial positive control, 1-3: transgenic lines); (B) RT-PCR electropherogram; (M: 2000 DNAMarker, WT: wild type plants, 1-5: transgenic lines). (C) qRT-PCR was used to verify the expression of the SlMYB102 gene, with Actin as a normalization control. The data are means + SD (standard deviation) of three biological replicates analyzed by Student’s t-test; *P < 0.05; and **P < 0.01. Error bars represent standard deviation.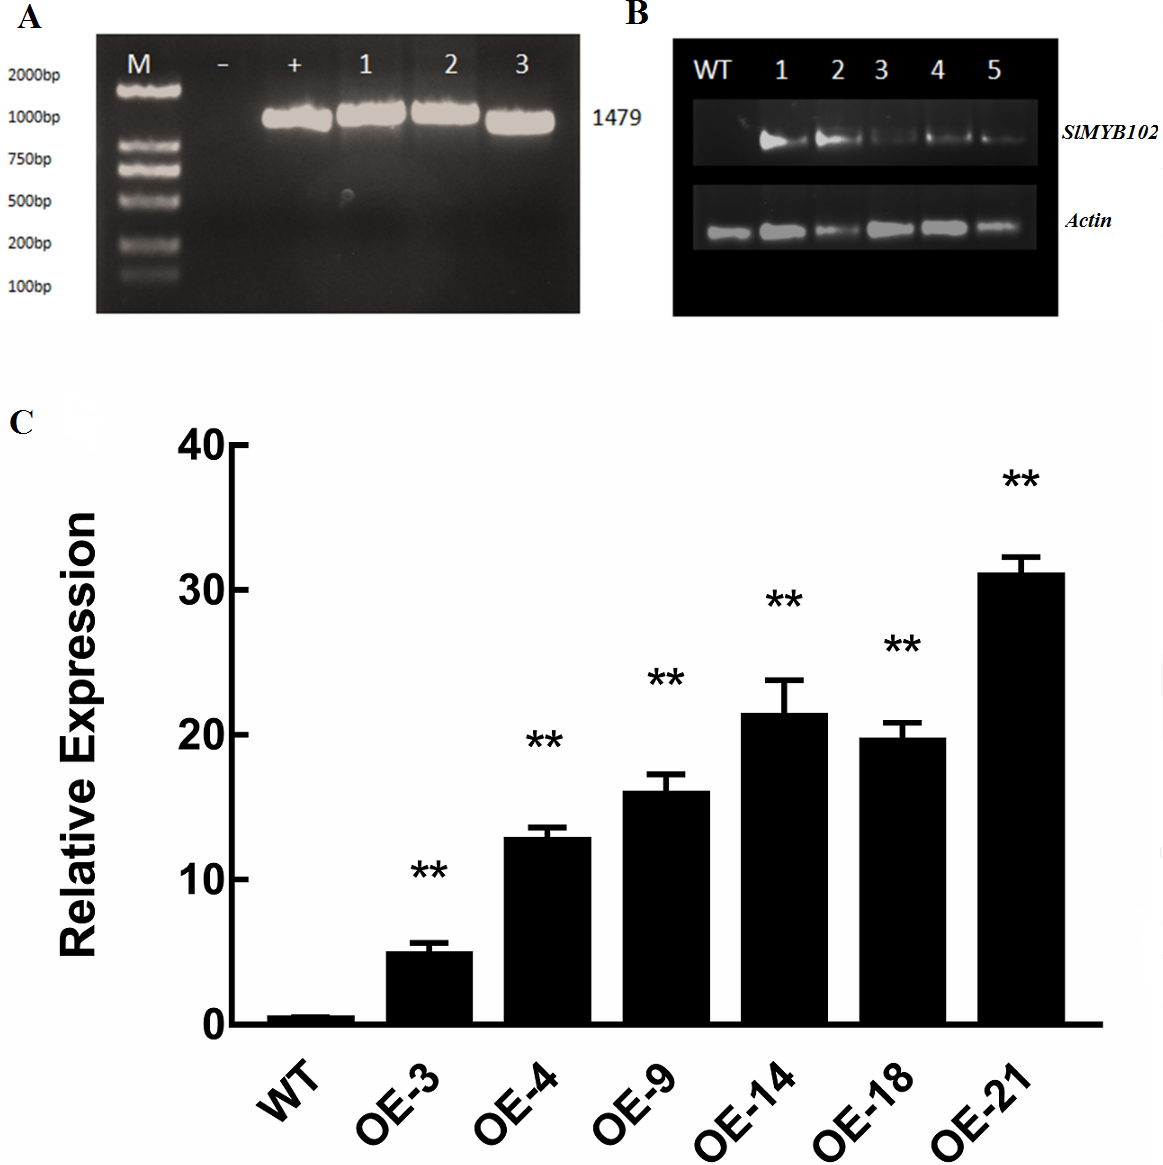
SlMYB102 overexpression enhances tomato cold resistance
After a single planting, transgenic plants were harvested and T2 plants were obtained and evaluated for their ability to tolerate cold stress based upon the measurement of relevant physiological indexes. We analyzed two different overexpression strains (OE-4 and OE-9). At 25 °C, the growth of WT and transgenic plants was comparable (Fig. 5A). However, when plants were exposed to cold stress for 4 days, the WT plants exhibited clear evidence of chilling, whereas transgenic plants did not exhibit these same signs of cold stress. Thus, at a phenotypic level these SlMYB102-overexpressing plants were more resistant to cold stress than were WT tomato plants.
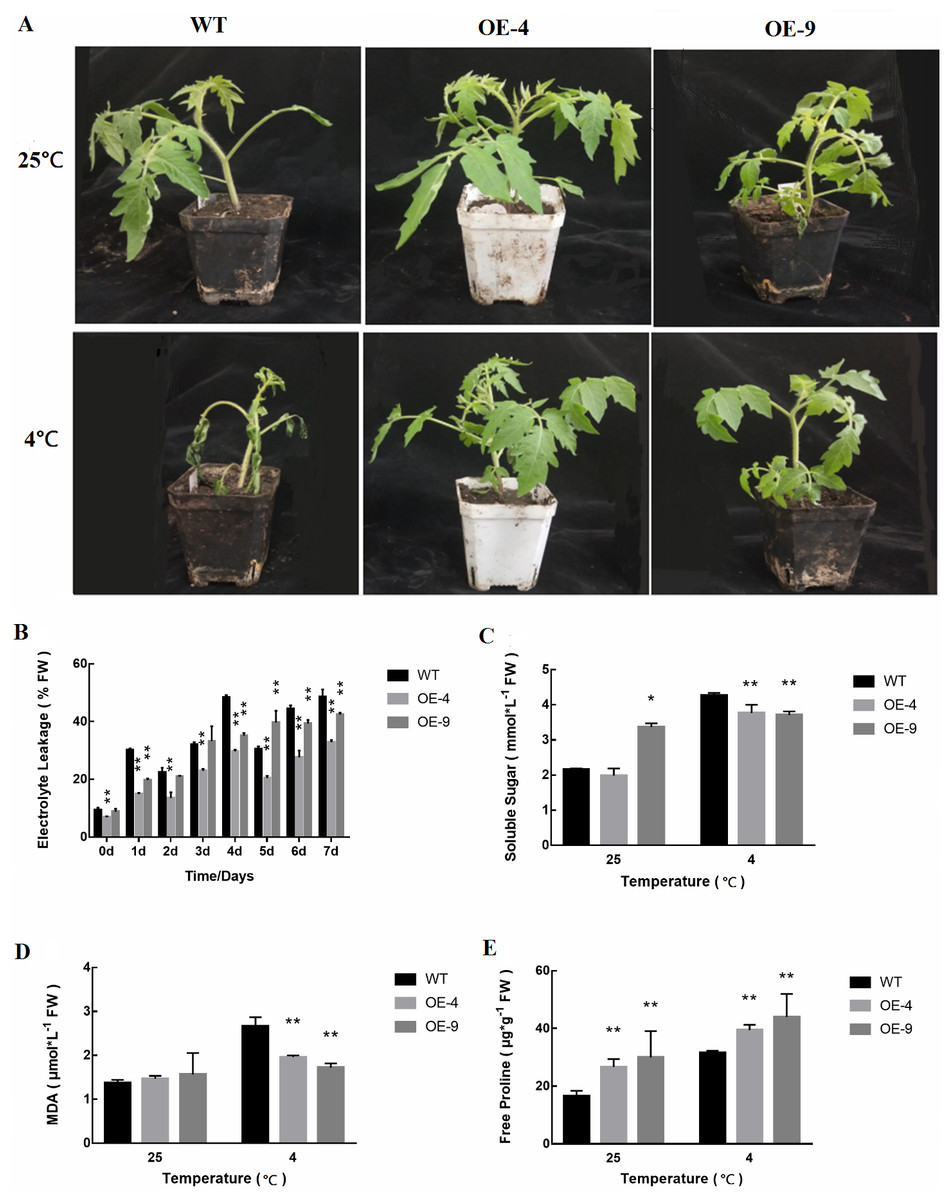
Figure 5: Cold tolerance-related trait assessment in WT and transgenic tomato plants.
(A) The phenotypes of WT and transgenic SlMYB102-overexpressing lines in response to cold stress. (B) Relative conductivity in WT and transgenic plants in response to cold stress. (C) Soluble sugar levels. (D) MDA levels; (E) Free proline contents. The data are means + SD (standard deviation) of three biological replicates analyzed by Student’s t-test; *P < 0.05; and **P < 0.01. Error bars represent standard deviation.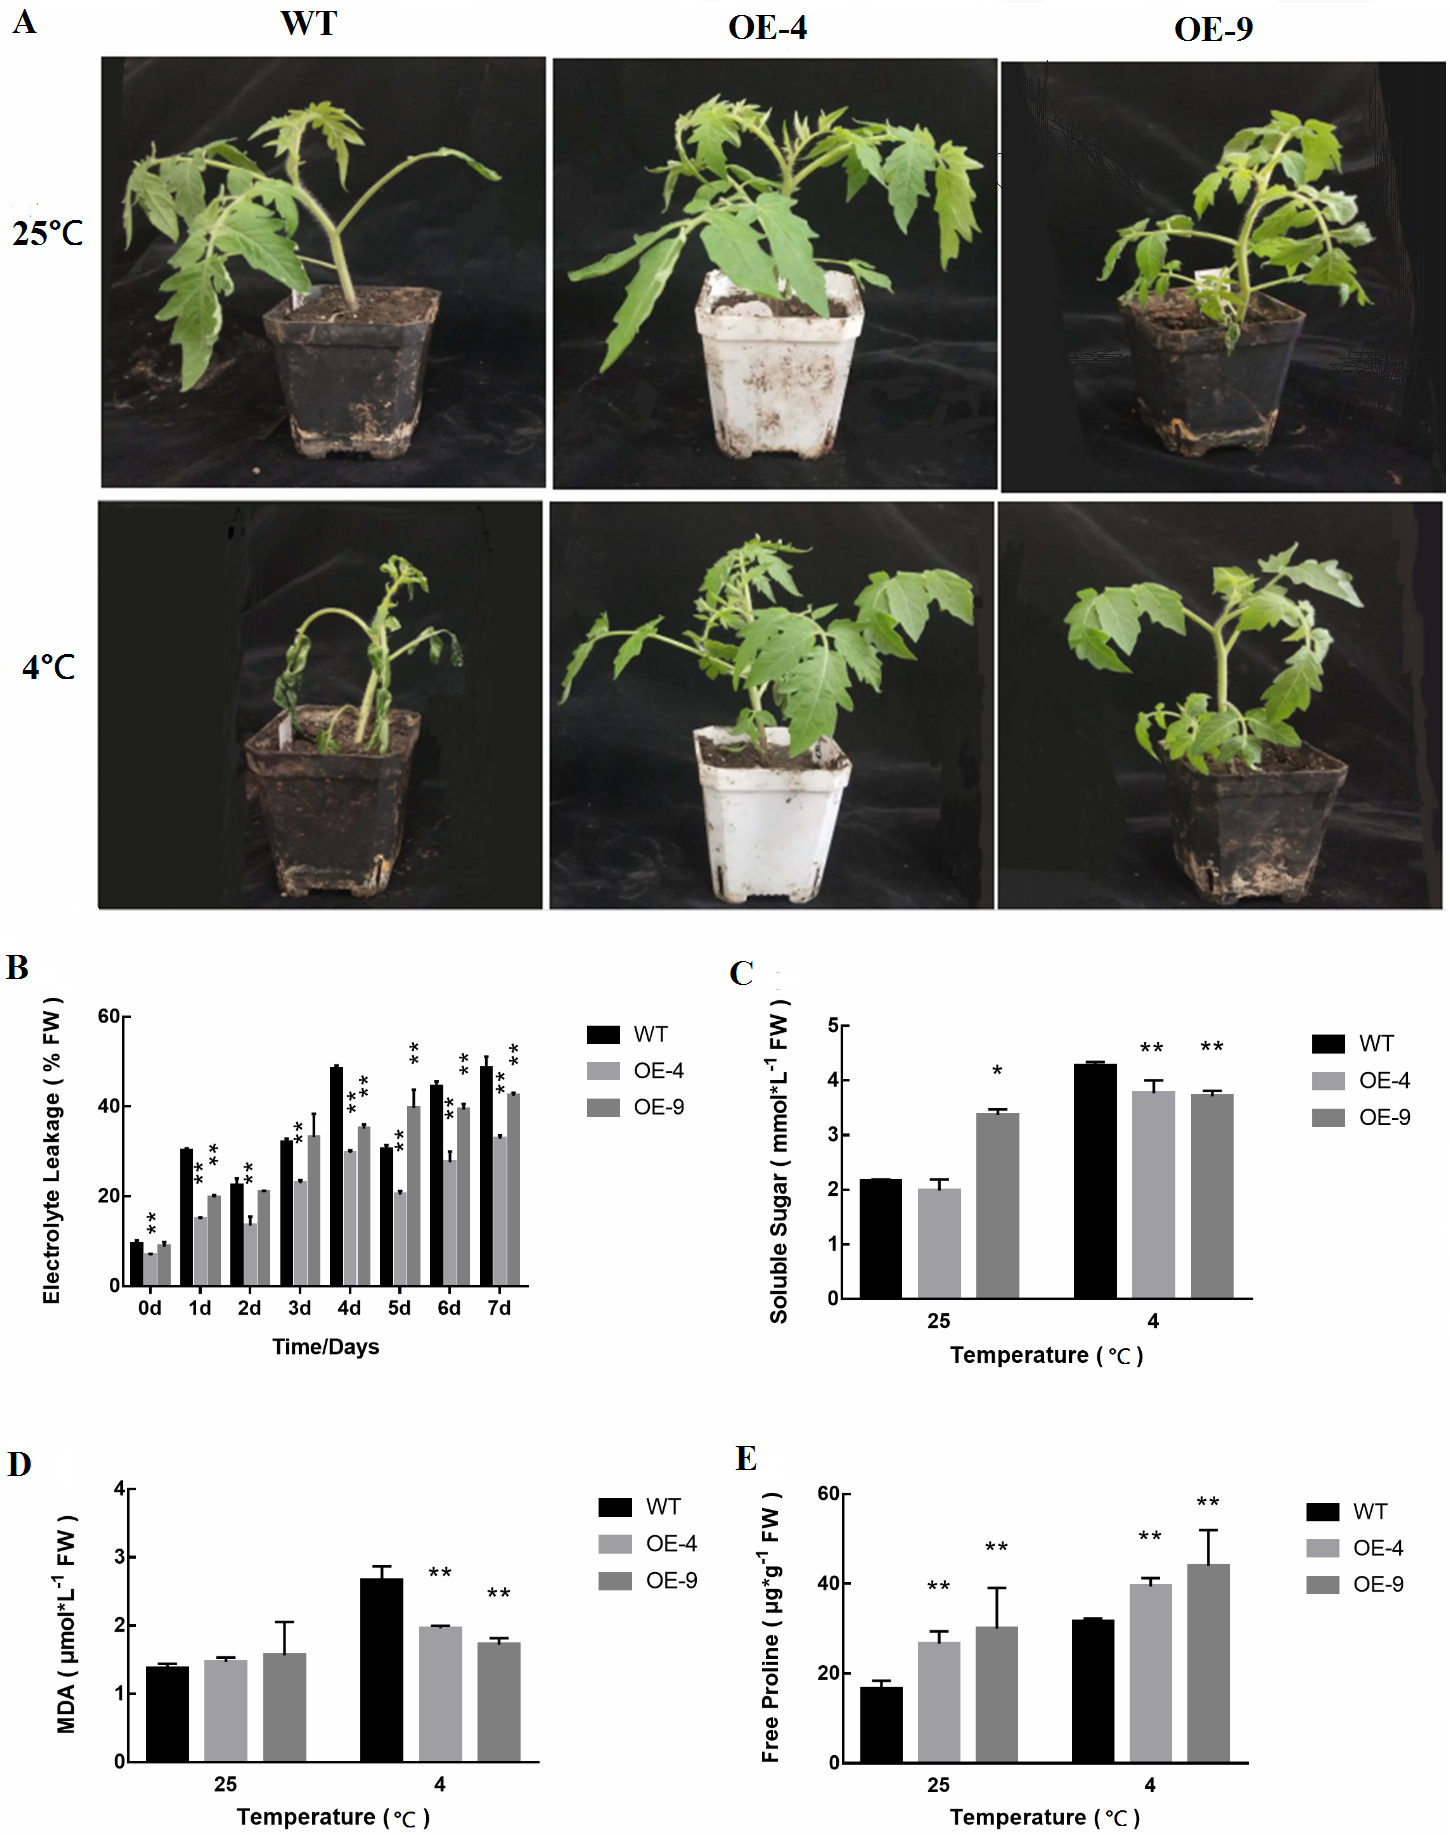
We measured the cold resistance of plants by measuring physiological parameters such as relative conductivity, malondialdehyde content, soluble sugar levels, and proline content. We found that as the time tomato plants were exposed to cold stress increased, conductivity values also rose (Fig. 5B). However, WT plants exhibited significantly higher conductivity than did SlMYB102-overexpressing transgenic plants at all analyzed time points. We found that soluble sugar levels in these plants were increased in response to cold stress (Fig. 5C). These increases were more significant in WT plants relative to transgenic plants, and this is likely due to the greater susceptibility of WT plants to low-temperature stress conditions. Interestingly, the baseline soluble sugar levels in the OE-9 transgenic strain were higher than in WT plants, potentially suggesting that these transgenic plants are better able to resist cold stress as a result of their higher internal soluble sugar levels. Upon cold stress exposure, these transgenic plants exhibited significantly lower MDA levels than did WT plants (Fig. 5D).
Proline content can serve as another readout for plant stress responses, as plant exposure to abiotic stressors including extreme temperatures, high salt levels, or heavy metal exposure can result in significant increases in proline levels (Klempnauer, Gonda & Bishop, 1982). Plant cold stress exposure can thus result in an increase in free proline levels within cells in order to maintain metabolic homeostasis. We found that at baseline the transgenic tomato plants analyzed in this study contained significantly higher proline levels than did WT controls, with proline levels increasing in both WT and transgenic plants in response to cold exposure (Fig. 5E).
Based on these analyses of the above three indicators, we were able to preliminarily posit that transgenic plants exhibit more robust cold resistance than do WT plants, which may be a result of increased soluble sugar and proline contents therein. However, further research is needed to assess exactly how SlMYB102 affects cold resistance in these plants.
SlMYB102 overexpression enhances antioxidant enzyme activity
In response to cold stress, plants exhibit increased rates of both membrane lipid peroxidation and reactive oxygen species (ROS) production (Gill & Tuteja, 2010). As such, we next measured superoxide anion accumulation in WT and transgenic plants, in addition to measuring the levels of the antioxidant enzymes catalase (CAT), oxidase (POD), and superoxide dismutase (SOD) (Figs. 6A–6D). We found that antioxidant enzyme activities were induced at significantly higher levels in SlMYB102-overexpressing plants relative to WT controls. This suggests that antioxidant defenses are more active in these transgenic plants relative to their WT counterparts, thus better protecting these cells against ROS. Superoxide anion staining further confirmed that superoxide anion levels were significantly reduced in transgenic plants as compared to WT plants (Fig. 6E), thus indicating that the overexpression of SlMYB102 alleviated cold stress-induced damage in these plants.
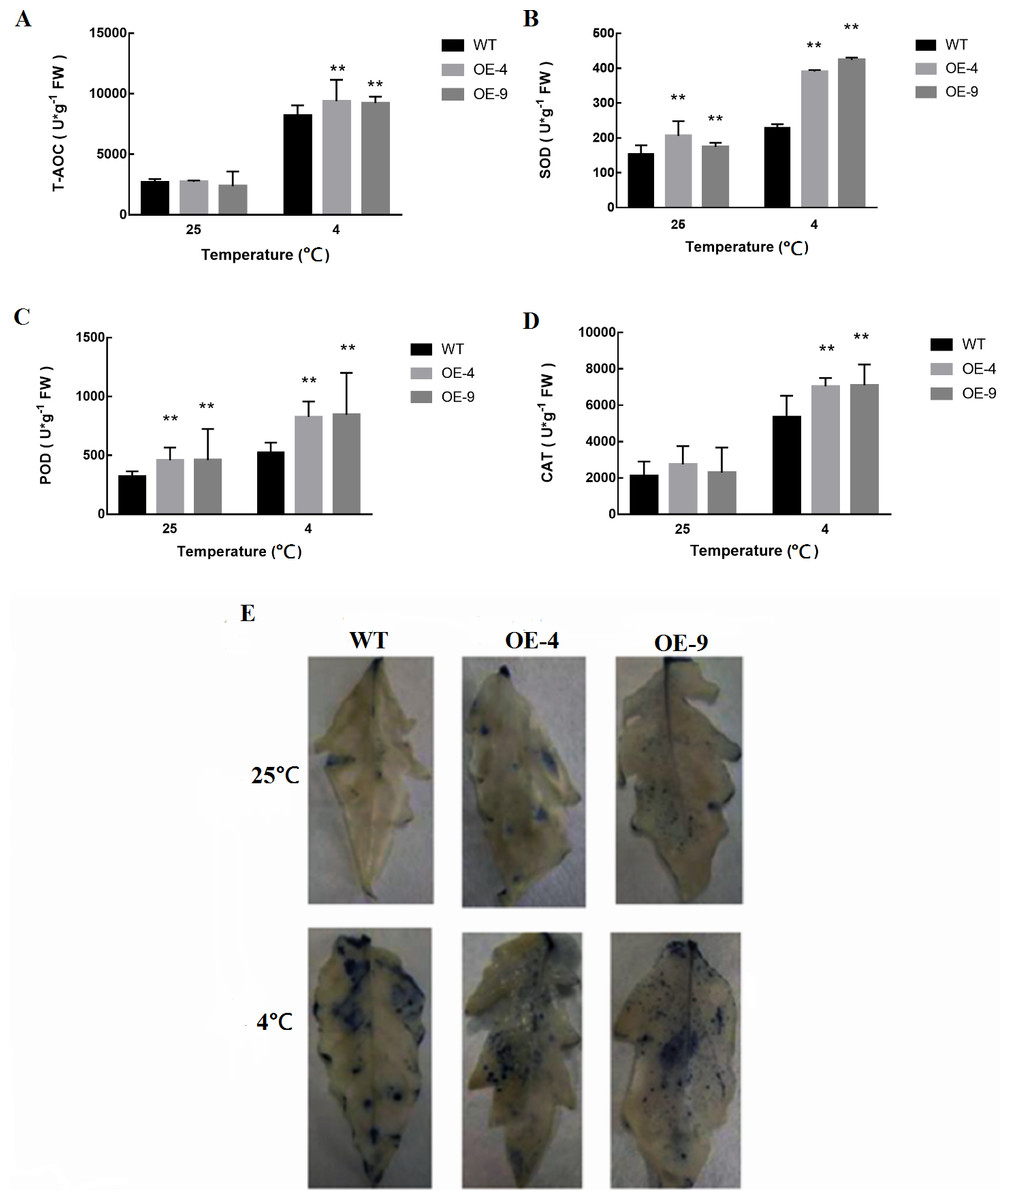
Figure 6: Measurement of antioxidant enzyme activity in WT and transgenic tomato plants.
(A) Total oxidase activity (T-AOC); (B) Superoxide dismutase activity (SOD); (C) Peroxidase activity (POD); (D) Catalase activity (CAT); (E) Superoxide anion NBT staining. The more blue parts, the darker the color, indicating more O content. The data are means + SD (standard deviation) of three biological replicates analyzed by Student’s t-test; *P < 0.05; and **P < 0.01. Error bars represent standard deviation.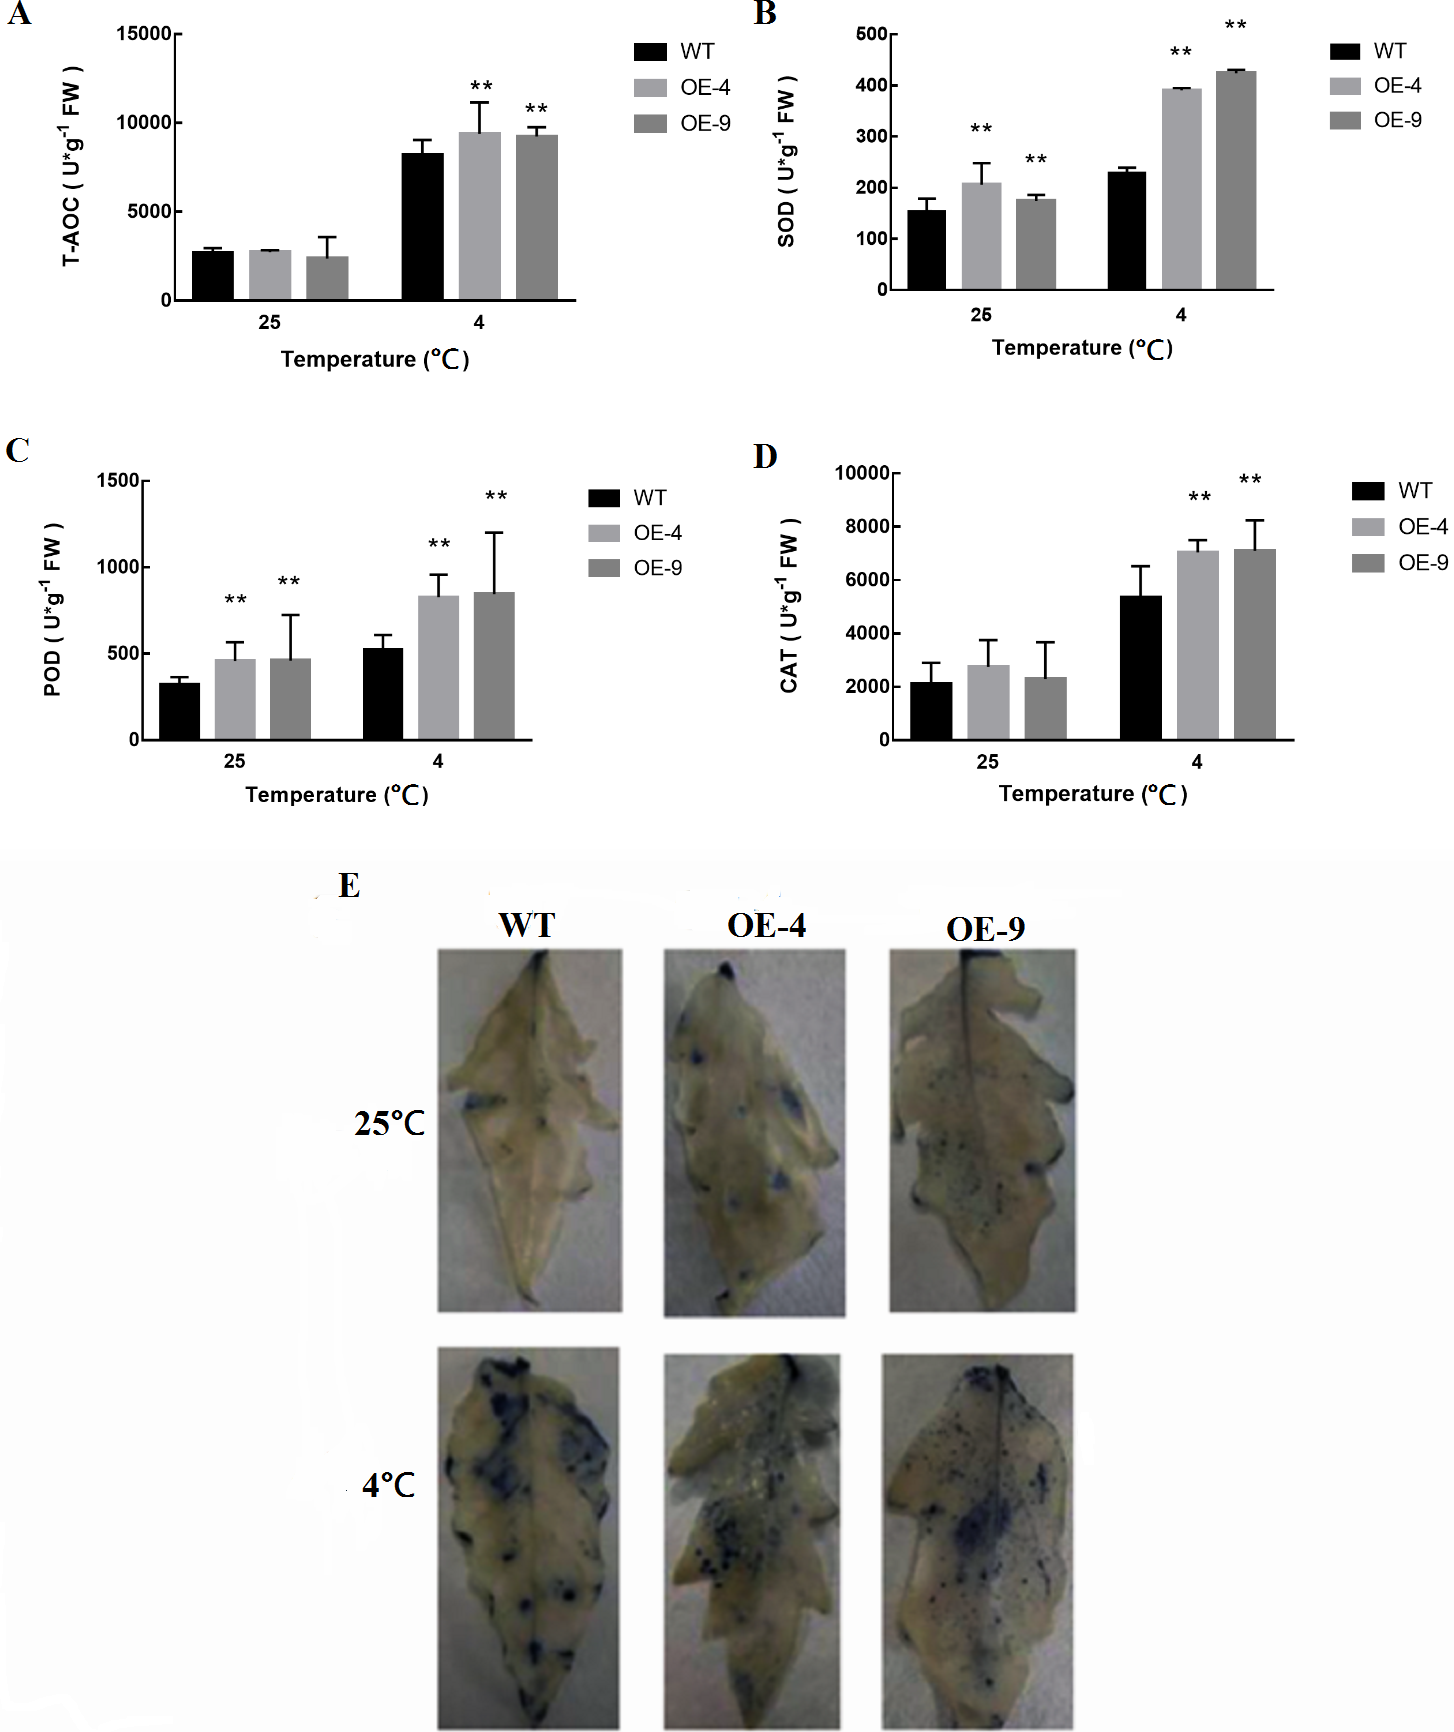
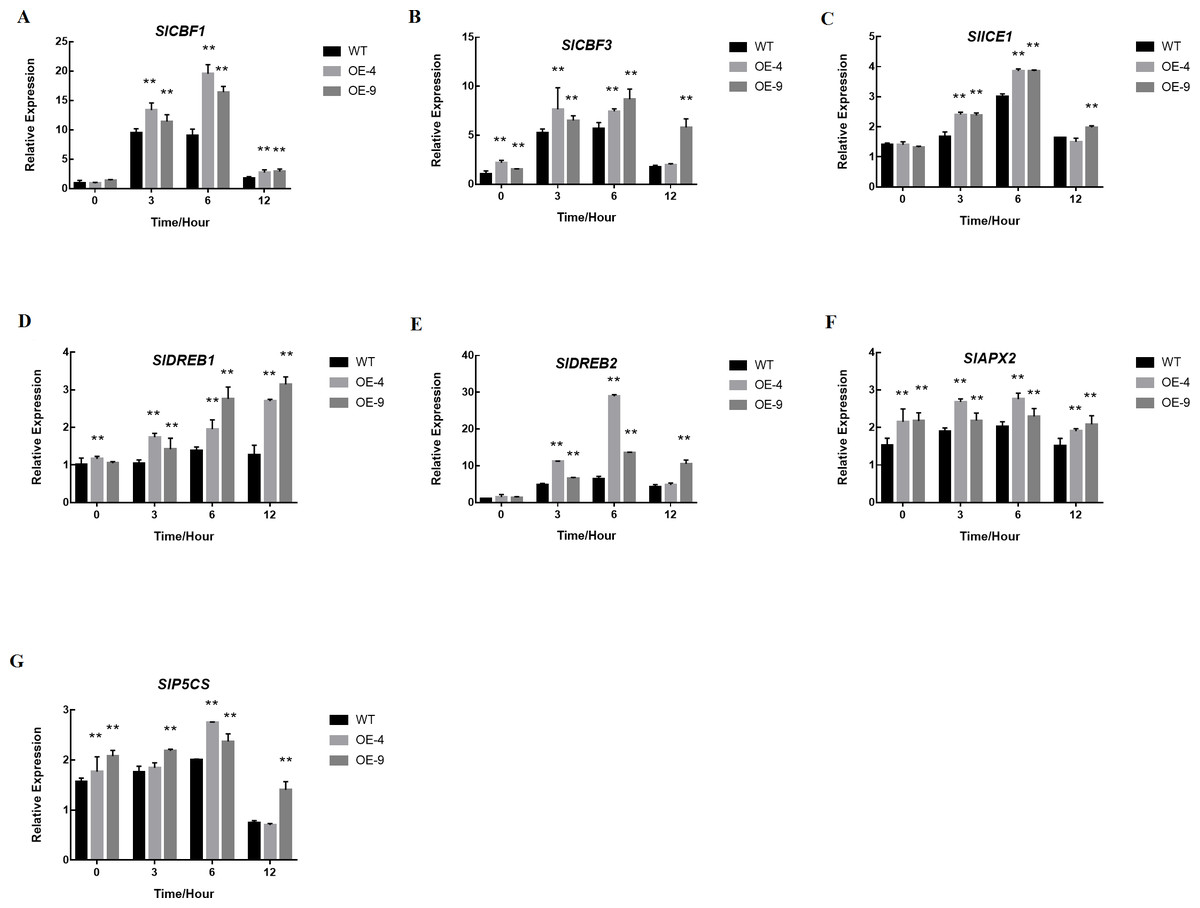
Figure 7: SlMYB102 overexpression alters the expression of cold-resistance genes.
The expression of (A) SlCBF1, (B) SlCBF3, (C) SlICE1, (D) SlDREB1, (E) SlDREB2, (F) SlAPX2, and (G) SlP5CS were measured via qRT-PCR after treatment at 4 °C for 0 h, 3 h, 6 h, or 12 h. Actin served as a normalization control. The data are means + SD (standard deviation) of three biological replicates analyzed by Student’s t-test; *P < 0.05; and **P < 0.01. Error bars represent standard deviation.
SlMYB102 overexpression alters cold resistance gene expression
Because plant cold stress responses are governed by a complex regulatory network, MYB transcription factors can actively participate in a variety of relevant regulatory pathways. In order to explore how SlMYB102 enhances cold resistance, we next assessed its role in regulating the expression of several important cold resistance genes. We also assessed key genes in the proline synthesis pathway in order to examine their relationship with cold resistance.
We observed no significant differences in the expression of SlCBF1, SlCBF3, SlICE1, SlDREB1, or SlDREB2 when comparing WT and transgenic plants at baseline, but upon treatment at 4 °C these genes were induced in a time-dependent manner, with expression in transgenic plants being significantly higher than in WT controls (Figs. 7A–7E). We additionally measured the oxidase- and proline synthesis-related genes SlAPX2 and SlP5CS, revealing both of these genes to be expressed at higher levels in SlMYB102-overexpressing plants relative to WT controls both at baseline and upon exposure to cold stress conditions (Figs. 7F–7G). This thus suggests the possibility that SlMYB102 overexpression leads to increased expression of these genes under low-temperature stress.
Discussion
The first member of the MYB transcription factor family to be identified was the avian myeloblastosis virus (AMV) v-Myb oncogene (Stracke, Werber & Weisshaar, 2001). Since this initial discovery, however, many additional MYB genes have been identified in plants, animals, and fungi. In plants, the R2R3-MYB family transcription factors have been found to be widely expressed and to play critical roles in regulating growth, development, secondary metabolism, and responses to abiotic and biotic stressors (Jung et al., 2007; Zhao, 2017). SlMYB102 is one such R2R3-MYB transcription factor that is expressed in tomatoes. By analyzing a phylogenetic tree with the Arabidopsis MYB family, SlMYB102 was found to cluster with ATMYB74 and ATMYB102, which have been shown to play an active role in A. thaliana abiotic stress responses (Xu et al., 2015; De Vos et al., 2006). SlMYB102 expression has been found to be induced in response to salt, ABA, and cold stress conditions (Zhang et al., 2020; Zhao, 2014; Chen et al., 2012; Zhao et al., 2014). All these results indicate that SlMYB102 plays an important role in tomato abiotic stress responses.
Both proline and soluble sugars are small molecules that protect plants from abiotic stress. In order to explore the role of SlMYB102 in cold stress responses, we therefore generated transgenic tomato plants overexpressing this gene. We thereby found that SlMYB102 overexpression increased proline and soluble sugar contents in tomato plants, thus improving cold resistance (Figs. 5C, 5E). This suggested that SlMYB102 enhances low-temperature stress responsiveness in these plants at least in part via regulating the synthesis or processing of proline and soluble sugars.
Plant exposure to abiotic stress conditions has previously been shown to result in ROS production (Suzuki et al., 2012). Low-temperature stress may thus lead to substantial ROS generation, in turn causing significant oxidative damage to DNA, proteins, and membrane lipids (Apel & Hirt, 2004; Choudhury et al., 2017; Mittler, 2017). Plants have evolved complex non-enzymatic and enzymatic antioxidant mechanisms that can help to neutralize and eliminate these stress-induced ROS levels, thereby protecting cells from damage. Plant antioxidant enzymes such as CAT, SOD, and POD are able to scavenge superoxide anions (Mittler et al., 2004). We found that the cold stress-induced activities of these enzymes were significantly stronger in SlMYB102- overexpressing plants relative to WT controls (Figs. 6A–6D), with a corresponding reduction in O2− contents in these transgenic plants (Fig. 6E). This thus suggests that SlMYB102 overexpression can enhance antioxidant activity in tomato plants, thereby combating cold-induced O2− production and better allowing plants to cope with low-temperature stress conditions.
In a previous study, the SlMYB102 OE tomato plants showed a semidwarf phenotype compared with the WT plants. However, the leaf epidermal cell size did not change in the OE plants compared with that in the WT plants (Zhang, Chen & Ren, 2018). Our research shows that overexpression of SlMYB102 did not cause any apparent inhibition of tomato plant growth during the seedling stage (Fig. 5A), consistent with previous studies of DREB1 overexpression in A. thaliana (Feng et al., 2019). We think that the reason for this difference may be the different tomato varieties tested, and also may be because SlMYB102 is also related to plant growth and development, although further studies will be needed to fully validate this hypothesis.
Many studies have demonstrated roles for CBF1, CBF3, ICE1, and DREB1, DREB2 in the context of plant cold tolerance, with all of these genes actively participating in the cold stress regulatory network (Sudesh, 2010; Jaglo-Ottosen et al., 1998; Liu et al., 1998; Park et al., 2015). We found that SlMYB102 overexpression significantly increased the expression of these genes (Figs. 7A–7E). All of these genes are involved in the CBF signaling pathway (Zhang et al., 2011), which may indicate that SlMYB102 is involved in CBF signaling as a means of inducing downstream cold-resistance gene expression. Plant △ ∼ 1-pyrroline-5-carboxylic acid synthase (P5CS) is a key enzyme involved in proline synthesis, and it is also important for abiotic stress responses (Li et al., 2018; Arabbeigi, Arzani & Majidi, 2019). Ascorbate peroxidase (APX) plays an important role in plant abiotic stress, and is an important index for measuring stress responsiveness (Li et al., 2019a; Li et al., 2019b; Cunha et al., 2019). Our experimental results indicated that the overexpression of SlMYB102 can increase both APX2 and P5CS expression (Figs. 7F–7G), further illustrating that SlMYB102 can promote the expression of these cold resistance genes under low temperature stress conditions.
Conclusions
In summary, SlMYB102 overexpression can improve the tolerance of tomato plants to low-temperature stress without adversely impacting the growth of tomato seedlings. The SlMYB102 gene may be involved in the CBF signaling pathway and the proline synthesis pathway, thereby enabling it to regulate low-temperature stress responsiveness in plants.
Supplemental Information
Construction of transcription activation vector
Note; BN: pGBKT7-MYB102-N end; BC: pGBKT7-MYB102-C; BF: pGBKT7-MYB102 full length; BD: pGBKT7 vector