Published online Apr 7, 2010. doi: 10.3748/wjg.v16.i13.1598
Revised: February 24, 2010
Accepted: March 3, 2010
Published online: April 7, 2010
Perfusion magnetic resonance imaging (MRI) studies quantify the microcirculatory status of liver parenchyma and liver lesions, and can be used for the detection of liver metastases, assessing the effectiveness of anti-angiogenic therapy, evaluating tumor viability after anti-cancer therapy or ablation, and diagnosis of liver cirrhosis and its severity. In this review, we discuss the basic concepts of perfusion MRI using tracer kinetic modeling, the common kinetic models applied for analyses, the MR scanning techniques, methods of data processing, and evidence that supports its use from published clinical and research studies. Technical standardization and further studies will help to establish and validate perfusion MRI as a clinical imaging modality.
- Citation: Thng CH, Koh TS, Collins DJ, Koh DM. Perfusion magnetic resonance imaging of the liver. World J Gastroenterol 2010; 16(13): 1598-1609
- URL: https://www.wjgnet.com/1007-9327/full/v16/i13/1598.htm
- DOI: https://dx.doi.org/10.3748/wjg.v16.i13.1598
Perfusion magnetic resonance imaging (MRI) refers to imaging of tissue blood flow (i.e. tissue microcirculation), which is beyond the resolution of the MR scanner to directly visualize. In the liver, perfusion MRI can be applied to measure microcirculation in the liver parenchyma or in tumors. Whilst there are techniques available for direct measurement of blood flow in macroscopic vessels, such as the portal vein and hepatic artery, such as Doppler ultrasound (US), contrast-enhanced US, xenon computed tomography (CT) or phased contrast MR angiography; these are beyond the scope of the current review. Instead, our discussions are primarily focused on dynamic contrast-enhanced (DCE) MRI techniques with tracer kinetic modeling, which allows for the quantitative characterization of parenchymal and tumor microcirculatory alterations in the liver. Selected DCE liver perfusion studies using other imaging modalities are used to illustrate the value of perfusion imaging.
In the liver, conventional characterization of focal liver lesions is reliant on observing the rate and pattern of contrast enhancement assessed visually on DCE scans. The rate and pattern of contrast enhancement reflects the time evolution of the contrast agent within the liver tissue, which occurs as a result of the microcirculatory pathophysiological changes. Perfusion MRI could extend the currently used qualitative assessment applied for the differential diagnosis of focal liver lesions, by applying quantitative metrics to describe their vascular behavior.
In the treatment of liver tumors, current therapy for hepatocellular carcinoma (HCC) includes novel anti-angiogenic agents such as sorafenib. As these drugs may have significant clinical effects without causing tumor shrinkage, the microcirculatory characteristics, such as blood flow and tumor capillary permeability, have the potential to be response biomarkers, which allow these drug effects to be confidently assessed. Furthermore, it may also be possible to explore whether the quantitative microcirculatory parameters correlate with drug exposure and whether they can predict response. Quantitative vascular measurements could also be applied to assess the efficacy of local tumor ablation such as by trans-arterial chemo-embolization (TACE), radiofrequency ablation (RFA) or yttrium-90 microsphere embolization.
The early detection of liver metastases remains challenging, but changes in the relative hepatic arterial vs portal venous blood supply allow earlier detection of microscopic liver metastases[1]. Likewise, changes in the relative contribution of hepatic arterial and portal blood flow are also observed in patients with liver cirrhosis[2-8].
Central to the assessment of liver perfusion are model-based or model-free methods that analyze the contrast concentration-time curve in focal liver lesions or liver parenchyma, derived from the DCE-MRI images. Although similar concentration-time curves may be obtained using CT and nuclear medicine studies, radiation burden is a practical concern, which becomes even more significant on repeated measurements. The ability of MRI to acquire such information without radiation burden and in a potentially more favorable scan plane (e.g. oblique coronal), to demonstrate the vascular input into the liver, are important advantages.
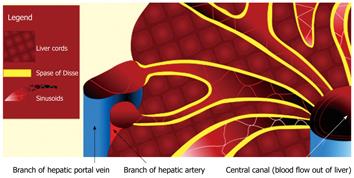
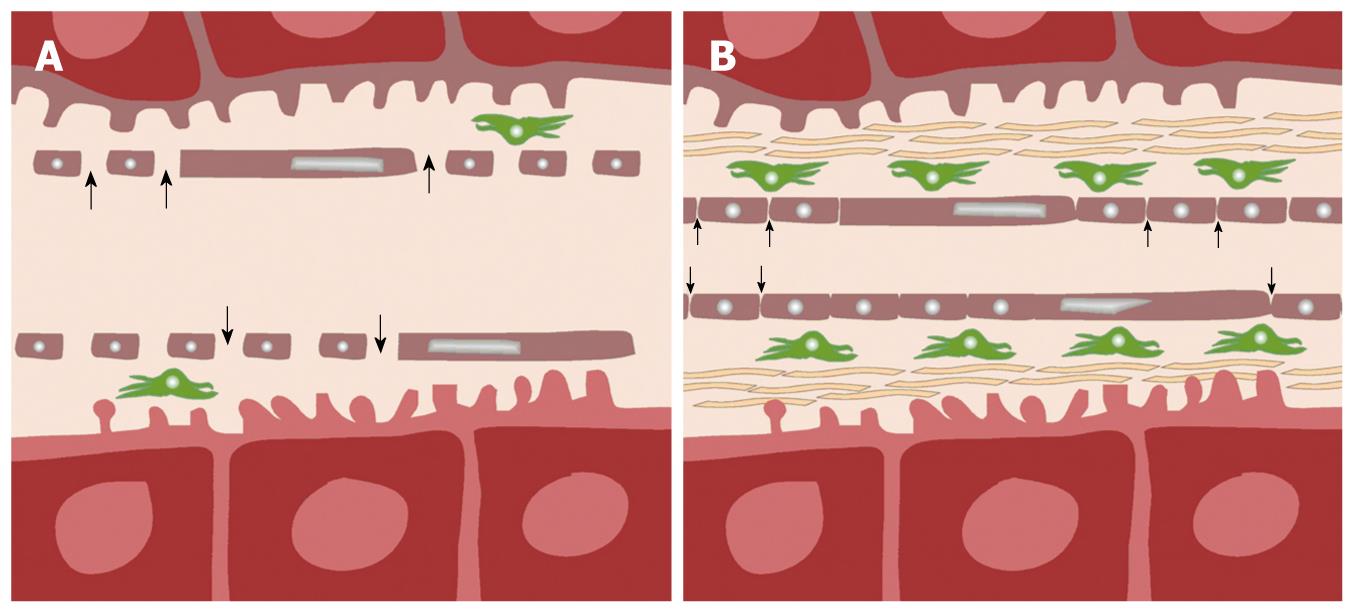
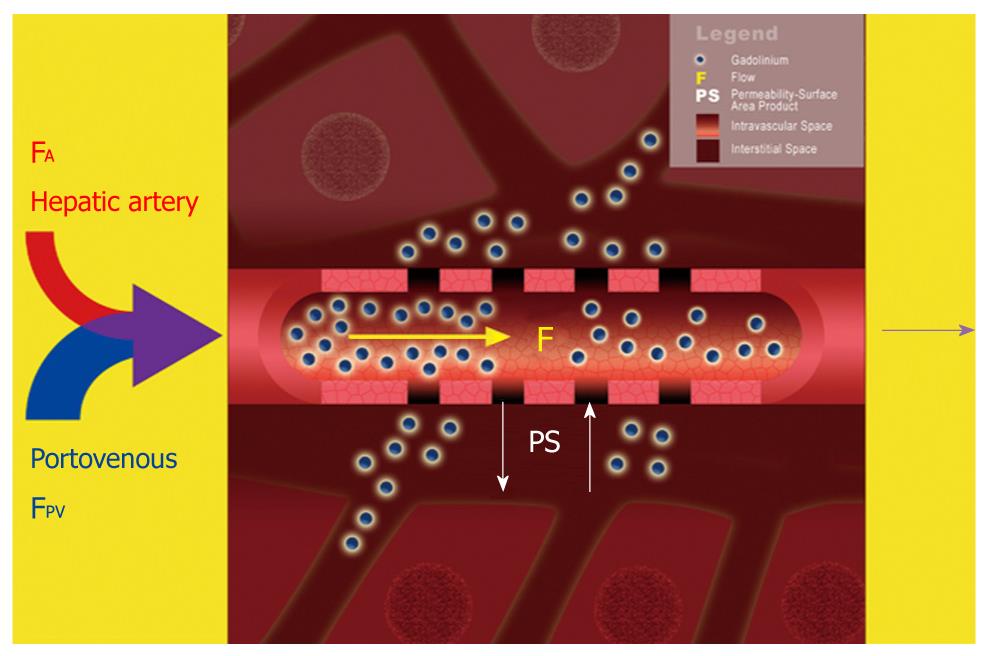
The liver is a highly vascular organ that consists of a series of porous vascular channels (sinusoids with fenestrae) that are predominantly supplied by the portal vein (75%) and supplemented by the hepatic artery (25%)[9]. The two arterial inputs mix in the sinusoids at different time intervals to supply the liver cords. There is a small space (Space of Disse) that separates the sinusoids from the tightly ordered hepatic cords, which comprise two rows of closely apposed hepatocytes. The Space of Disse may be considered as an interstitial space within the liver. However, due to the large size of the fenestrae of the sinusoids, there is usually free exchange of low-molecular-weight compounds (e.g. gadolinium contrast medium) between the vascular space (sinusoids) and the interstitial space (Space of Disse) (Figures 1 and 2)[10].
In cirrhosis, due to sinusoidal capillarization, there is loss of normal fenestrae, due to deposition of basement membrane and new formation of capillary tight junctions along the sinusoids. There is also deposition of fibers by activated Ito cells (hepatic stellate or antigen presenting cells), which results in enlargement of the Space of Disse. Consequently, transfer of low-molecular-weight gadolinium contrast medium from the vascular sinusoids into the interstitial space becomes increasingly impeded (Figure 2)[11].
In liver metastases and HCC, tumor blood supply is initially derived from proliferation of the sinusoidal cells that become capillarized with loss of fenestrae and formation of basement membrane. This also results in a significant barrier to the free passage of low-molecular-weight contrast medium between the sinusoidal space and interstitial space of the tumor. As the tumor continues to grow, there is recruitment of new vessels directly supplied by the hepatic artery (neoarteriogenesis). This is a prominent feature of HCC but can also be seen in the peritumoral area of liver metastases[12-15]. Such arterialization of the vascular supply is typical of malignant liver tumors.
For perfusion MRI of the liver, injection of a low-molecular-weight gadolinium-chelate contrast is necessary, and this is administered through a wide bore (20G or larger) intravenous cannula sited within a large antecubital vein. Contrast medium is injected using a programmable pump injector, which ensures uniform and rapid contrast delivery as a tight bolus. The amount of contrast medium administered is based on body weight. For example, using Gd-DTPA (Magnevist®, Bayer-Schering, Germany), 0.1-0.2 mmol of contrast medium/kg body weight is typically administered. Once the contrast medium is injected, imaging of the liver commences using an MRI sequence that is capable of rapid and repeated measurements, to enable the passage of contrast medium through the liver to be tracked accurately. Liver perfusion imaging is typically performed using T1-weighted MRI sequences. On T1-weighted imaging, liver or tumor perfusion is observed as increasing enhancement as contrast medium passes through the liver or tumor.
With regard to technical details, a T1-weighted 3D spoiled gradient echo technique with variable flip angles is useful. Parallel imaging could be applied to reduce scan time and improve temporal resolution. Compared with 2D imaging sequences, the 3D technique eliminates inaccuracies due to the radiofrequency excitation pulse profile, and also has the advantage of better signal-to-noise ratio. However, the peripheral image sections may still have to be excluded from analysis because they may have unfavorable slice profiles or be degraded by wrap artifacts that result from phase under-sampling. T1 mapping or calibration, a necessary step for quantitative analysis, can be performed using the variable flip angle method described by Wang et al[16]. As the gadolinium contrast concentration is inversely proportional to change in the reciprocal of T1, a gadolinium contrast concentration-time curve of the liver or tumor can be generated, which is then used to derive quantitative vascular perfusion indices. Table 1 provides an example of a liver perfusion MRI protocol implemented on a commercial scanner. It is important to note that such an imaging sequence may vary from one imaging platform to another, and it is important to engage the help of an experienced clinical scientist to ensure that the performance of the sequence is optimized. Although some workers have advocated simpler methods of estimating gadolinium concentration by measuring differences in signal intensities before and after contrast arrival in the liver, we would like to caution that the success of this simplified approach might be dependent on the imaging sequence, as well as the range of signal intensity and tracer concentration encountered.
| MRI platform | Avanto (Siemens, Erlangen, Germany) |
| Type of pulse sequence | 3D FLASH |
| TR | 2.72 ms |
| TE | 1 ms |
| Partition thickness | 8 mm |
| Slices per slab | 10 |
| Matrix | 256 × 159 |
| Phase encode direction | Anterior to posterior |
| Number of averages | 1 |
| Sensitivity encoding factor | 2 |
| Flip angle before contrast | 2º and 14º |
| Flip angle after contrast | 14º |
| Bandwidth | 490 Hz |
| RF spoiling | Yes |
| Temporal resolution | 1.98 s per slab of 10 slices. |
| Precontrast scans | 10 measurements of each flip angle averaged for calculation of native T1 |
| Gadolinium injection | 0.2 mmol/kg at 3 mL/s followed by 20 mL flush |
| Patient respiration | Quiet breathing |
| Post contrast scans | A total of 180 consecutive measurements. Inject contrast only when the 20th measurement has been completed |
| Scan sections to use for processing | Center 6 image sections only |
In order to track liver perfusion reliably, MRI of the liver should employ a high temporal resolution technique (i.e. repeated imaging of the same area in the liver about every 4 s), in a scan plane that shows the lesion or area of interest. Ideally, the aorta and the portal vein should be included in the same image sections. Hence, an oblique imaging plane (e.g. oblique coronal) afforded by the MRI technique would be particularly helpful to ensure all these structures are included. The signal intensity changes within these structures, together with the T1 calibration maps, are used to derive the gadolinium contrast concentration-time curves in the liver and tumors. Once the gadolinium contrast concentration-time curve in an area of interest is known, knowledge of the contemporaneous contrast enhancement within the aorta and portal vein allows analytic methods to be applied to extract quantitative or semi-quantitative parameters that describe the vascular properties. The MR images may also be qualitatively assessed by visual survey for areas of increased enhancement relative to the normal liver parenchyma. However, such comparisons can be subjective. The various approaches to extracting quantitative and/or semi-quantitative liver perfusion data are discussed in the next section.
One of the challenges to acquiring high quality liver perfusion MRI is respiratory motion, which can substantially degrade image quality. It is currently a subject of debate whether to acquire images during breath-hold or quiet respiration. Imaging in quiet respiration is widely performed, which allows rapid uninterrupted image acquisition for high temporal resolution data. However, the images often need to be aligned using image registration techniques, which can be complex, prior to quantitative analysis. Furthermore, respiration can result in through-plane motion and non-linear tissue deformation that cannot be easily overcome. For these reasons, imaging in sequential breath-hold has been advocated as a method to minimize the effects of respiratory motion. Images are acquired during suspended respiration (usually expiration), followed by a short period of normal breathing, after which respiration is again suspended for image acquisition. Imaging during expiration can be monitored by navigator control. Breath-hold imaging minimizes the need for complex image registration, but the main potential disadvantage is decreased temporal sampling because images cannot be acquired continuously. One method which can be used to improve temporal sampling of breath-hold studies is to acquire two datasets (instead of one) during each breath-hold[17]. Single breath-hold studies have also been reported. In single breath-hold studies, patients are required to breath-hold for 40-60 s during which the first passage of gadolinium contrast is observed[18].
Once the MRI data have been acquired, they have to be analyzed in a meaningful way to extract information that describes tissue vascularity. Dynamic MRI data can be processed using a model-free or a model-based approach, with the former being simpler to implement.
Using model-free approaches, semi-quantitative descriptions of liver perfusion can be derived by observing the rate of liver tissue signal change in the arterial and portovenous phases of contrast enhancement. One semi-quantitative description of liver vascularity is the hepatic perfusion index (HPI), which describes the relative contribution of arterial vs portovenous flow to the total liver perfusion. The HPI has been investigated using different imaging techniques, and appears to provide biologically meaningful information despite its relative simplicity.
However, the quantitative model-based approach is appealing because it may provide more sophisticated descriptions of tissue vascular properties, by underpinning the data analysis on mathematical assumptions that reflect alterations in the underlying pathophysiology. Both model-free and model-based approaches are being widely investigated; each has provided unique information that has shown to improve liver disease assessment.
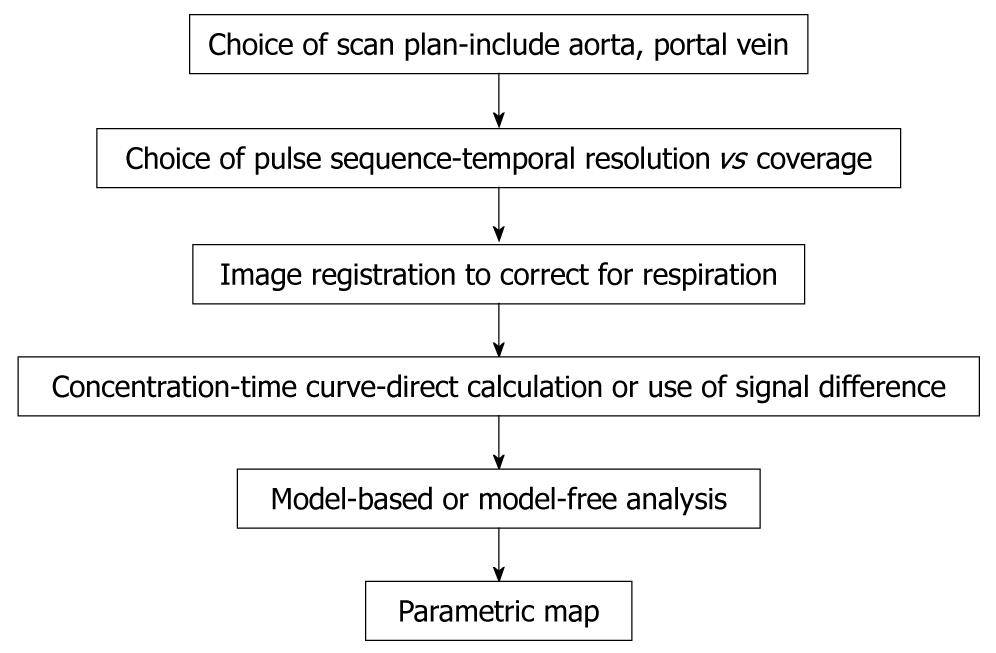
A simplified schema which shows the workflow for performing DCE-MRI is shown in Figure 3.
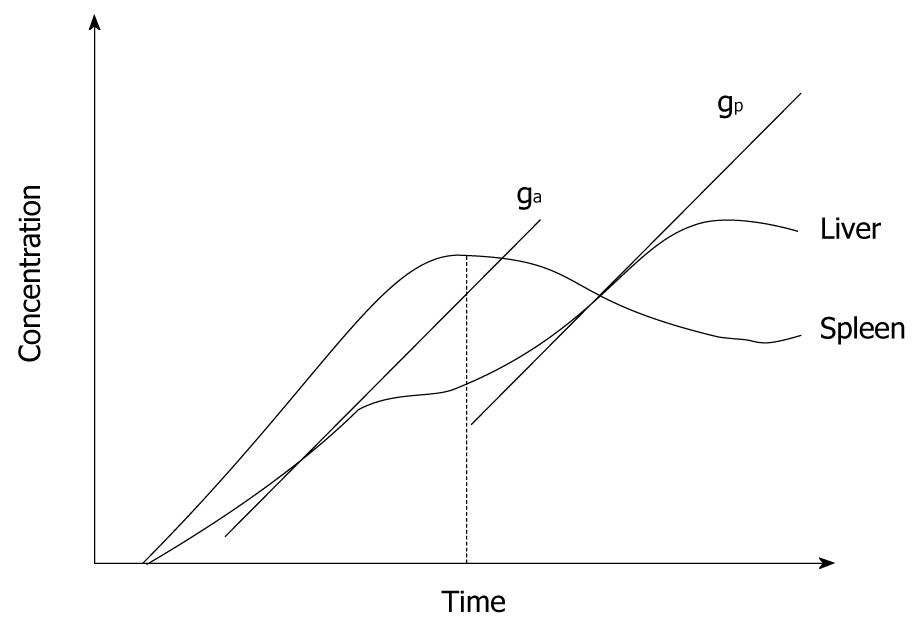
These methods are based on simply observing the MR signal changes that result from the passage of contrast agent through the liver parenchyma or liver tumor, but may not directly relate these to the contemporaneous change in the aorta or portal vein. Disease characterization is based on the fact that the perfused liver or tumor shows enhancement with the arrival of contrast agent and therefore perfusion can be estimated by the rate of tissue enhancement. Hence, most model-free approaches use parameters derived from the initial slope of the tissue signal intensity-time or contrast concentration-time curve (Figure 4).
One semi-quantitative index that can be calculated using the model-free approach is the HPI. The HPI was first proposed by Miles et al[2]. HPI refers to the proportion of hepatic perfusion that is derived from the hepatic artery, and it can be calculated using the following formula: arterial perfusion/arterial perfusion + portal venous perfusion). Miles et al[2] have used the time to peak in the splenic enhancement curve to distinguish between the arterial and portal venous phases of the liver. Liver arterial perfusion is then estimated by the maximum slope in the liver enhancement curve before the splenic peak, divided by the peak aortic enhancement (Figure 4). Correspondingly, liver portal venous perfusion is estimated by dividing the maximum slope in the liver enhancement curve after the splenic peak by the peak aortic enhancement (Figure 4).
Blomley et al[3] have further refined calculation of portal venous perfusion by removing the contribution of the hepatic artery from the liver contrast concentration-time curve by subtracting from it a scaled splenic contrast concentration-time curve. This is because the spleen is predominantly supplied by the aorta and not by the portal vein. Using the arterially subtracted liver contrast concentration-time curve, the portal venous perfusion is estimated by dividing the maximum slope of the arterially subtracted liver curve by the peak portal enhancement. This more direct method of estimating portal vascular contribution has also been advocated by Tsushima et al[19]. However, liver arterial perfusion can be estimated in a similar way as proposed by Miles et al[2].
The key advantage of using model-free approaches is that they are relatively easy to derive and do not require complex computation.
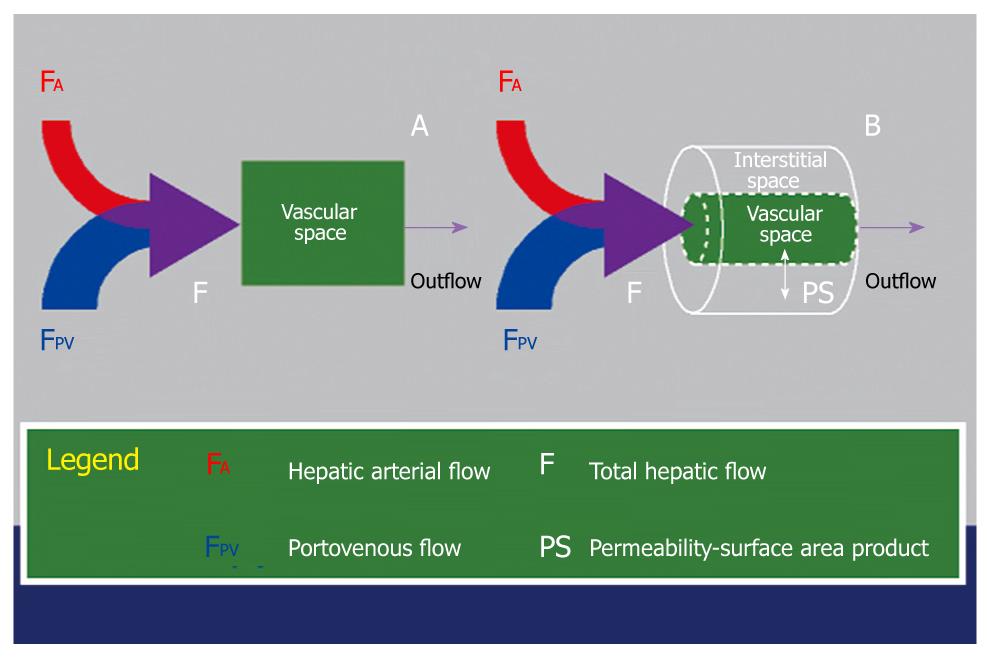
Applying tracer kinetic modeling enables quantitative vascular information to be extracted from temporally sampled MRI data, when the passage of contrast medium through the liver parenchyma or tumor is observed over time. Generally, an assumption is made that the imaged voxel contains a supplying impermeable artery that leads to a permeable capillary that leaks tracer (gadolinium contrast) into the interstitial space (Figure 5). The tracer is cleared from the voxel via an impermeable vein. However, the vessels and the interstitial space are beyond the resolution of the MRI scanner to directly image. What is measured by the MRI scanner is the average concentration of the tracer at any one time (reflected by the measured signal intensity) within the image voxel, which changes as contrast medium courses through.
Tracer kinetic modeling uses mathematical curve fitting to describe the tissue contrast concentration-time curves. If the contrast concentration-time curve of the vascular supply is known (arterial input function), subsequent mathematical operations by convolution or deconvolution allow quantitative vascular parameters to be derived that best fit the tumor or tissue contrast concentration-time curves. Such an approach could be applied to tumor and non-tumor tissues, although the mathematical and pathophysiological assumptions may be different for each. Using one particular kinetic model (e.g. distributed parameter model), quantitative parameters such as hepatic arterial flow, portal venous flow, fraction of total flow contributed by hepatic artery, capillary permeability-surface area product (PS), percentage of intravascular space (v1), percentage of interstitial space (v2), and mean transit time (MTT) are derived. However, depending on the mathematical model applied and physiological assumptions made, variants of such quantitative parameters are obtained. Hence, when applying tracer kinetic modeling to clinical studies, it is important to state the choice of kinetic model employed at the outset. Currently, there is no consensus as to which kinetic model is best suited to evaluate the liver, and development of an international consensus in this area would be welcomed.
It has been observed that a hypervascular tumor (usually a tumor with a larger vascular space relative to the interstitial space) shows a pattern of rapid arterial enhancement followed by washout, whereas a hypovascular tumor (usually a tumor with a larger interstitial space relative to the vascular space) shows progressive enhancement. These observations could also be explained by considering tracer kinetic modeling.
A hypervascular tumor is predominantly supplied directly by hepatic arterial neovessels. As the intravascular space is relatively larger than the interstitial space, the average concentration imaged by the voxel predominantly reflects changes in the intravascular space. In such lesions, there is rapid and strong enhancement in the arterial phase. However, in the equilibrium phase, the contrast redistributes to the interstitium and the rest of the body. This reduces the concentration of tracer in the tumor vascular space and is visualized as contrast wash-out within the voxel.
A hypovascular tumor may be supplied by the hepatic artery and the portal vein. As the interstitial space is relatively larger than the intravascular space, the averaged contrast medium concentration within the image voxel predominantly reflects changes in the interstitial space. Hence, there is faint enhancement in the arterial phase as contrast agent diffuses into the relatively large interstitial space. With continued blood flow in the portal venous phase, more contrast medium diffuses outwards and the concentration in the interstitium increases. In the equilibrium phase, although the tracer concentration in the vascular space has reduced due to redistribution to the rest of the body, it is still higher than the concentration in the tumor interstitium. Hence, there may even be a net efflux of contrast medium into the interstitium in the equilibrium phase, and such a tumor may demonstrate a pattern of progressive enhancement.
Clearly, the above explanations could be simplistic, as other measurement factors determine the degree of tumor enhancement. Nevertheless, these descriptions can help us to appreciate how the pathophysiological differences in different disease processes could account for their imaging behavior.
Several kinetic models are currently in use for the assessment of liver perfusion. A detailed mathematical analysis of these is beyond the scope of this review. Kinetic models applied to the liver vary according to the physiological assumptions made, and can broadly differ in the following ways.
Single-input vs dual-input: Single-input models assume that the vascular input is derived from the hepatic artery only, whereas dual-input models assume that the vascular input is derived from both the hepatic artery and the portal vein. Dual-input models are more physiological, although in tumors, where the blood supply in highly arterialized, assumption of a single vascular input may suffice to approximate the vascular behavior.
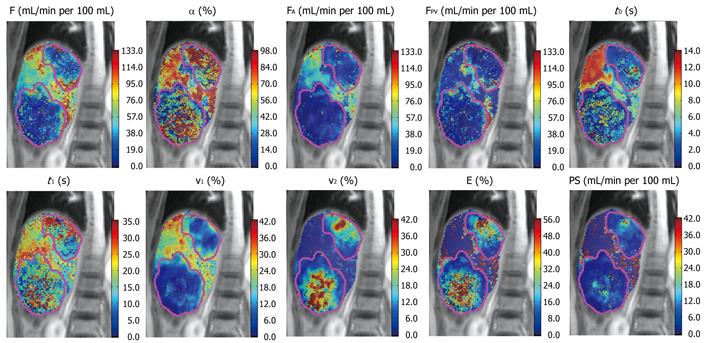
Single-compartment vs dual-compartment: Single compartment models assume that the contrast is confined to only one compartment (i.e. vascular space), whereas dual compartment models assume that there is dynamic distribution of contrast between two compartments (i.e. the vascular space and the interstitial space). Single-compartment models are computationally simpler and could be applied as an approximation for the normal liver, because the Space of Disse communicates freely with the sinusoids. Dual-compartment models are computationally more demanding but may give a better reflection of the microcirculation of the diseased liver, resulting from tumor or cirrhosis[4,20] (Figure 6).
Conventional compartment (CC) model vs distributed parameter (DP) model: In several kinetic models, the assumption is made that there is instantaneous mixing or equilibrium of the contrast medium along the entire course of a vessel. We term these as CC models. One example of a CC model is Toft’s model[21]. Another approach takes into account a concentration gradient within the vascular space. This approach is called the DP model. CC models are simpler to implement and computationally easier to solve but make more assumptions about the microcirculation. By comparison, DP models are more complex, which attempts to make fewer assumptions about the microcirculation, but are computationally more intensive and require higher temporal resolution data to derive meaningful results.
Derived microcirculatory parameters: Generally, dual compartment models are necessary to extract parameters that describe the interstitial space, e.g. v2, PS and extraction fraction (EF) using the DP model; or extracellular extravascular volume using the Toft’s model. Such parameters cannot be derived using a single-compartment model. Single compartment models allow for estimates of blood flow, volume of distribution and mean transit time.
Clearly, the choice of the kinetic model depends on many factors including local expertise, available software to perform the perfusion analysis, understanding of the disease pathophysiology, MRI measurement technique applied, and the quality (spatial and temporal resolution) of the MRI data. At the time of writing, only a few commercial softwares are available to undertake such analyses, and many research groups are therefore reliant on self-scripted software for data evaluation. Not surprisingly, this has led to disparate efforts in developing analysis tools, which are often institution-specific and non-standardized. The lack of standardization in the methodologies applied for data analysis is an acknowledged issue by researchers in the field, and there is fortunately increasing international efforts towards the harmonization and standardization of imaging acquisition and data analysis. Such developments are paramount for the wider clinical adoption of the technique and institution-vendor partnerships are being developed to address such challenges.
Some of the kinetic modeling approaches that have been applied in the published literature are summarized in Table 2.
| Study | Diseases | Comment |
| Single-input, single compartment, CC model | ||
| Scharf et al[48] | Preclinical study in pigs | Experimental model of normal liver in pigs. Only arterial input from hepatic artery taken into account. Such a model may lack physiological realism, especially when there is substantial vascular input contribution from the portal vein |
| Single-input, dual-compartment, DP model | ||
| Sahani et al[30] | HCC | Single input assumed because majority of vascular input to HCC is derived from hepatic artery. Dual-compartment model used to probe interstitial space and PS, which can be substantial in tumors. DP model implemented as standard on General Electric (GE) perfusion software 2.0 used for analysis |
| Dual-input, single-compartment, CC model | ||
| Materne et al[45-47] | Normal and cirrhotic livers | Assumption of single compartment based on understanding that the fenestra in the sinusoids of liver are extremely porous and allows free exchange of low-molecular-weight contrast tracers between the vascular and the sinusoidal interstitial space. To simplify calculations, assumption was made that there was instantaneous mixing of contrast medium from the dual input[6,7,27,45-47,49] within the single compartment. In this way, quantitative parameters such as arterial perfusion, portal venous perfusion, MTT and volume of distribution (Ve) could be derived. Cuenod et al[27,49] applied a deconvolution technique to fit these parameters, and variants of such a model were also used by Funabasam et al[50] and Miyazaki et al[51] |
| Cuenod et al[27,49] | Metastatic disease | |
| Dual-input, dual-compartment, DP model | ||
| Koh et al[4,20] | Metastases, HCC and cirrhosis | The DP model applies a concentration gradient within the vascular space. Parameters derived include, arterial flow, portal venous flow, fractional arterial flow, permeability, fractional intravascular space, fractional interstitial space, MTT, contrast arrival time. A dual-input dual-compartment approximation of the DP model is used commercially (CT Perfusion 3.0; General Electric, Milwaukee, USA) and was also adopted by Chen et al[42,52,53] in perfusion studies of the liver |
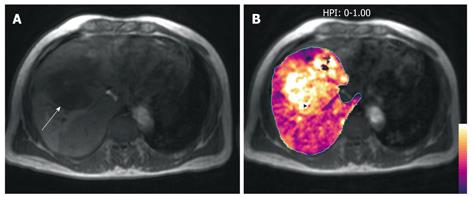
Model-free approach: Several studies have demonstrated the potential of perfusion imaging to detect changes in the liver of patients at risk of liver metastases. Totman et al[22] have shown that there is a difference in the portal perfusion index (PPI) between patients with and without cancer. Leggett et al[1] have observed that the HPI is elevated in patients with overt metastases compared with those without metastases. In another study, Tsushima et al[23] have found that the normal looking liver in a patient with liver metastases shows a reduction in the PPI, which suggests that there is potential for using liver perfusion studies to detect microscopic metastases. These cross-sectional imaging observations have been corroborated by nuclear scintigraphy studies[24,25]. Despite the reported relationship between high HPI and low PPI with increased likelihood of liver micrometastases in patients with cancer, few studies have had longitudinal follow-up to validate the subsequent development of macroscopic liver metastases. For example, in the study by Leggett et al[1], follow-up data were only available in eight patients, of which three who subsequently developed macroscopic liver metastases showed decreased portal perfusion. Although there is great potential to use liver perfusion studies to detect or predict microscopic liver metastases, more work involving longitudinal studies is required to establish its clinical role (Figure 7).
Meijerink et al[26] have found functional liver perfusion maps to be helpful supplements to the routine radiological diagnosis of liver metastases. Compared with routine four-phase CT, total-liver-volume CT perfusion studies with calculation of the HPI increased the sensitivity of metastases detection to 89.2% from 78.4% and specificity to 82.6% from 78.3%. Four out of a total of 37 metastases were detected with the help of perfusion maps. Perfusion CT maps increase the conspicuity of metastatic disease because of the increased perfusion at the tumor rims, which makes liver metastases appear larger, thus facilitating the detection of smaller lesions.
Model-based approach: There have been few studies using a model-based approach for evaluating liver metastases. Cuenod et al[27] have applied a dual-input single-compartment model in rats and have observed that the presence of micrometastases in an apparently macroscopically normal liver resulted in a 34% decrease in portal blood flow and a 25% increase in the MTT for blood to pass through the liver. The changes were similar for macrometastases but more marked.
Koh et al[20] have employed a dual-input dual-compartment DP model in three patients with liver metastases for a technical validation study. Using the particular model, they found that the normal liver had near zero interstitial space volume and PS (which may be explained by the large fenestrae allowing free contrast medium exchange between the Space of Disse and the liver sinusoids), and that liver metastases have a non-zero and finite interstitial space volume and PS. Using this quantitative technique, there is an increase in the arterial fraction (arterial flow/sum of arterial and portal flow) to the metastases, although the portal flow remains significant (Figure 8). These observations of the difference in kinetic modeling behavior between the normal liver and liver metastases are supported by histopathological observations reported by Liu and Matsui[12]. Thus, the dual-input dual-compartment DP model appears to have the potential to characterize microcirculatory pathophysiology but larger studies are required to confirm the initial findings.
Model-free approach: Abdullah et al[28] have studied the differences between colorectal metastases and HCC and have found no significant difference in HPI between the two malignant entities. However, there is an increase in arterial flow, portal flow, and total blood flow in HCC compared to colorectal metastases. The distribution volume is also observed to be higher in HCC.
Model-based approach: Fournier et al[29] have applied the dual-input single-compartment model in a rat HCC model and have found that HCC is characterized by higher arterial flow and lower portal flow.
Sahani et al[30] have employed a single-input dual-compartment DP model in patients with HCC and have found that blood flow, blood volume and PS are higher in well-differentiated HCC compared with moderately or poorly differentiated HCC, which suggests that such vascular quantification could yield information on tumor grade.
Koh et al[4] have used the dual-input dual-compartment DP model in four patients with HCC and have measured the fractional interstitial space and associated extravasation parameters (PS and extraction ratio). HCC is characterized by increased arterial flow, increased total blood flow, as well as early contrast agent arrival time. The early arrival of contrast agent is postulated to be related to arteriogenesis and direct tumor supply by branches of the hepatic artery. Tumor vascularity (fractional intravascular volume) was higher for two out of four patients. Portal venous flow decreased but remained significant. The derived microcirculatory parameters were supported by histopathological findings of arteriogenesis in HCC[15,31]. Together with other imaging modalities such as diffusion-weighted MRI, MR perfusion imaging has the potential to contribute significantly to the multi-parameteric functional assessment of the liver to improve the diagnosis and characterization of HCC[32].
Anti-angiogenic agents have emerged as a class of antitumor agents that target tumor vasculature. The rationale of anti-angiogenic therapy is based on the observation that tumors require new blood vessels for growth and survival. Based on the diffusion distances of oxygen and nutrients, tumor cells cannot survive if they are further than 2 mm from a blood vessel. Thus, effective anti-angiogenic therapy acts by depriving a growing tumor of its nutrients, and can thus curb the growth of the primary tumor as well as its metastasis.
However, current methods of assessing efficacy of chemotherapy, such as the Response Evaluation Criteria in Solid Tumors (RECIST), are based on observing a decrease in tumor size[33]. Effective anti-angiogenic therapy often manifests as lack of tumor growth rather than decrease in tumor size because the therapy is not cytotoxic. Hence, there is a need for a reliable response biomarker to assess the efficacy of such therapy.
The challenge for a reliable response biomarker holds true for HCC that is treated by local tumor ablation. Ablated tumor differs from viable tumor in its blood supply. Previous international consensus conferences have recommended that the RECIST criteria be modified for HCC to assess only the viable tumor[34-36]. Viable tumor is defined as tumor that shows enhancement in the arterial phase. Thus, MR perfusion imaging also has the potential to provide valuable functional information that can be used to distinguish viable tumor from necrosis in HCC[37].
Model-free approach: Wang et al[38] have analyzed the arterial uptake slope in MR liver perfusion studies of patients with HCC treated with thalidomide. They have found that there was a greater decrease in the peak enhancement, maximum enhancement, and slope of enhancement in patients without disease progression compared to those who progressed on treatment. Miyazaki et al[39] have applied HPI to assess the efficacy of anti-angiogenic therapy in patients with liver metastases and have found a median 15% decrease in HPI at 28 d after anti-angiogenic treatment in patients who responded to treatment. In another study, Meijerink et al[40] have evaluated liver HPI and have found that HPI decreased in liver tumor treated with combination anti-angiogenic therapy with AZD2171 and gefitinib. However, most of these studies involved relatively small numbers of patients, and more studies are therefore required to establish whether MR liver perfusion indices can serve as a reliable response biomarker for anti-angiogenic drug therapy.
Meijerink et al[41] also have evaluated HPI for assessing local recurrence in liver metastases treated with RFA. The authors have found that an increase in HPI parallels disease recurrence detection by 18fluorodeoxyglucose positron emission tomography.
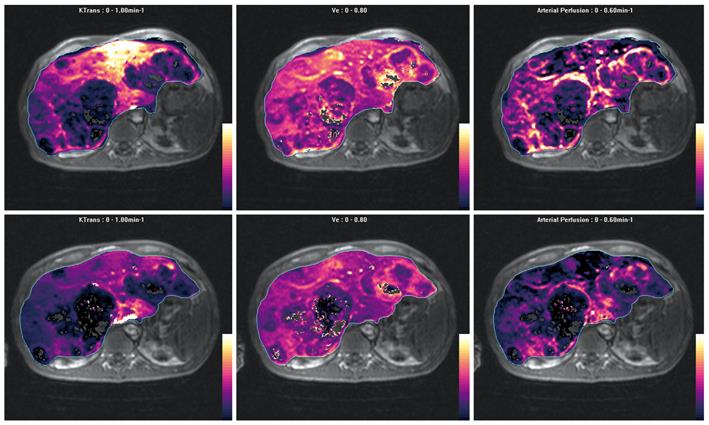
Model-based approach: There are few published studies that have applied a model-based approach for the evaluation of treatment response in hepatic malignancy. Chen et al[42] have studied the effects of transarterial chemo-embolization using a dual-input dual-compartment DP model and have found that the hepatic arterial fraction, hepatic arterial perfusion, and hepatic blood volume are significantly reduced by effective embolization. These indices could also help to indicate the presence of viable tumor. The potential of using model-based approaches for assessing the effects of anti-angiogenic or antivascular treatment is currently being investigated (Figure 9).
Model-free approach: Increase in hepatic arterial perfusion and decrease in portal venous perfusion have been reported in perfusion scintigraphy studies in patients with liver cirrhosis[43]. Miles et al[2] and Blomley et al[3] also have found an increase in HPI and decreased PPI respectively in cirrhotic liver.
Model-based approach: Guan et al[44] have applied a dual-input dual-compartment DP model in rats treated with diethylnitrosamine. As diethylnitrosamine induces a continuum of hepatitis, hepatic fibrosis and eventually cirrhosis, a gradual increase in hepatic arterial flow and MTT are observed across these groups, accompanied by a corresponding gradual decrease in blood volume and blood flow.
Koh et al[4] have utilized a dual-input dual-compartment DP model and have found that cirrhotic livers return a measurable fractional interstitial space, whereas normal liver shows a near-zero fractional interstitial space. In another study, Hashimoto et al[5] have applied a dual-input dual-compartment DP model and have found that the hepatic arterial fraction increases with the extent of fibrosis and cirrhosis.
The use of a single-compartment kinetic model has also been found to be useful for the assessment of liver cirrhosis.
Annet et al[6] have investigated a dual-input single-compartment CC model and have found that the microcirculatory parameters derived from such a technique correlate with the severity of cirrhosis and portal pressure. The measured portal pressure, a reflection of the degree of portal hypertension, is correlated with the calculated portal fraction, portal perfusion and MTT. Furthermore, the severity of cirrhosis as assessed by Child-Pugh class has been found to correlate with portal fraction, portal perfusion, arterial perfusion and MTT. Cirrhotic livers have shown an increase in arterial perfusion, decrease in portal perfusion, decrease in total blood flow, and an increase in MTT.
These findings can be corroborated with other published studies. In an earlier study by Van Beers et al[7], a cutoff threshold of 22.6 s for the MTT in the liver enabled the diagnosis of liver cirrhosis to be made with a sensitivity and specificity of 81%. In another study, Hagiwara et al[8] have used a dual-input single-compartment CC model and have found that there was an increase in the arterial blood flow, arterial fraction, distribution volume, and MTT in patients with advanced hepatic fibrosis. Receiver operating curve analysis has shown that the MTT, distribution volume and arterial flow are good predictive parameters with an area under the receiver operating characteristic curves that ranges from 0.791 to 0.824, and reported sensitivity of 76.9%-84.6% and specificity of 71.4%-78.5%. Thus, MR liver perfusion appears to be a promising method for the non-invasive diagnosis of liver cirrhosis and for assessing the severity of the condition.
MR liver perfusion imaging provides functional information about the microcirculation of liver parenchyma and focal liver lesions and appears to be a promising technique for evaluating liver metastases and HCC; for assessing the efficacy of anti-angiogenic or local tumor ablation therapy; and for diagnosing cirrhosis and assessing its severity. However, standardization of imaging acquisition and analysis techniques need to be actively addressed for the technique to be widely adopted.
Peer reviewer: Paul E Sijens, PhD, Associate Professor, Radiology, UMCG, Hanzeplein 1, 9713GZ Groningen, The Netherlands
S- Editor Tian L L- Editor Kerr C E- Editor Ma WH
| 1. | Leggett DA, Kelley BB, Bunce IH, Miles KA. Colorectal cancer: diagnostic potential of CT measurements of hepatic perfusion and implications for contrast enhancement protocols. Radiology. 1997;205:716-720. [Cited in This Article: ] |
| 2. | Miles KA, Hayball MP, Dixon AK. Functional images of hepatic perfusion obtained with dynamic CT. Radiology. 1993;188:405-411. [Cited in This Article: ] |
| 3. | Blomley MJ, Coulden R, Dawson P, Kormano M, Donlan P, Bufkin C, Lipton MJ. Liver perfusion studied with ultrafast CT. J Comput Assist Tomogr. 1995;19:424-433. [Cited in This Article: ] |
| 4. | Koh TS, Thng CH, Hartono S, Lee PS, Choo SP, Poon DY, Toh HC, Bisdas S. Dynamic contrast-enhanced CT imaging of hepatocellular carcinoma in cirrhosis: feasibility of a prolonged dual-phase imaging protocol with tracer kinetics modeling. Eur Radiol. 2009;19:1184-1196. [Cited in This Article: ] |
| 5. | Hashimoto K, Murakami T, Dono K, Hori M, Kim T, Kudo M, Marubashi S, Miyamoto A, Takeda Y, Nagano H. Assessment of the severity of liver disease and fibrotic change: the usefulness of hepatic CT perfusion imaging. Oncol Rep. 2006;16:677-683. [Cited in This Article: ] |
| 6. | Annet L, Materne R, Danse E, Jamart J, Horsmans Y, Van Beers BE. Hepatic flow parameters measured with MR imaging and Doppler US: correlations with degree of cirrhosis and portal hypertension. Radiology. 2003;229:409-414. [Cited in This Article: ] |
| 7. | Van Beers BE, Leconte I, Materne R, Smith AM, Jamart J, Horsmans Y. Hepatic perfusion parameters in chronic liver disease: dynamic CT measurements correlated with disease severity. AJR Am J Roentgenol. 2001;176:667-673. [Cited in This Article: ] |
| 8. | Hagiwara M, Rusinek H, Lee VS, Losada M, Bannan MA, Krinsky GA, Taouli B. Advanced liver fibrosis: diagnosis with 3D whole-liver perfusion MR imaging--initial experience. Radiology. 2008;246:926-934. [Cited in This Article: ] |
| 9. | Chiandussi L, Greco F, Sardi G, Vaccarino A, Ferraris CM, Curti B. Estimation of hepatic arterial and portal venous blood flow by direct catheterization of the vena porta through the umbilical cord in man. Preliminary results. Acta Hepatosplenol. 1968;15:166-171. [Cited in This Article: ] |
| 10. | Pandharipande PV, Krinsky GA, Rusinek H, Lee VS. Perfusion imaging of the liver: current challenges and future goals. Radiology. 2005;234:661-673. [Cited in This Article: ] |
| 11. | Villeneuve JP, Dagenais M, Huet PM, Roy A, Lapointe R, Marleau D. The hepatic microcirculation in the isolated perfused human liver. Hepatology. 1996;23:24-31. [Cited in This Article: ] |
| 12. | Liu Y, Matsui O. Changes of intratumoral microvessels and blood perfusion during establishment of hepatic metastases in mice. Radiology. 2007;243:386-395. [Cited in This Article: ] |
| 13. | Terayama N, Terada T, Nakanuma Y. An immunohistochemical study of tumour vessels in metastatic liver cancers and the surrounding liver tissue. Histopathology. 1996;29:37-43. [Cited in This Article: ] |
| 14. | Nakanuma Y, Terada T, Terasaki S, Ueda K, Nonomura A, Kawahara E, Matsui O. ‘Atypical adenomatous hyperplasia’ in liver cirrhosis: low-grade hepatocellular carcinoma or borderline lesion? Histopathology. 1990;17:27-35. [Cited in This Article: ] |
| 15. | Hayashi M, Matsui O, Ueda K, Kawamori Y, Gabata T, Kadoya M. Progression to hypervascular hepatocellular carcinoma: correlation with intranodular blood supply evaluated with CT during intraarterial injection of contrast material. Radiology. 2002;225:143-149. [Cited in This Article: ] |
| 16. | Wang HZ, Riederer SJ, Lee JN. Optimizing the precision in T1 relaxation estimation using limited flip angles. Magn Reson Med. 1987;5:399-416. [Cited in This Article: ] |
| 17. | Orton MR, Miyazaki K, Koh DM, Collins DJ, Hawkes DJ, Atkinson D, Leach MO. Optimizing functional parameter accuracy for breath-hold DCE-MRI of liver tumours. Phys Med Biol. 2009;54:2197-2215. [Cited in This Article: ] |
| 18. | Jackson A, Haroon H, Zhu XP, Li KL, Thacker NA, Jayson G. Breath-hold perfusion and permeability mapping of hepatic malignancies using magnetic resonance imaging and a first-pass leakage profile model. NMR Biomed. 2002;15:164-173. [Cited in This Article: ] |
| 19. | Tsushima Y, Blomley MJ, Kusano S, Endo K. Measuring portal venous perfusion with contrast-enhanced CT: comparison of direct and indirect methods. Acad Radiol. 2002;9:276-282. [Cited in This Article: ] |
| 20. | Koh TS, Thng CH, Lee PS, Hartono S, Rumpel H, Goh BC, Bisdas S. Hepatic metastases: in vivo assessment of perfusion parameters at dynamic contrast-enhanced MR imaging with dual-input two-compartment tracer kinetics model. Radiology. 2008;249:307-320. [Cited in This Article: ] |
| 21. | Tofts PS, Brix G, Buckley DL, Evelhoch JL, Henderson E, Knopp MV, Larsson HB, Lee TY, Mayr NA, Parker GJ. Estimating kinetic parameters from dynamic contrast-enhanced T(1)-weighted MRI of a diffusable tracer: standardized quantities and symbols. J Magn Reson Imaging. 1999;10:223-232. [Cited in This Article: ] |
| 22. | Totman JJ, O’gorman RL, Kane PA, Karani JB. Comparison of the hepatic perfusion index measured with gadolinium-enhanced volumetric MRI in controls and in patients with colorectal cancer. Br J Radiol. 2005;78:105-109. [Cited in This Article: ] |
| 23. | Tsushima Y, Blomley MJ, Yokoyama H, Kusano S, Endo K. Does the presence of distant and local malignancy alter parenchymal perfusion in apparently disease-free areas of the liver? Dig Dis Sci. 2001;46:2113-2119. [Cited in This Article: ] |
| 24. | Warren HW, Gallagher H, Hemingway DM, Angerson WJ, Bessent RG, Wotherspoon H, McArdle CS, Cooke TG. Prospective assessment of the hepatic perfusion index in patients with colorectal cancer. Br J Surg. 1998;85:1708-1712. [Cited in This Article: ] |
| 25. | Ballantyne KC, Charnley RM, Perkins AC, Pye G, Whalley DR, Wastie ML, Hardcastle JD. Hepatic perfusion index in the diagnosis of overt metastatic colorectal cancer. Nucl Med Commun. 1990;11:23-28. [Cited in This Article: ] |
| 26. | Meijerink MR, van Waesberghe JH, van der Weide L, van den Tol P, Meijer S, van Kuijk C. Total-liver-volume perfusion CT using 3-D image fusion to improve detection and characterization of liver metastases. Eur Radiol. 2008;18:2345-2354. [Cited in This Article: ] |
| 27. | Cuenod C, Leconte I, Siauve N, Resten A, Dromain C, Poulet B, Frouin F, Clément O, Frija G. Early changes in liver perfusion caused by occult metastases in rats: detection with quantitative CT. Radiology. 2001;218:556-561. [Cited in This Article: ] |
| 28. | Abdullah SS, Pialat JB, Wiart M, Duboeuf F, Mabrut JY, Bancel B, Rode A, Ducerf C, Baulieux J, Berthezene Y. Characterization of hepatocellular carcinoma and colorectal liver metastasis by means of perfusion MRI. J Magn Reson Imaging. 2008;28:390-395. [Cited in This Article: ] |
| 29. | Fournier LS, Cuenod CA, de Bazelaire C, Siauve N, Rosty C, Tran PL, Frija G, Clement O. Early modifications of hepatic perfusion measured by functional CT in a rat model of hepatocellular carcinoma using a blood pool contrast agent. Eur Radiol. 2004;14:2125-2133. [Cited in This Article: ] |
| 30. | Sahani DV, Holalkere NS, Mueller PR, Zhu AX. Advanced hepatocellular carcinoma: CT perfusion of liver and tumor tissue--initial experience. Radiology. 2007;243:736-743. [Cited in This Article: ] |
| 31. | Matsui O, Kadoya M, Kameyama T, Yoshikawa J, Takashima T, Nakanuma Y, Unoura M, Kobayashi K, Izumi R, Ida M. Benign and malignant nodules in cirrhotic livers: distinction based on blood supply. Radiology. 1991;178:493-497. [Cited in This Article: ] |
| 32. | Sijens PE. Parametric exploration of the liver by magnetic resonance methods. Eur Radiol. 2009;19:2594-2607. [Cited in This Article: ] |
| 33. | Eisenhauer EA, Therasse P, Bogaerts J, Schwartz LH, Sargent D, Ford R, Dancey J, Arbuck S, Gwyther S, Mooney M. New response evaluation criteria in solid tumours: revised RECIST guideline (version 1.1). Eur J Cancer. 2009;45:228-247. [Cited in This Article: ] |
| 34. | Llovet JM, Di Bisceglie AM, Bruix J, Kramer BS, Lencioni R, Zhu AX, Sherman M, Schwartz M, Lotze M, Talwalkar J. Design and endpoints of clinical trials in hepatocellular carcinoma. J Natl Cancer Inst. 2008;100:698-711. [Cited in This Article: ] |
| 35. | Bruix J, Sherman M. Management of hepatocellular carcinoma. Hepatology. 2005;42:1208-1236. [Cited in This Article: ] |
| 36. | Bruix J, Sherman M, Llovet JM, Beaugrand M, Lencioni R, Burroughs AK, Christensen E, Pagliaro L, Colombo M, Rodés J. Clinical management of hepatocellular carcinoma. Conclusions of the Barcelona-2000 EASL conference. European Association for the Study of the Liver. J Hepatol. 2001;35:421-430. [Cited in This Article: ] |
| 37. | Prokop M. CT and MR to assess the response of liver tumors to hepatic perfusion. Recent Results Cancer Res. 1998;147:136-154. [Cited in This Article: ] |
| 38. | Wang J, Chen LT, Tsang YM, Liu TW, Shih TT. Dynamic contrast-enhanced MRI analysis of perfusion changes in advanced hepatocellular carcinoma treated with an antiangiogenic agent: a preliminary study. AJR Am J Roentgenol. 2004;183:713-719. [Cited in This Article: ] |
| 39. | Miyazaki K, Collins DJ, Walker-Samuel S, Taylor JN, Padhani AR, Leach MO, Koh DM. Quantitative mapping of hepatic perfusion index using MR imaging: a potential reproducible tool for assessing tumour response to treatment with the antiangiogenic compound BIBF 1120, a potent triple angiokinase inhibitor. Eur Radiol. 2008;18:1414-1421. [Cited in This Article: ] |
| 40. | Meijerink MR, van Cruijsen H, Hoekman K, Kater M, van Schaik C, van Waesberghe JH, Giaccone G, Manoliu RA. The use of perfusion CT for the evaluation of therapy combining AZD2171 with gefitinib in cancer patients. Eur Radiol. 2007;17:1700-1713. [Cited in This Article: ] |
| 41. | Meijerink MR, van Waesberghe JH, van der Weide L, van den Tol P, Meijer S, Comans EF, Golding RP, van Kuijk C. Early detection of local RFA site recurrence using total liver volume perfusion CT initial experience. Acad Radiol. 2009;16:1215-1222. [Cited in This Article: ] |
| 42. | Chen G, Ma DQ, He W, Zhang BF, Zhao LQ. Computed tomography perfusion in evaluating the therapeutic effect of transarterial chemoembolization for hepatocellular carcinoma. World J Gastroenterol. 2008;14:5738-5743. [Cited in This Article: ] |
| 43. | Bolton RP, Mairiang EO, Parkin A, Ware F, Robinson P, Losowsky MS. Dynamic liver scanning in cirrhosis. Nucl Med Commun. 1988;9:235-247. [Cited in This Article: ] |
| 44. | Guan S, Zhao WD, Zhou KR, Peng WJ, Mao J, Tang F. CT perfusion at early stage of hepatic diffuse disease. World J Gastroenterol. 2005;11:3465-3467. [Cited in This Article: ] |
| 45. | Materne R, Annet L, Dechambre S, Sempoux C, Smith AM, Corot C, Horsmans Y, Van Beers BE. Dynamic computed tomography with low- and high-molecular-mass contrast agents to assess microvascular permeability modifications in a model of liver fibrosis. Clin Sci (Lond). 2002;103:213-216. [Cited in This Article: ] |
| 46. | Materne R, Van Beers BE, Smith AM, Leconte I, Jamart J, Dehoux JP, Keyeux A, Horsmans Y. Non-invasive quantification of liver perfusion with dynamic computed tomography and a dual-input one-compartmental model. Clin Sci (Lond). 2000;99:517-525. [Cited in This Article: ] |
| 47. | Materne R, Smith AM, Peeters F, Dehoux JP, Keyeux A, Horsmans Y, Van Beers BE. Assessment of hepatic perfusion parameters with dynamic MRI. Magn Reson Med. 2002;47:135-142. [Cited in This Article: ] |
| 48. | Scharf J, Zapletal C, Hess T, Hoffmann U, Mehrabi A, Mihm D, Hoffmann V, Brix G, Kraus T, Richter GM. Assessment of hepatic perfusion in pigs by pharmacokinetic analysis of dynamic MR images. J Magn Reson Imaging. 1999;9:568-572. [Cited in This Article: ] |
| 49. | Cuenod CA, Leconte I, Siauve N, Frouin F, Dromain C, Clément O, Frija G. Deconvolution technique for measuring tissue perfusion by dynamic CT: application to normal and metastatic liver. Acad Radiol. 2002;9 Suppl 1:S205-S211. [Cited in This Article: ] |
| 50. | Funabasama S, Tsushima Y, Sanada S, Inoue K. [Hepatic perfusion CT imaging analyzed by the dual-input one-compartment model]. Nippon Hoshasen Gijutsu Gakkai Zasshi. 2003;59:1548-1554. [Cited in This Article: ] |
| 51. | Miyazaki S, Murase K, Yoshikawa T, Morimoto S, Ohno Y, Sugimura K. A quantitative method for estimating hepatic blood flow using a dual-input single-compartment model. Br J Radiol. 2008;81:790-800. [Cited in This Article: ] |
| 52. | Lee TY, Purdie TG, Stewart E. CT imaging of angiogenesis. Q J Nucl Med. 2003;47:171-187. [Cited in This Article: ] |
| 53. | St Lawrence KS, Lee TY. An adiabatic approximation to the tissue homogeneity model for water exchange in the brain: I. Theoretical derivation. J Cereb Blood Flow Metab. 1998;18:1365-1377. [Cited in This Article: ] |


