Article

Reliability of Synthetic Brain MRI for Assessment of Ischemic Stroke with Phantom Validation of a Relaxation Time Determination Method

1
Department of Radiology, Wan Fang Hospital, Taipei Medical University, Taipei 116, Taiwan
2
Department of Radiology, School of Medicine, College of Medicine, Taipei Medical University, Taipei 110, Taiwan
3
GE Healthcare, Taipei 104, Taiwan
4
Medical Innovation Development Center, Wan Fang Hospital, Taipei Medical University, Taipei 116, Taiwan
*
Author to whom correspondence should be addressed.
These authors contributed equally to this work.
J. Clin. Med. 2020, 9(6), 1857; https://doi.org/10.3390/jcm9061857
Submission received: 10 May 2020 / Revised: 8 June 2020 / Accepted: 10 June 2020 / Published: 14 June 2020
(This article belongs to the Section Clinical Neurology)

Abstract

:
The reliability of relaxation time measures in synthetic magnetic resonance images (MRIs) of homemade phantoms were validated, and the diagnostic suitability of synthetic imaging was compared to that of conventional MRIs for detecting ischemic lesions. Phantoms filled with aqueous cupric-sulfate (CuSO4) were designed to mimic spin-lattice (T1) and spin-spin (T2) relaxation properties and were used to compare their accuracies and stabilities between synthetic and conventional scans of various brain tissues. To validate the accuracy of synthetic imaging in ischemic stroke diagnoses, the synthetic and clinical scans of 18 patients with ischemic stroke were compared, and the quantitative contrast-to-noise ratios (CNRs) were measured, using the Friedman test to determine significance in differences. Results using the phantoms showed no significant differences in the interday and intersession synthetic quantitative T1 and T2 values. However, between synthetic and referenced T1 and T2 values, differences were larger for longer relaxation times, showing that image intensities in synthetic scans are relatively inaccurate in the cerebrospinal fluid (CSF). Similarly, CNRs in CSF regions of stroke patients were significantly different on synthetic T2-weighted and T2-fluid-attenuated inversion recovery images. In contrast, differences in stroke lesions were insignificant between the two. Therefore, interday and intersession synthetic T1 and T2 values are highly reliable, and discrepancies in synthetic T1 and T2 relaxation times and image contrasts in CSF regions do not affect stroke lesion diagnoses. Additionally, quantitative relaxation times from synthetic images allow better estimations of ischemic stroke onset time, consequently increasing confidence in synthetic MRIs as diagnostic tools for ischemic stroke.

1. Introduction

In synthetic magnetic resonance images (MRIs), multiple sets of sequence properties are used to obtain quantitative values for proton density, longitudinal relaxation time (T1), and transverse relaxation time (T2) at each imaging voxel. By adjusting the imaging parameters repetition time (TR), echo time (TE), and inversion time (TI), a technologist can mathematically produce multiple image contrast weightings from a single synthetic scan [1,2,3] once the quantitative values for T1, T2, and proton density are generated. Synthetic MRI technology using a two-dimensional fast spin-echo (SE) multi-dynamic, multi-echo sequence was recently approved by the US Food and Drug Administration and has also been used in clinical brain studies [4]. Synthetic MRIs allow completion of diagnostic brain examinations in about 4 to 7 min using a single scan. The shorter scan time is beneficial to stroke patients because it increases the diagnostic procedure’s efficiency and comfort. Synthetic MRIs also provide a distinct tissue relaxation time [5,6,7], enabling a more accurate estimation of ischemic stroke status [8,9]. Because establishing an optimum relaxation time is a prerequisite for generating a synthetic image, achieving favorable synthetic image contrast depends on the accuracy of that value.
This study was conducted to validate the reliabilities of T1 and T2 relaxation times obtained from synthetic MRIs, and to investigate the achievability of sufficient contrast between stroke lesions and normal brain tissues using synthetic MRIs.

2. Materials and Methods

Imaging was performed using a 3T clinical scanner (MR750w; GE Healthcare, Milwaukee, WI, USA) with a body coil as the transmitter and a 24-channel array head coil as the receiver. The research protocol was approved by the X Medical University Joint Institutional Review Board (No. N201706024). All participants gave written informed consent.

2.1. Synthetic MRI Technique

Synthetic scans were obtained using MRI compilation (MAGiC) software and one multi-dynamic multi-echo sequence with the following parameters: repetition time (TR), 4123 ms; TE, 21.4 and 96.3 ms; and echo-train length, 14 echoes. Shared parameters across all scans were: matrix size, 256 × 256; slice thickness, 5 mm; slice gap, 1 mm; frequency, 20 slices per scan; and field of view, 160 × 160 mm for phantom scans and 192 × 192 mm for brain scans. Scan time was about 4 min.

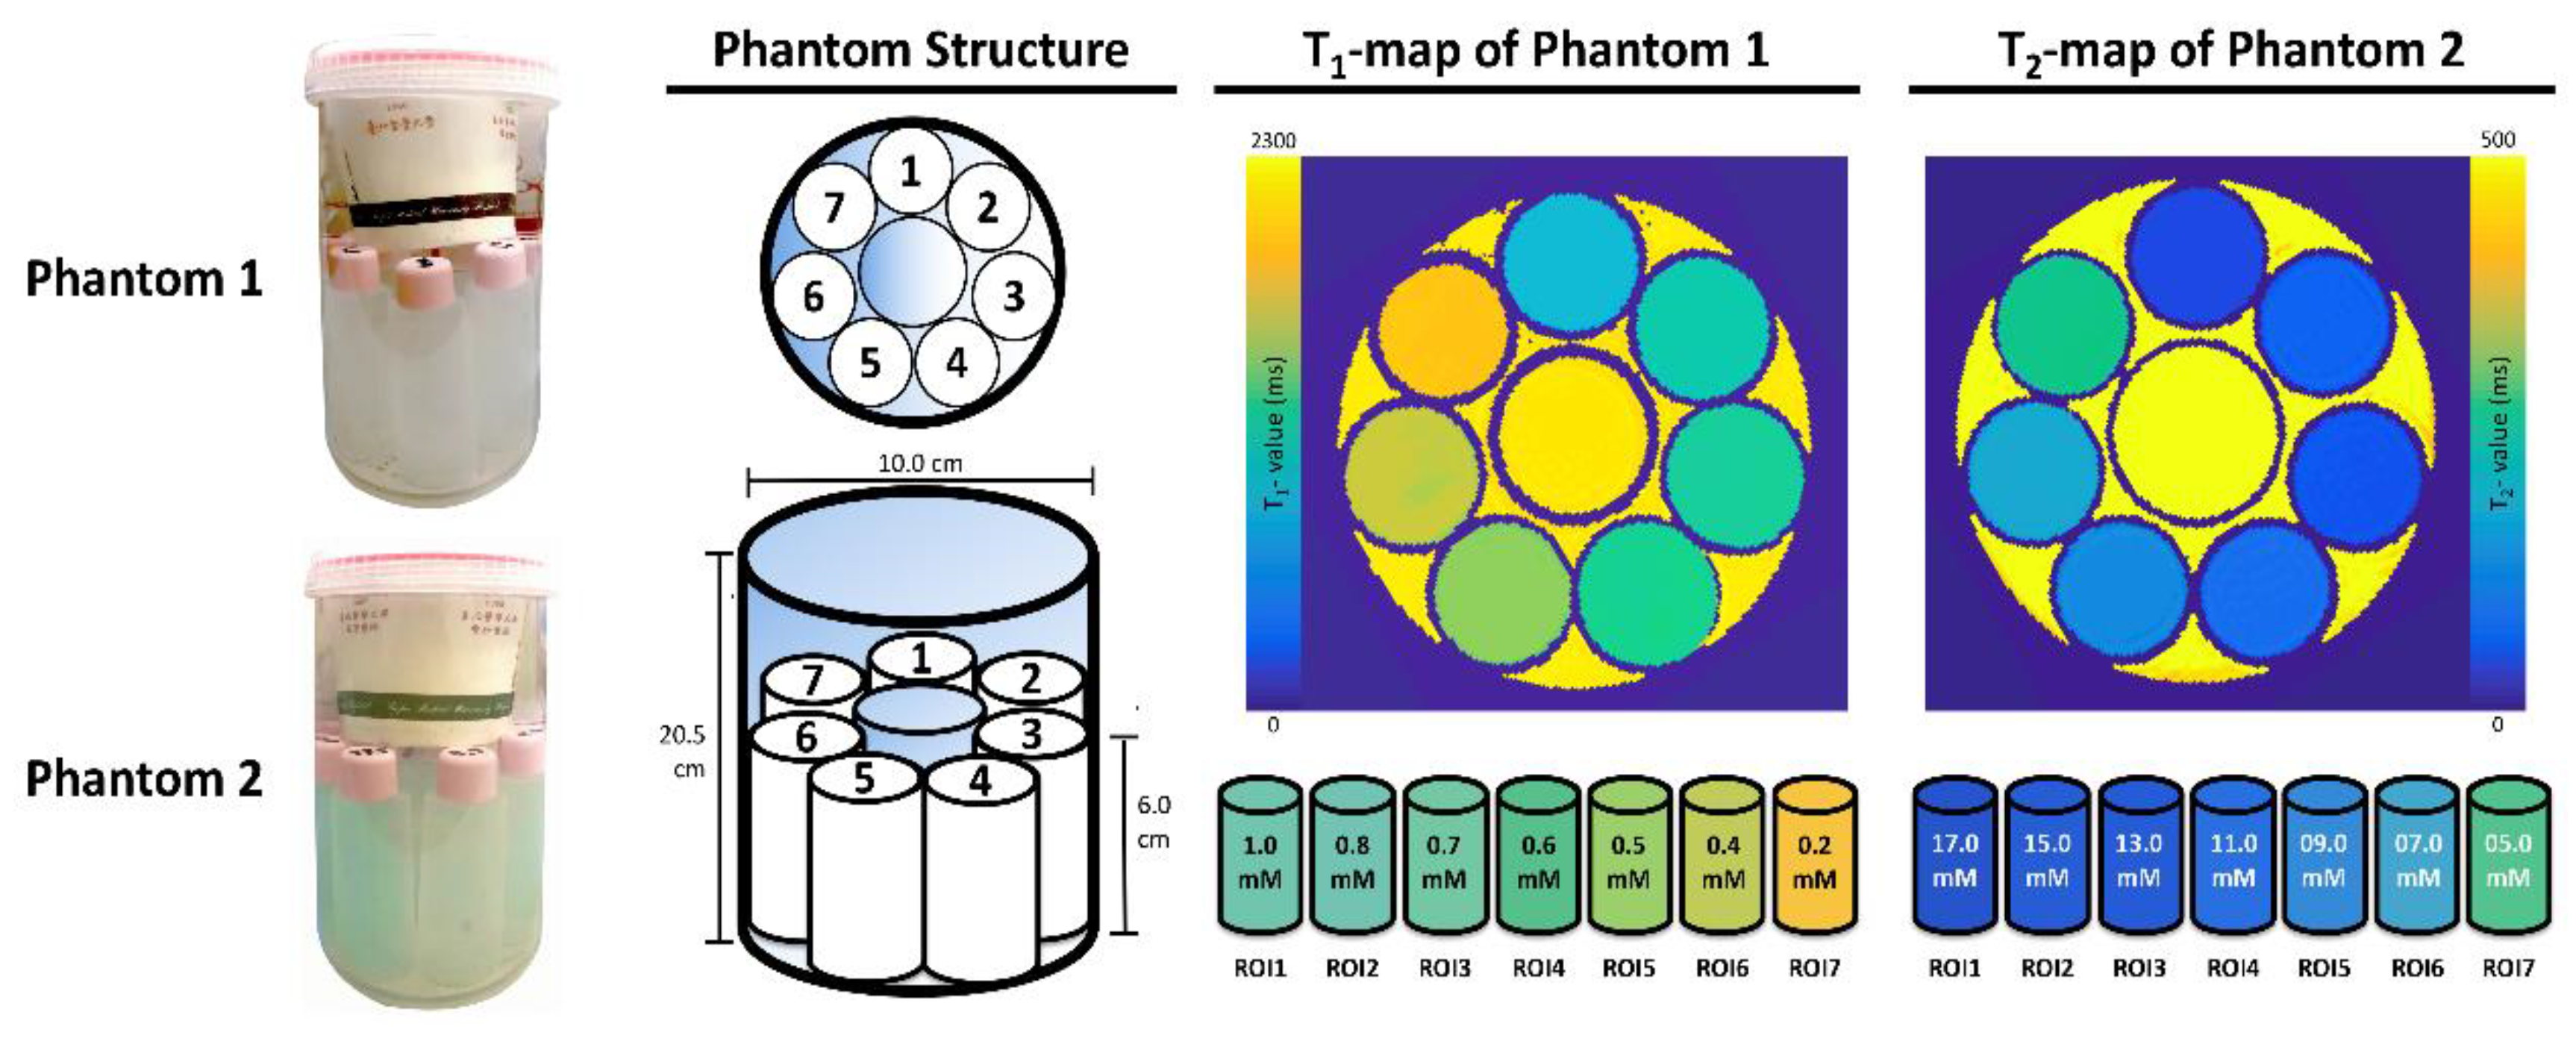
2.2. Specifically Designed Phantoms

This study was conducted to validate the reliabilities of T1 and T2 relaxation times from synthetic MRIs of phantoms containing sealed tubes filled with specific concentrations of aqueous CuSO4 (anhydrous copper sulfate; 97.5% purity; Nacalai Tesque, Kyoto, Japan) and fixed in a plastic tank (Figure 1). Two phantoms were designed specifically to give T1 and T2 values between about 1100 and 2300 ms and 50 and 240 ms, respectively [10], mimicking the primary components of the brain: white matter (WM), gray matter (GM), and cerebrospinal fluid (CSF) [11,12,13,14].

2.3. Phantom Evaluation

The reference T1 value was quantified using a conventional SE with an inversion recovery sequence having the following parameters: TR, 10,000 ms; TE, 8.9 ms; and a TI series (100, 300, 500, 700, 800, 900, 1000, 1100, 1200, 1300, 1400, 1500, 1800, 2400, 3000, and 4000 ms). The reference T2 value was quantified using a multi-echo fast-SE sequence with the following parameters: TR, 10,000 ms, and a TE series (9.9, 19.9, 29.8, 39.7, 49.6, 59.6, 69.5, 79.4, 89.4, 99.3, 109.2, 119.2, 129, 139, 149, 158.8, 168.7, 178.6, 188.5, and 198.4 ms). Both values from all scans were calculated using an in-house MATLAB script for nonlinear least-squares curve fitting (MathWorks, Natick, MA, USA) [15]. Interday reproducibility was assessed using the imaging coverage applied in conventional scans. Data were acquired from both phantoms on two days, one week apart, performing seven repetitions at 30-min intervals, and all synthetic data were used to assess intersession repeatability. The percent difference between the synthetic and conventional values was calculated as:
Difference = ((Tsynthetic scan − Treference)/Treference) × 100%.
The differences obtained using the concentrations of aqueous CuSO4 in those two specific phantoms were calculated for quantitative validation.

2.4. Participant and Diagnostic Score Evaluation

Twenty patients with chronic stroke (>6 months), free of known neurologic and psychiatric diagnoses, were enrolled between 20 August 2017, and 28 December 2017, to explore the image contrasts in synthetic scans and to quantitatively compare synthetic and clinical images. Two were removed from the analysis due to excessive head movement. The mean (standard deviation, SD) of the resulting sample of 18 patients (14 men) was 59.6 (6.4) years.
Standardized stroke MRIs and synthetic scans were evaluated using double-blind testing. Two radiologists rated image quality on an 11-point scale (0, entirely poor to 10, entirely good) and answered one question: “Are these images acceptable for diagnostic use? (yes or no).” The display order of the patient images was randomly generated by MATLAB.
Images were prospectively acquired using a fixed set of parameters closely approximating a standardized stroke MRI protocol [16]. Images of clinical stroke were acquired first; then synthetic scans were obtained, including fast-SE with inversion-recovery axial plane T1-weighted imaging (TR, 1800 ms; TE, 23 ms; TI, 750 ms), fast-SE coronal plane T2-weighted imaging (TR, 4545 ms; TE, 110 ms), and T2-fluid-attenuated inversion recovery (FLAIR) imaging (TR, 9000 ms; TE, 92 ms; TI, 2472 ms). One echo-planar-imaging-based diffusion-weighted image (TR, 6000 ms; TE, 77 ms) was also acquired, using 1000 s/mm² for the b-value, and one experienced radiologist located the ischemic lesion in each patient (Table 1).
Preprocessing, analysis, and spatial segmentation were applied to all datasets, and mean image intensities for WM, GM, and CSF were extracted. The ICBM-152 [17,18] and Anatomical Automatic Labeling templates [19,20] were normalized into individual images of each patient, and the mean signal intensity of the bilateral thalamus was extracted for image contrast standardization (Figure 2). The standardized image contrast-to-noise ratio (CNR) was calculated as:
CNR = (mean intensity of WM/GM/CSF/stroke lesion - mean intensity of thalamus)/standard deviation of thalamus.

2.5. Statistical Analyses

Statistical analyses were performed using the R software program with t test functionality, version 3.5.1 (R Core Team 2018. R: A language and environment for statistical computing. R Foundation for Statistical Computing, Vienna, Austria. URL http://www.R-project.org/). The Friedman test was used to measure interday and intersession repeatabilities and the image contrast between clinical and synthetic images, allowing quantitative validation of phantom and patient data. A difference was considered statistically significant when the Bonferroni-corrected p-value was <0.05.

3. Results

Patient demographic data and the clinical locations of the stroke lesions are shown in Table 1.

3.1. Phantom Evaluation

Table 2 shows the interday and intersession quantitative T1 and T2 values across all applicable concentrations of aqueous CuSO4, acquired using synthetic scanning. The Friedman test showed no significant differences between the interday and intersession values. The reference T1 and T2 values were obtained using conventional SE methods. Differences in T1 and T2 between the synthetic and conventional scans are shown in Figure 3. Synthetic T1 values were closer to the reference values when CuSO4 concentrations were higher (at 0.7 to 1.0 mmol/L, the difference was 5–8%, whereas at <0.2 mmol/L, the difference was >20%). A similar trend was seen for synthetic T2 values (at 11.0 to 20.0 mmol/L, the difference was <10%, whereas at 7.0 to 9.0 mmol/L, the difference was >20%).

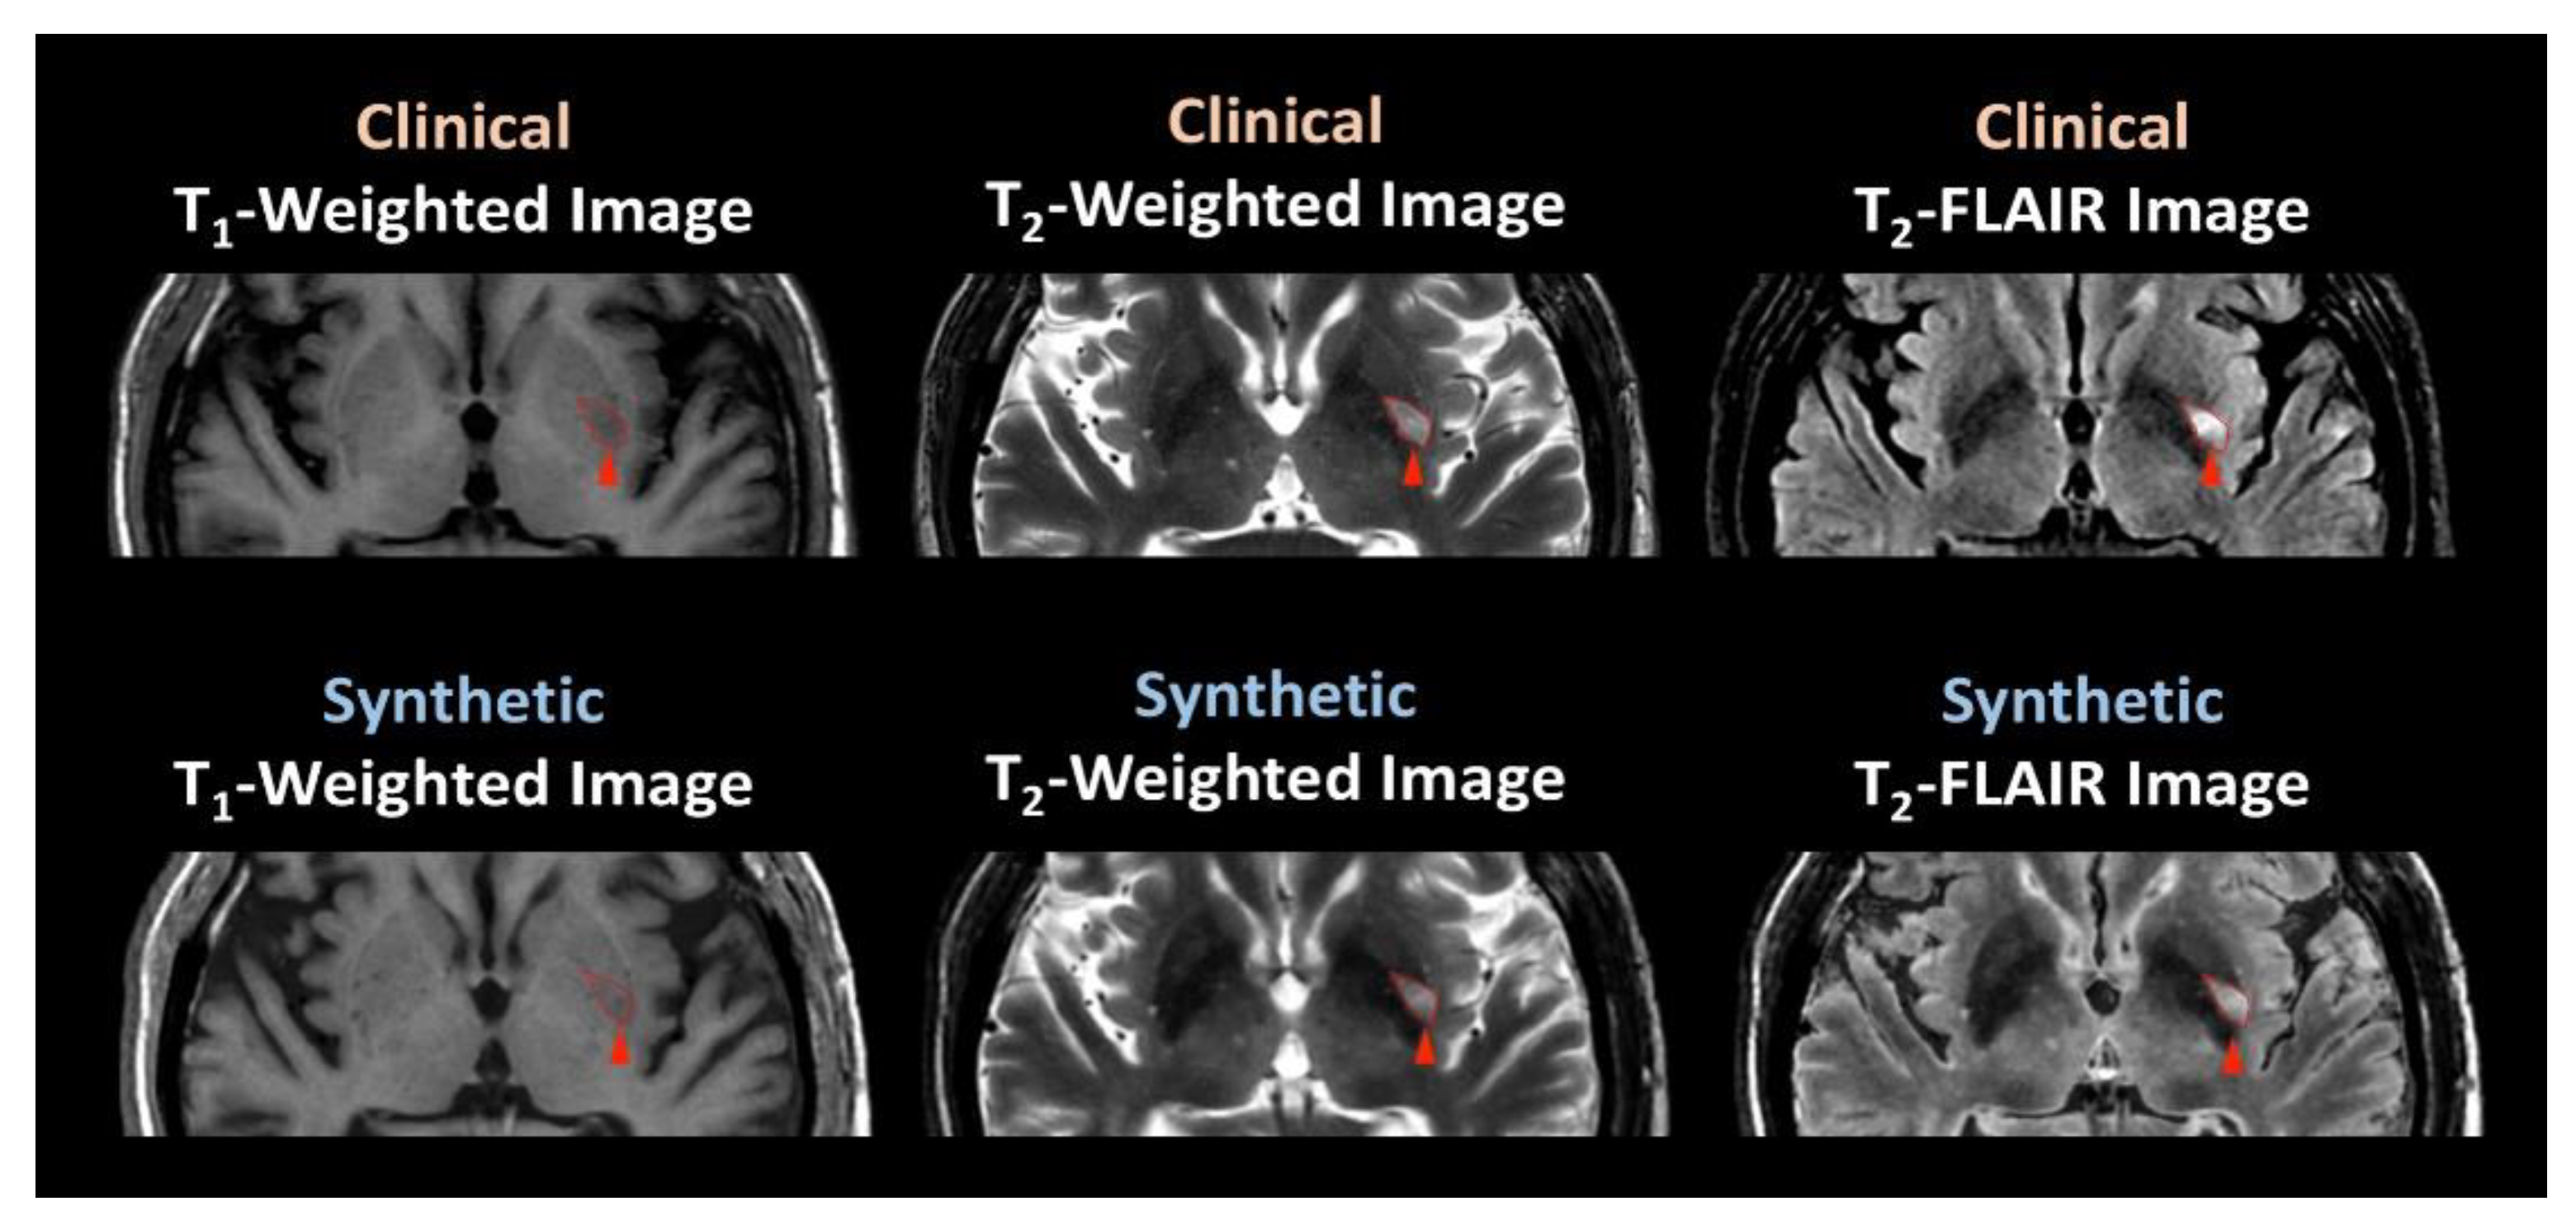
3.2. Participant Evaluation

Table 3 shows the subjective ratings by two radiologists of the quality of the synthetic and clinical images and the suitability of synthetic images for stroke diagnosis. The clinical and synthetic images were identically rated for diagnostic suitability. However, the image quality rating, which exceeded 8 for synthetic T1- and T2-weighted scans and exceeded 7.8 for T2-FLAIR synthetic scans, was significantly greater for the corresponding clinical scans (Bonferroni-corrected p = 0.05). Figure 4 shows representative clinical and synthetic scans of a stroke patient, demonstrating that the contrasts are similar. Instead of visually evaluating the image contrast, the CNR was determined in WM, GM, CSF, and stroke lesions (Figure 5). Differences were not significant in any of the WM and GM regions (see Figure 5) but were significant in the CSF regions on T2-weighted and T2-FLAIR images (Bonferroni-corrected p = 0.05, multiple-comparison correction). In the lesion regions, CNRs were not significantly different between images reconstructed from synthetic scans and those acquired using clinical scanning methods.

4. Discussion

In this study, significant differences in T1 and T2 values across the 14 synthetic scans of the two phantoms were not found; therefore, the reliability of acquiring synthetic quantitative T1 and T2 values is high. The relaxation times varied across brain tissues, but smaller differences were found between the synthetic and reference values when they ranged from about 1131 to 1456 ms for T1 and from about 59 to 94 ms for T2. Differences were apparent in the CSF when T1 and T2 were greater than 1456 ms and 94 ms, respectively. As seen with the phantoms, differences were large when relaxation times were in the range for CSF regions, confirming that results in CSF regions account for the differences found. Significant differences were not found between synthetic and clinical T2-FLAIR images of stroke lesions, showing that disparities in signal intensity from the various CSF regions did not affect the diagnosis of chronic stroke lesion, most commonly located in WM and GM. The ratings by two radiologists for diagnostic suitability concur with this result.
The literature demonstrates that the quantitative T2 values of stoke lesions are significantly correlated with time since symptom onset [9]. Quantitative T2 values are significantly higher for ischemic lesions than for healthy tissue, and using T2 values to predict time since symptom onset is more accurate than using FLAIR images. One animal study [8] showed that quantitative values for T1 and T2 increased linearly with ischemia duration; in addition, a more accurate estimation of stroke duration was achieved using a pixel-by-pixel analysis to quantify relaxation times at a single point in time than by using signal intensity. Moreover, quantitative relaxation times provide additional information about tissue status in ischemia. Uncertainties in onset time estimates using quantitative T1 and T2 values vary from about 25 to 47 min in the first 5 h of ischemic stroke [21]. Therefore, in clinical images, estimating the onset time and identifying ischemic tissue are more accurate using quantitative relaxation times rather than signal intensities; they are free from operator bias, thereby increasing the reproducibility of time since symptom onset. However, they might not have a clinical application in diagnosing ischemic stroke because dozens of minutes are always required to quantify relaxation times using traditional clinical scanning methods. The synthetic technique uses the multi-dynamic, multi-echo sequence with four fixed inversion times and two echo times to simultaneously acquire quantitative values (including T1, T2, and proton density) within a couple minutes. This efficiency allows quantitative relaxation times to be used for ischemia diagnoses.
Our results show no significant differences in stroke lesion regions between images reconstructed from synthetic T2-FLAIR scans and those acquired using clinical scans. However, the image quality ratings of the synthetic T2-FLAIR scans were significantly lower than those for the corresponding clinical scans due to several artifacts in the former. These included granular hyperintensity signals occasionally appearing in the margins and flow artifacts [4,6], resulting from partial volume effects and flow effects not considered in the analytical signal model when estimating image parameters. Artifacts in synthetic T2-FLAIR scans resulted in lower image quality but showed little interference in diagnosing chronic stroke. Significant differences were also found between the synthetic and clinical T2-FLAIR images in the CSF regions; two radiologists found that the synthetic images were of lower quality, agreeing with the findings of others [4]. Two recent studies used deep learning algorithms to solve this problem. Hagiwara et al. attempted to improve the accuracy in brain CSF regions by using conditional generative adversarial network training to perform pixel-by-pixel translation methods, thus generating FLAIR images with contrasts closer to those of conventional FLAIR images [22]. The corrected synthetic FLAIR images provided Dice scores and image qualities that were closer to or more comparable with those found in conventional FLAIR images, and they showed fewer granular and swelling artifacts. Ryu et al. used 56 FLAIR datasets to train a deep-learning-based synthetic FLAIR method to correct for artifacts in synthetic FLAIR images [23], significantly improving the normalized root-mean-square values and the structural similarities. The results of these two studies suggest possible methods for correcting artifacts in synthetic images.
Our study has two limitations: the simple structure of our phantoms and the small sample size. First, in this study, we designed and used two phantoms with 14 specific concentrations of aqueous CuSO4, showing that the T1- and T2-values are similar to those of brain tissue, thus validating the accuracy of quantitative relaxation times acquired by synthetic scanning. However, brain tissues are anisotropic structures and can affect relaxation processes, and the simple structure of our phantoms could not describe actual brain tissue but only changes in free fluid spaces. Some have demonstrated that other types of phantoms could better reflect the reality in brain tissue compared to ours [24,25,26,27,28]; therefore, we suggest using those phantoms in further studies validating quantitative relaxation times. Second, this infers that our results are not generalizable to other comparisons between synthetic and clinical scanning in chronic ischemic stroke. Therefore, these results cannot be applied to acute/sub-acute stroke or hemorrhagic stroke. Further investigations using images in acute, sub-acute, and hemorrhagic stroke are now necessary.
In summary, this study shows high interday and intersession reliabilities of quantitative relaxation times in synthetic scans. Although discrepancies in T1 and T2 relaxation times and image contrasts in CSF regions were observed in synthetic scans, they did not affect the diagnoses of stroke lesions. Also, quantitative measures of relaxation times by such a fast and efficient means can improve the accuracy of ischemic stroke assessment, consequently increasing confidence in applying synthetic MRIs to ischemic stroke diagnoses.

Author Contributions

C.-W.L., A.-L.H., and W.P.C. made substantial contributions to conception and study design; C.-W.L., A.-L.H., C.-W.C.H., and S.-H.Y. contributed to data acquisition, analysis, or interpretation; C.-Y.L. and C.-C.S. provided technical support; C.-W.L. composed the first draft. All authors made critical revisions related to important intellectual content, and all approved the final version for publication and agree to be accountable for all aspects of the work and will appropriately investigate and resolve questions related to the accuracy and integrity of any part of the work. All authors have read and agreed to the published version of the manuscript.

Funding

The authors gratefully acknowledge the receipt of partial financial support from the Inter-agency Research Fund, Wan Fang Hospital, Taipei Medical University (Grant No. 107-wf-swf-09).

Conflicts of Interest

Two co-authors, C.Y.L. and C.-C.S., are employees of GE Healthcare, Taiwan, and they provided sequence information and technical support for the MAGiC software. No funding was received from GE Healthcare for publication activities.

Abbreviations

CNRcontrast-to-noise ratio
CSFcerebrospinal fluid
FLAIRfluid-attenuated inversion recovery
GMgray matter
MAGiCmagnetic resonance image compilation
SEspin-echo
TEecho time
TRrepetition time
TIinversion time
WMwhite matter

References

  1. Krauss, W.; Gunnarsson, M.; Andersson, T.; Thunberg, P. Accuracy and reproducibility of a quantitative magnetic resonance imaging method for concurrent measurements of tissue relaxation times and proton density. Magn. Reason. Imaging 2015, 33, 584–591. [Google Scholar] [CrossRef] [PubMed]
  2. Warntjes, J.B.M.; Dahlqvist, O.; Lundberg, P. Novel method for rapid, simultaneous T1, T*2, and proton density quantification. Magn. Reason. Med. 2007, 57, 528–537. [Google Scholar] [CrossRef] [PubMed]
  3. Riederer, S.J.; Suddarth, S.A.; Bobman, S.A.; Lee, J.N.; Wang, H.Z.; MacFall, J.R. Automated MR image synthesis: Feasibility studies. Radiology 1984, 153, 203–206. [Google Scholar] [CrossRef]
  4. Tanenbaum, L.N.; Tsiouris, A.J.; Johnson, A.N.; Naidich, T.P.; de Lano, M.C.; Melhem, E.R.; Quarterman, P.; Parameswaran, S.X.; Shankaranarayanan, A.; Goyen, M.; et al. Synthetic MRI for Clinical Neuroimaging: Results of the Magnetic Resonance Image Compilation (MAGiC) Prospective, Multicenter, Multireader Trial. AJNR Am. J. Neuroradiol. 2017, 38, 1103–1110. [Google Scholar] [CrossRef] [Green Version]
  5. Granberg, T.; Uppman, M.; Hashim, F.; Cananau, C.; Nordin, L.E.; Shams, S.; Berglund, J.; Forslin, Y.; Aspelin, P.; Fredrikson, S.; et al. Clinical Feasibility of Synthetic MRI in Multiple Sclerosis: A Diagnostic and Volumetric Validation Study. AJNR Am. J. Neuroradiol. 2016, 37, 1023–1029. [Google Scholar] [CrossRef] [Green Version]
  6. Blystad, I.; Warntjes, J.B.M.; Smedby, O.; Landtblom, A.-M.; Lundberg, P.; Larsson, E.-M. Synthetic MRI of the brain in a clinical setting. Acta Radiol. 2012, 53, 1158–1163. [Google Scholar] [CrossRef]
  7. Warntjes, J.B.M.; Leinhard, O.D.; West, J.; Lundberg, P. Rapid magnetic resonance quantification on the brain: Optimization for clinical usage. Magn. Reason. Med. 2008, 60, 320–329. [Google Scholar] [CrossRef] [PubMed]
  8. Rogers, H.J.; McGarry, B.L.; Knight, M.J.; Jokivarsi, K.T.; Gröhn, O.H.J.; Kauppinen, R.A. Timing the ischaemic stroke by 1H-MRI: Improved accuracy using absolute relaxation times over signal intensities. NeuroReport 2014, 25, 1180–1185. [Google Scholar] [CrossRef] [PubMed]
  9. Siemonsen, S.; Mouridsen, K.; Holst, B.; Ries, T.; Finsterbusch, J.; Thomalla, G.; Ostergaard, L.; Fiehler, J. Quantitative T2 values predict time from symptom onset in acute stroke patients. Stroke 2009, 40, 1612–1616. [Google Scholar] [CrossRef] [Green Version]
  10. Thangavel, K.; Saritaş, E.Ü. Aqueous paramagnetic solutions for MRI phantoms at 3 T: A detailed study on relaxivities. Turk. J. Elect. Engineer. Comput. Sci. 2017, 25, 2108–2121. [Google Scholar] [CrossRef]
  11. Lu, H.; Clingman, C.; Golay, X.; van Zijl, P.C.M. Determining the longitudinal relaxation time (T1) of blood at 3.0 Tesla. Magn. Reason. Med. 2004, 52, 679–682. [Google Scholar] [CrossRef]
  12. Ethofer, T.; Mader, I.; Seeger, U.; Helms, G.; Erb, M.; Grodd, W.; Ludolph, A.; Klose, U. Comparison of longitudinal metabolite relaxation times in different regions of the human brain at 1.5 and 3 Tesla. Magn. Reason. Med. 2003, 50, 1296–1301. [Google Scholar] [CrossRef] [PubMed]
  13. Greenman, R.L.; Shirosky, J.E.; Mulkern, R.V.; Rofsky, N.M. Double inversion black-blood fast spin-echo imaging of the human heart: A comparison between 1.5T and 3.0T. J. Magn. Reason. Imaging 2003, 17, 648–655. [Google Scholar] [CrossRef] [PubMed]
  14. Gelman, N.; Gorell, J.M.; Barker, P.B.; Savage, R.M.; Spickler, E.M.; Windham, J.P.; Knight, R.A. MR imaging of human brain at 3.0 T: Preliminary report on transverse relaxation rates and relation to estimated iron content. Radiology 1999, 210, 759–767. [Google Scholar] [CrossRef] [PubMed]
  15. Barral, J.K.; Gudmundson, E.; Stikov, N.; Etezadi-Amoli, M.; Stoica, P.; Nishimura, D.G. A robust methodology for in vivo T1 mapping. Magn. Reason. Med. 2010, 64, 1057–1067. [Google Scholar] [CrossRef] [Green Version]
  16. Schellinger, P.D.; Jansen, O.; Fiebach, J.B.; Hacke, W.; Sartor, K. A standardized MRI stroke protocol: Comparison with CT in hyperacute intracerebral hemorrhage. Stroke 1999, 30, 765–768. [Google Scholar] [CrossRef] [Green Version]
  17. Fonov, V.; Evans, A.C.; Botteron, K.; Almli, C.R.; McKinstry, R.C.; Collins, D.L. Brain Development Cooperative Group. Unbiased average age-appropriate atlases for pediatric studies. Neuroimage 2011, 54, 313–327. [Google Scholar] [CrossRef] [PubMed] [Green Version]
  18. Fonov, V.S.; Evans, A.C.; McKinstry, R.C.; Almli, C.R.; Collins, D.L. Unbiased nonlinear average age-appropriate brain templates from birth to adulthood. Neuroimage 2009, 47 (Suppl. 1), S102. [Google Scholar] [CrossRef]
  19. Rolls, E.T.; Joliot, M.; Tzourio-Mazoyer, N. Implementation of a new parcellation of the orbitofrontal cortex in the automated anatomical labeling atlas. Neuroimage 2015, 122, 1–5. [Google Scholar] [CrossRef]
  20. Tzourio-Mazoyer, N.; Landeau, B.; Papathanassiou, D.; Crivello, F.; Etard, O.; Delcroix, N.; Mazoyer, B.; Joliot, M. Automated anatomical labeling of activations in SPM using a macroscopic anatomical parcellation of the MNI MRI single-subject brain. Neuroimage 2002, 15, 273–289. [Google Scholar] [CrossRef]
  21. McGarry, B.L.; Jokivarsi, K.T.; Knight, M.J.; Gröhn, O.H.J.; Kauppinen, R.A. A Magnetic Resonance Imaging Protocol for Stroke Onset Time Estimation in Permanent Cerebral Ischemia. J. Vis. Exp. 2017, 16, e55277. [Google Scholar] [CrossRef] [PubMed]
  22. Hagiwara, A.; Otsuka, Y.; Hori, M.; Tachibana, Y.; Yokoyama, K.; Fujita, S.; Andica, C.; Kamagata, K.; Irie, R.; Koshino, S.; et al. Improving the Quality of Synthetic FLAIR Images with Deep Learning Using a Conditional Generative Adversarial Network for Pixel-by-Pixel Image Translation. AJNR Am. J. Neuroradiol. 2019, 40, 224–230. [Google Scholar] [CrossRef] [PubMed] [Green Version]
  23. Ryu, K.; Nam, Y.; Gho, S.-M.; Jang, J.; Lee, H.-J.; Cha, J.; Baek, H.J.; Jiyong, P.; Kim, D.H. Data-driven synthetic MRI FLAIR artifact correction via deep neural network. J. Magn. Reason. Imaging 2019, 50, 1413–1423. [Google Scholar] [CrossRef]
  24. Krzyzak, A.; Klodowski, K.; Raszewski, Z. Anisotropic Phantoms in Magnetic Resonance Imaging. In Proceedings of the 37th Annual International Conference of the IEEE Engineering in Medicine and Biology Society (EMBC), Milan, Italy, 25–29 August 2015; pp. 414–417. [Google Scholar]
  25. Kłodowski, K.; Krzyżak, A.T. Innovative anisotropic phantoms for calibration of diffusion tensor imaging sequences. Magn. Reason. Imaging 2016, 34, 404–409. [Google Scholar] [CrossRef] [PubMed]
  26. Fieremans, E.; Lee, H.-H. Physical and numerical phantoms for the validation of brain microstructural MRI: A cookbook. Neuroimage 2018, 182, 39–61. [Google Scholar] [CrossRef]
  27. Mazur, W.; Krzyzak, A.T.; Raszewski, Z. Towards the precise microstructural mapping. Testing new anisotropic phantoms with layered and capillary geometries. In Proceedings of the 41st Annual International Conference of the IEEE Engineering in Medicine and Biology Society (EMBC), Berlin, Germany, 23–27 July 2019; pp. 2835–2839. [Google Scholar]
  28. De Souza, E.M.; Costa, E.T.; Castellano, G. Investigation of anisotropic fishing line-based phantom as tool in quality control of diffusion tensor imaging. Radiol. Phys. Technol. 2019, 12, 161–171. [Google Scholar] [CrossRef]
Figure 1. The structures of two phantoms designed for validating T1- and T2-value quantitation. Plastic tubes (cylinder structure with 7.1 cm2 in dimension and 6.0 cm in height) filled with various concentrations of CuSO4 were sealed and fixed in the plastic tanks. The plastic tank was filled with normal saline to minimize image artifacts.
Jcm 09 01857 g001
Figure 2. Data processing flowchart for quantitative tissue contrast validating synthetic scans.
Jcm 09 01857 g002
Figure 3. The difference in T1- and T2-values of two aqueous CuSO4 phantoms between the synthetic and clinical scans.
Jcm 09 01857 g003
Figure 4. Images acquired by clinical and synthetic scanning of a 64-year-old male patient with stroke.
Jcm 09 01857 g004
Figure 5. The standardized contrast-to-noise ratio (CNR) in synthetic and clinical scans of four brain regions. Significant differences were found between synthetic and clinical T2-weighted and T2-FLAIR images of cerebrospinal fluid regions (* Bonferroni corrected p < 0.05).
Jcm 09 01857 g005
Table 1. Demographic data of each included stroke patient.
Patient (n = 18)Age (Year)SexLesion Location(s)
Patient 0164MaleLeft striatum
Patient 0244FemaleLeft striatum
Patient 0364MaleLeft cerebellum
Patient 0466MaleLeft striatum
Patient 0563FemaleRight temporal and frontal lobes
Patient 0650MaleLeft parietal lobe
Patient 0766MaleLeft frontal lobe
Patient 0855MaleLeft striatum
Patient 0956MaleLeft parietal lobe
Patient 1056FemaleLeft insula
Patient 1158FemaleRight parietal lobe
Patient 1269MaleLeft striatum
Patient 1355MaleRight striatum
Patient 1462MaleLeft cerebellum
Patient 1557MaleLeft parietal lobe and right striatum
Patient 1657MaleLeft striatum
Patient 1766MaleRight striatum
Patient 1864MaleRight parietal lobe
Table 2. Average quantitative values acquired using conventional magnetic resonance imaging (MRI) spin-echo sequences and synthetic MRI scans.
T1 Value
CuSO4 ConcentrationReference ValueQuantitative Value, Synthetic Scan, Day 1Quantitative Value, Synthetic Scan, Day 2
1–11–21–31–41–51–61–72–12–22–32–42–52–62–7
1.0 mM1131.51123.11128.81122.61127.71122.21119.91126.21110.51111.01111.11105.61107.51111.21107.8
0.8 mM1357.81254.11254.91257.51260.11252.11262.01257.91240.81241.31231.01231.71236.61235.11233.9
0.7 mM1456.41463.01474.81476.31470.01460.81468.61457.31419.81416.01411.21402.41412.81407.91404.4
0.6 mM1503.71785.41798.61794.51790.51787.71781.81793.01789.31776.91767.51764.91771.91772.51764.5
0.5 mM1719.01883.31892.61889.51885.21879.71874.31898.21887.61884.61872.31887.21897.61888.21885.8
0.4 mM1843.82071.62088.32086.32082.12077.32061.32084.32099.52095.62088.22096.72101.72099.82100.5
0.2 mM2117.22612.32621.52620.82620.02614.72610.02628.22663.22665.02662.42665.82669.12666.32671.7
T2 Value
CuSO4 ConcentrationReference ValueQuantitative Value, Synthetic Scan, Day 1Quantitative Value, Synthetic Scan, Day 2
1–11–21–31–41–51–61–72–12–22–32–42–52–62–7
20.0 mM58.557.457.557.557.557.457.456.957.457.557.557.557.457.457.2
15.0 mM64.058.958.958.958.958.958.958.758.958.958.958.958.958.958.7
13.0 mM82.480.580.680.180.179.779.780.280.580.680.180.179.779.779.9
11.0 mM94.086.486.686.686.286.786.786.886.486.686.686.286.786.786.5
9.0 mM126.7100.8100.7100.7100.7100.8100.8100.8100.8100.7100.7100.7100.8100.8100.7
7.0 mM166.9122.9122.4122.4122.4122.2122.2122.3122.9122.4122.4122.4122.2122.2122.4
5.0 mM230.3253.3252.7253.2252.2252.8252.8253.1253.2252.5253.1252.1252.7252.7251.3
Table 3. Diagnostic image quality rated by two radiologists.
QuestionT1-Weighted ImageT2-Weighted ImageT2-FLAIR Image
SYNCLISYNCLISYNCLI
What is the image quality for diagnostic use? a8.06 **
(0.79)
9.42
(0.28)
8.53 *
(1.00)
9.42
(0.84)
7.89 **
(1.94)
9.36
(0.49)
Are these images acceptable for diagnostic use? b 0.97
(0.17)
0.97
(0.17)
Values are means, standard deviations are shown in parentheses. FLAIR = fluid-attenuated inversion recovery, SYN = synthetic scan, CLI = clinical scan. a Eleven-point scale (0–10); b Two-point scale (0, 1); * corrected p < 0.05; ** corrected p < 0.01.

