Article

Potential Mechanisms of AtNPR1 Mediated Resistance against Huanglongbing (HLB) in Citrus

1
Institute of Fruit and Tea, Hubei Academy of Agricultural Sciences, Wuhan 430064, China
2
Citrus Research and Education Center, University of Florida, Lake Alfred, FL 33850, USA
*
Author to whom correspondence should be addressed.
Int. J. Mol. Sci. 2020, 21(6), 2009; https://doi.org/10.3390/ijms21062009
Submission received: 20 February 2020 / Revised: 12 March 2020 / Accepted: 12 March 2020 / Published: 16 March 2020
(This article belongs to the Section Molecular Biology)

Abstract

:
Huanglongbing (HLB), a bacterial disease caused by Candidatus Liberibacter asiaticus (CLas), is a major threat to the citrus industry. In a previous study conducted by our laboratory, several citrus transgenic trees expressing the Arabidopsis thaliana NPR1 (AtNPR1) gene remained HLB-free when grown in a field site under high HLB disease pressure. To determine the molecular mechanisms behind AtNPR1-mediated tolerance to HLB, a transcriptome analysis was performed using AtNPR1 overexpressing transgenic trees and non-transgenic trees as control, from which we identified 57 differentially expressed genes (DEGs). Data mining revealed the enhanced transcription of genes encoding pathogen-associated molecular patterns (PAMPs), transcription factors, leucine-rich repeat receptor kinases (LRR-RKs), and putative ankyrin repeat-containing proteins. These proteins were highly upregulated in the AtNPR1 transgenic line compared to the control plant. Furthermore, analysis of protein–protein interactions indicated that AtNPR1 interacts with CsNPR3 and CsTGA5 in the nucleus. Our results suggest that AtNPR1 positively regulates the innate defense mechanisms in citrus thereby boosting resistance and effectively protecting the plant against HLB.

1. Introduction

Huanglongbing (HLB), also known as citrus greening, is caused by the phloem-limited pathogenic bacterium Candidatus Liberibacter asiaticus (CLas) and is the most destructive disease in citrus plants [1]. CLas infects most Citrus cultivars, including sweet orange, mandarin, lemon, and grapefruit, and causes severe disease symptoms, with severely infected trees experiencing a reduction in fruit yield and quality, leading to the plant’s eventual decline and death. Tolerance to HLB has been reported in citron and in some trifoliate oranges and their hybrids [2]. To date, there is no definitive cure for HLB; however, to prevent the further spread of disease, methods such as insect vector control, tree health management, and the destruction of infected plants are necessary [3,4].
Several treatments have been used to control the spread of HLB in citrus trees, including antibiotic and antimicrobial treatments [5,6], heat treatment [7], and trunk injection of plant defense activators [8]. Moreover, to manage the disease, several plant defense inducers have been sprayed on HLB-infected field trees [9]. The premise behind these studies is that induced resistance, either in a local manner or spread systemically throughout the trees, could confer long-lasting protection against HLB by activating the salicylic acid (SA) signaling or systemic acquired resistance (SAR) pathways [10]. The NONEXPRESSOR OF PATHOGENESIS RELATED GENE 1 (NPR1) is a crucial regulator of SAR and plays an essential role in SAR activation [11,12]. In response to pathogen infection, an accumulation of SA is observed, and NPR1 oligomers present in the cytoplasm are reduced to their monomeric form, after which they move to the nucleus of the plant cells. In the nucleus, NPR1 protein binds to TGA transcription factors to induce PATHOGENESIS RELATED 1 (PR1) gene expression [13,14,15,16,17]. The three TGAs (TGA2, TGA5, and TGA6) function redundantly to positively regulate SA-induced immune responses [17]. In Arabidopsis, NPR1 paralogs NPR3/NPR4 were identified as SA receptors. The NPR1 and NPR3/NPR4 proteins function independently and play opposite roles in SA-induced pathogen resistance [18,19].
As a key regulator of SAR, NPR1 confers long-lasting broad-spectrum resistance in plants. In rice, the expression of Arabidopsis NPR1 (AtNPR1) transgene not only enhances resistance to the bacterial pathogen Xanthomonas oryzae pv. oryzae but also induces a lesion-mimic/cell death phenotype [20,21]. NPR1, as well as other genes in its pathway in crops such as wheat [22], tobacco [23], soybean [24], and sweet sagewort [25], were considered to be effective candidates for engineering transgene-mediated disease resistance. In addition to disease resistance, the NPR1-dependent SA signaling pathway plays a role in abiotic stress, as it modulates reactive oxygen species, proline, and redox states during salt and oxidative stresses [26], drought stress [27], and cold acclimation [28].
The overexpression of AtNPR1 or its orthologs resulted in enhanced resistance to biotic and abiotic stress in several fruit and vegetable crops such as grape, carrot, tomato, apple, citrus, tobacco, and strawberry [29]. In citrus, overexpressing AtNPR1 in ‘Duncan’ grapefruit and ‘Hamlin’ sweet orange conferred increased resistance to citrus canker [30]. ‘Hamlin’ and ‘Valencia’ sweet orange transgenic lines ectopically expressing AtNPR1 under the control of the cauliflower mosaic virus (CaMV) 35S promoter or the Arabidopsis thaliana SUCROSE SYNTHASE 2 promoter (AtSUC2, a phloem specific promoter) has remained HLB-free in a site of high disease pressure [31]. In that study, several plant defense related genes were highly upregulated, however, a detailed study to elucidate the underlying mechanisms behind HLB resistance was not performed. In this study, an in-depth analysis, including a study of the transcriptome of the HLB resistant transgenic line, was conducted.

2. Results

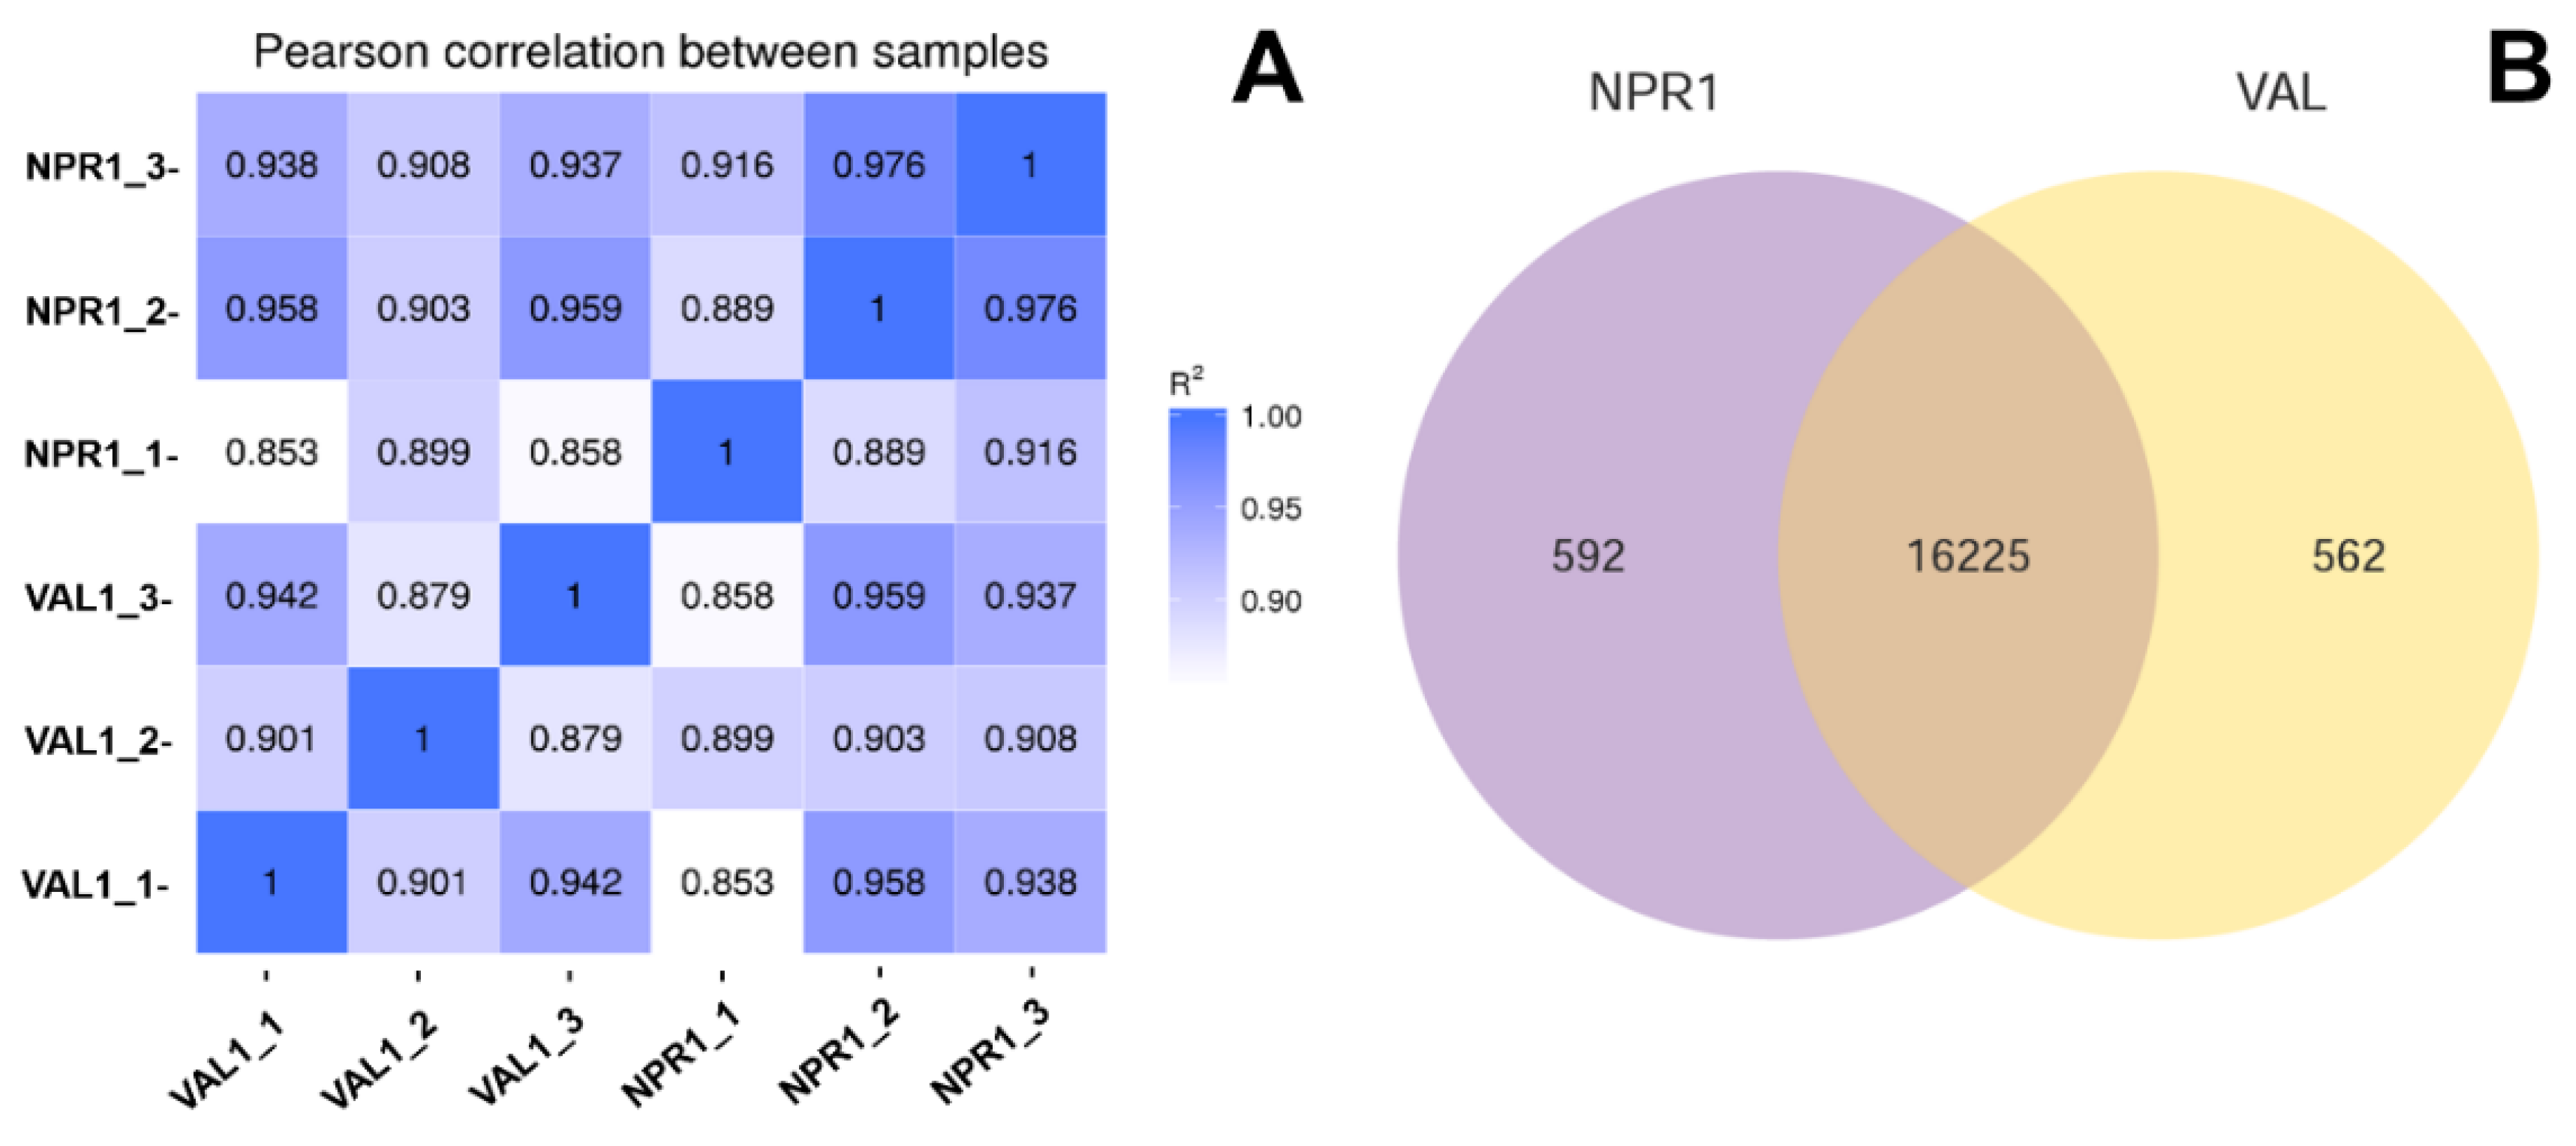
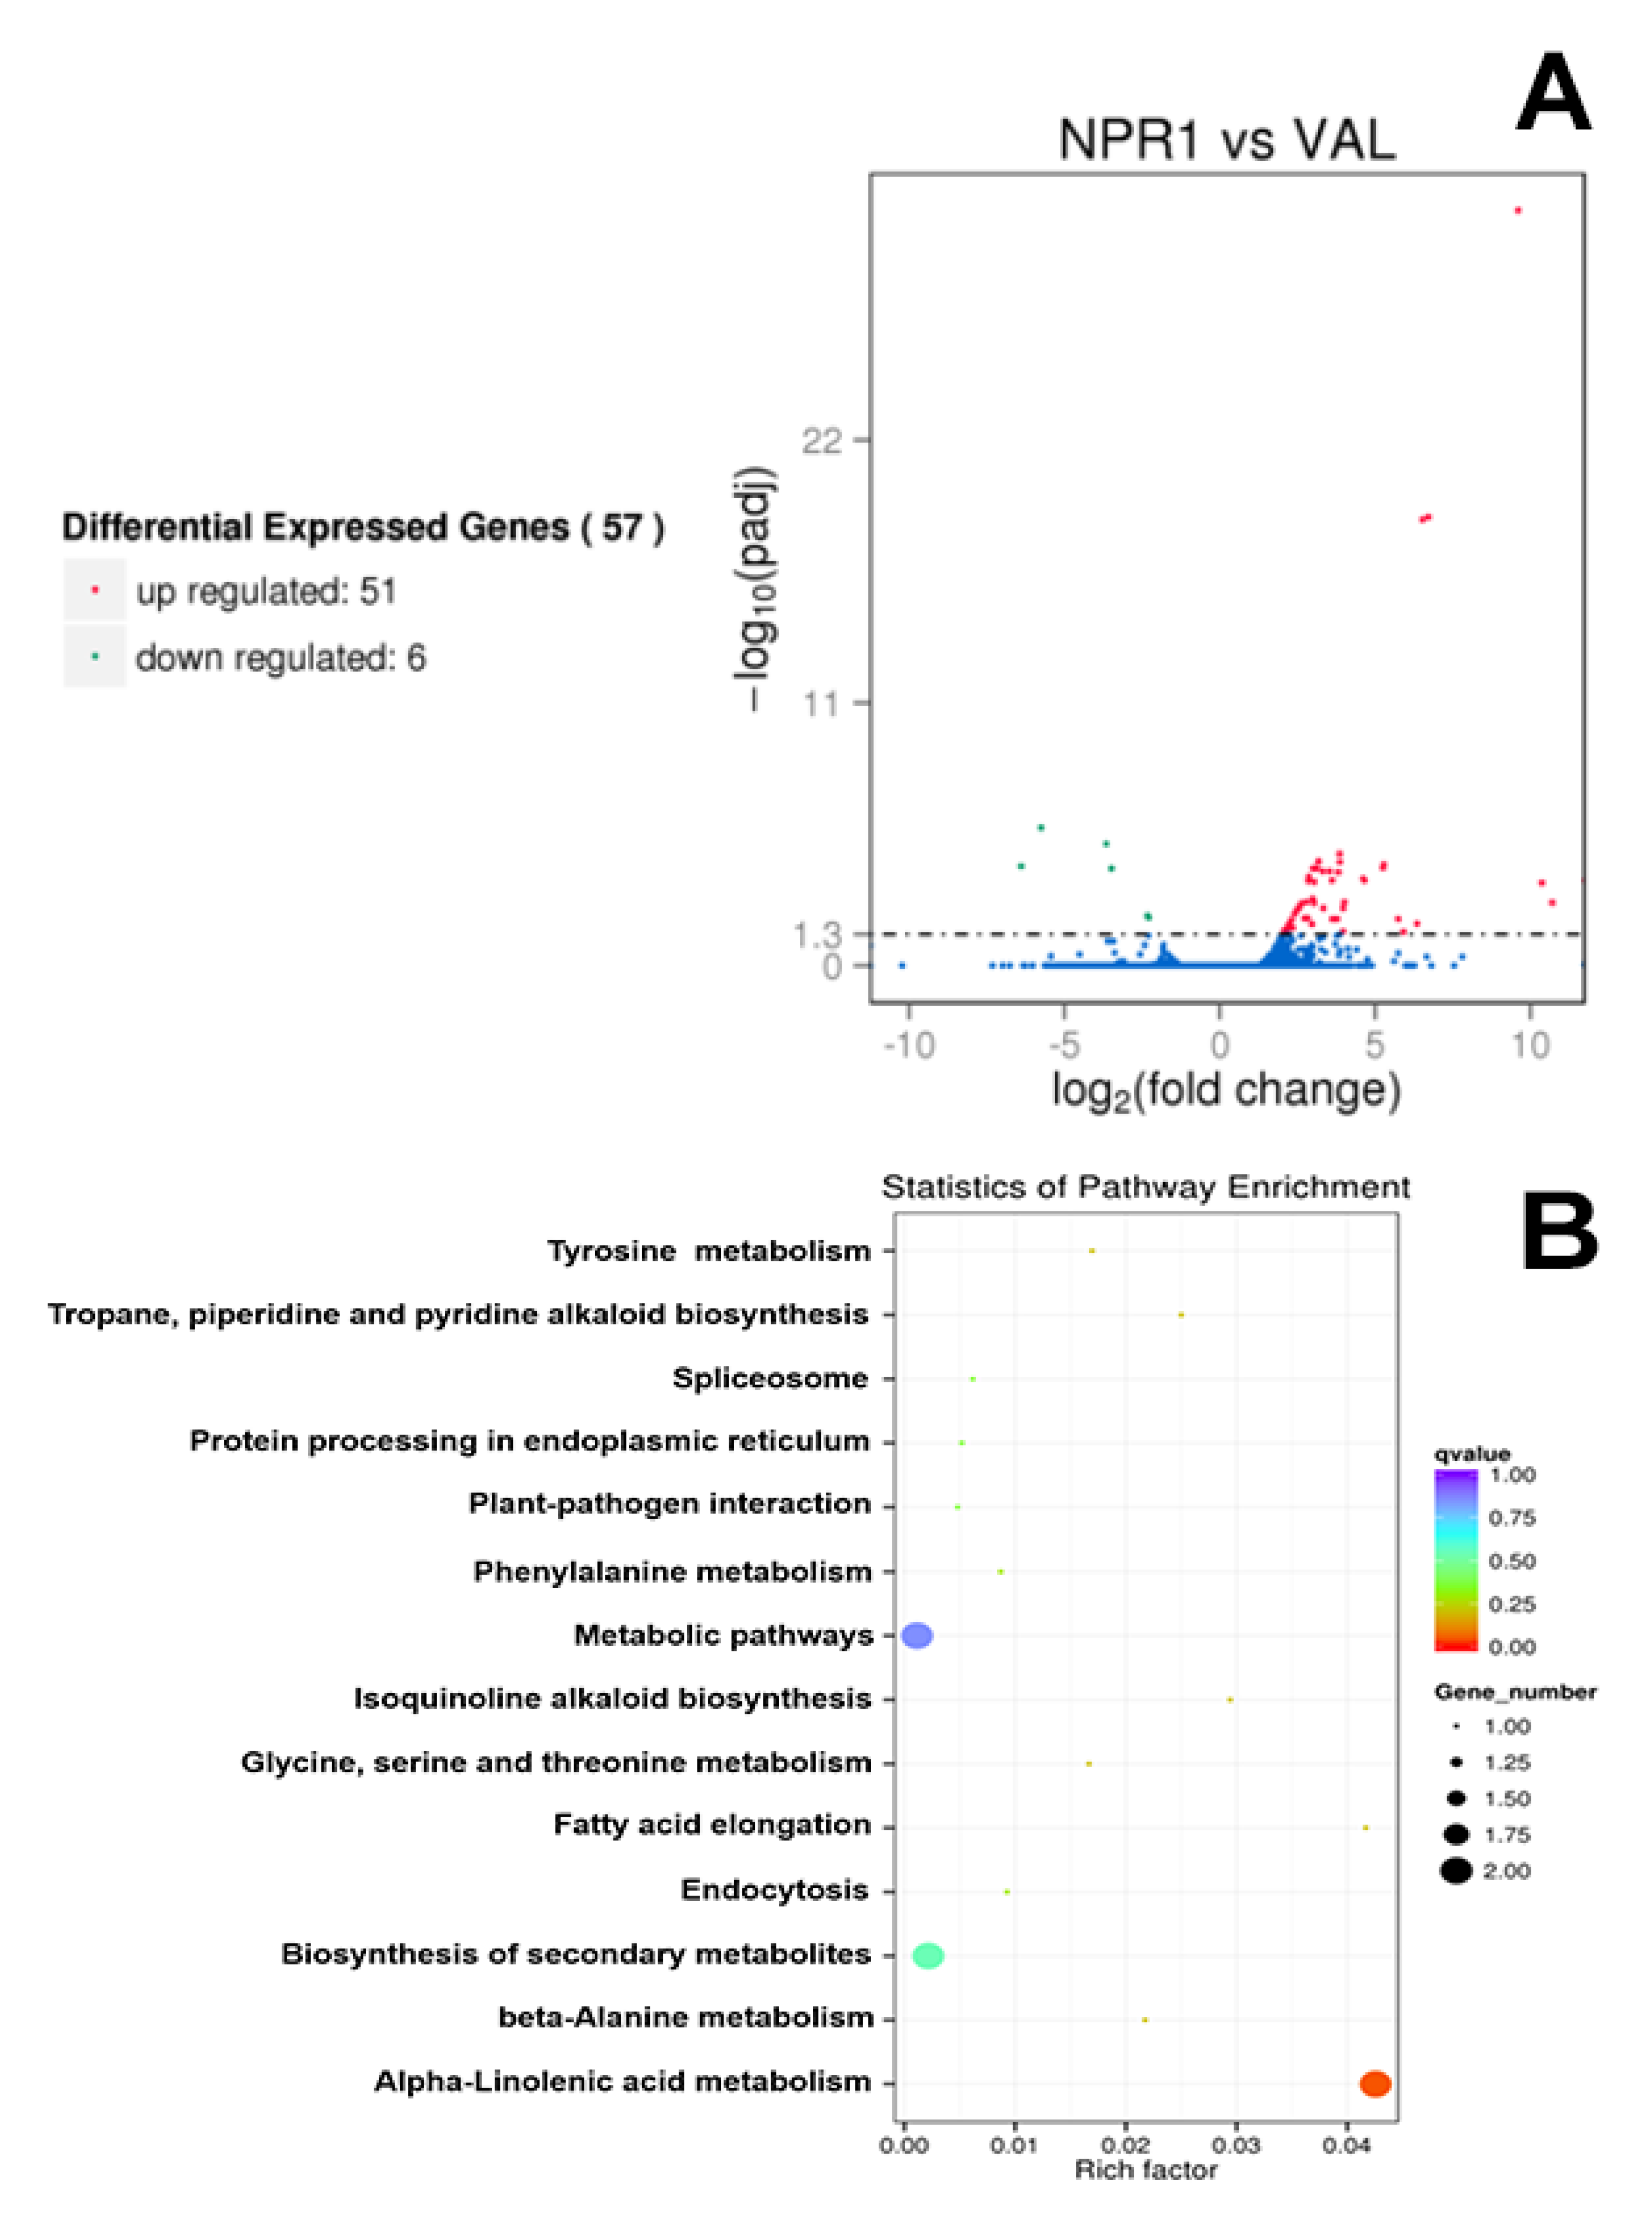
2.1. Transcriptome Sequencing and Differentially Expressed Genes (DEGs) Identification

To investigate the transcriptional responses associated with AtNPR1 overexpression in ‘Valencia’ sweet orange plants, we performed RNA sequencing (RNAseq) analyses on a selected NPR overexpressing line and a non-transgenic control plant. Our previous studies showed that the NPR1-2 transgenic line consistently expressed the highest levels of the transgene, as such, this line was the transgenic line of choice and ‘Valencia’ (Val) the non-transgenic control. Leaf samples from three independent replicates were collected, and total RNA for Illumina RNAseq was extracted, from which six cDNA libraries were constructed.
The raw data were filtered and mapped as shown in Table 1. Results showed 373.65 million clean reads with a total of 47 billion guanine (G) base numbers. The percentage of high-quality reads (a quality score higher than 30 (Q30) indicates that the base call accuracy of each read is more than 99.9%) in each library was more than 92%. Afterwards, the clean reads were mapped to the reference genome using the TopHat2 software, showing at least 76% reads of each sample mapped to the reference genome. These results indicated absence of contamination and that the reference genome was appropriately chosen, since more than 73% reads could be uniquely mapped (Table 1). In this study, R2 was larger than 0.85 for both the tested samples (Figure 1A), demonstrating the experiment’s reliability and its usefulness in revealing differences in gene expression between samples.
In total, 16,817 and 16,787 expressing genes were identified in the transgenic and control lines, respectively. Among those, 592 genes were specific to the transgenic line, whereas 562 genes were specifically expressing in the control Val as demonstrated in the Venn diagram (Figure 1B). The differentially expressed genes (DEGs) between NPR1-2 and Val were screened using the DESeq software with padj < 0.05, from which 57 DEGs were identified, of which there were 51 upregulated genes and six downregulated genes (Figure 2A). The DEGs were annotated using the sequence of the best hit gene in the reference genome. The functional description determined by BLASTx alignment indicated the presence of 40 upregulated DEGs and five downregulated DEGs which represent functional genes, whereas 11 DEGs were determined to be nonfunctional. The upregulated DEGs were composed of at least five genes encoding ankyrin repeat-containing proteins, four coding for mechanosensitive ion channel protein including a CYCLIC NUCLEOTIDE-GATED ION CHANNEL 1 (CNGC1) and four LEUCINE-RICH REPEAT RECEPTOR KINASES (LRR-RKs). In addition, putative pathogen-associated molecular patterns (PAMP) transcription factors such as MYB4, NAC68, and WRKY51/70 were also upregulated. Among the five downregulated DEGs, three belong to the MADS-box family gene (including AGL8 and SEP2), one is 3-KETOACYL-COA SYNTHASE 11, and one is GERANIOL 8-HYDROXYLASE (Table 2).
To reveal the differences in metabolic pathways, DEGs were analyzed using the Kyoto Encyclopedia of Genes and Genomes (KEGG) pathway enrichment analysis, from which a total of 17 DEGs were annotated in 14 pathway terms. However, only the pathway involved in alpha-linolenic acid metabolism was significantly enriched at the corrected p-value threshold of < 0.05 (Figure 2B). Gene ontology (GO) enrichment analysis showed the functional classification of 28 GO terms, but no enriched GO terms were obtained using a corrected p-value threshold of < 0.05 (Figure 3).

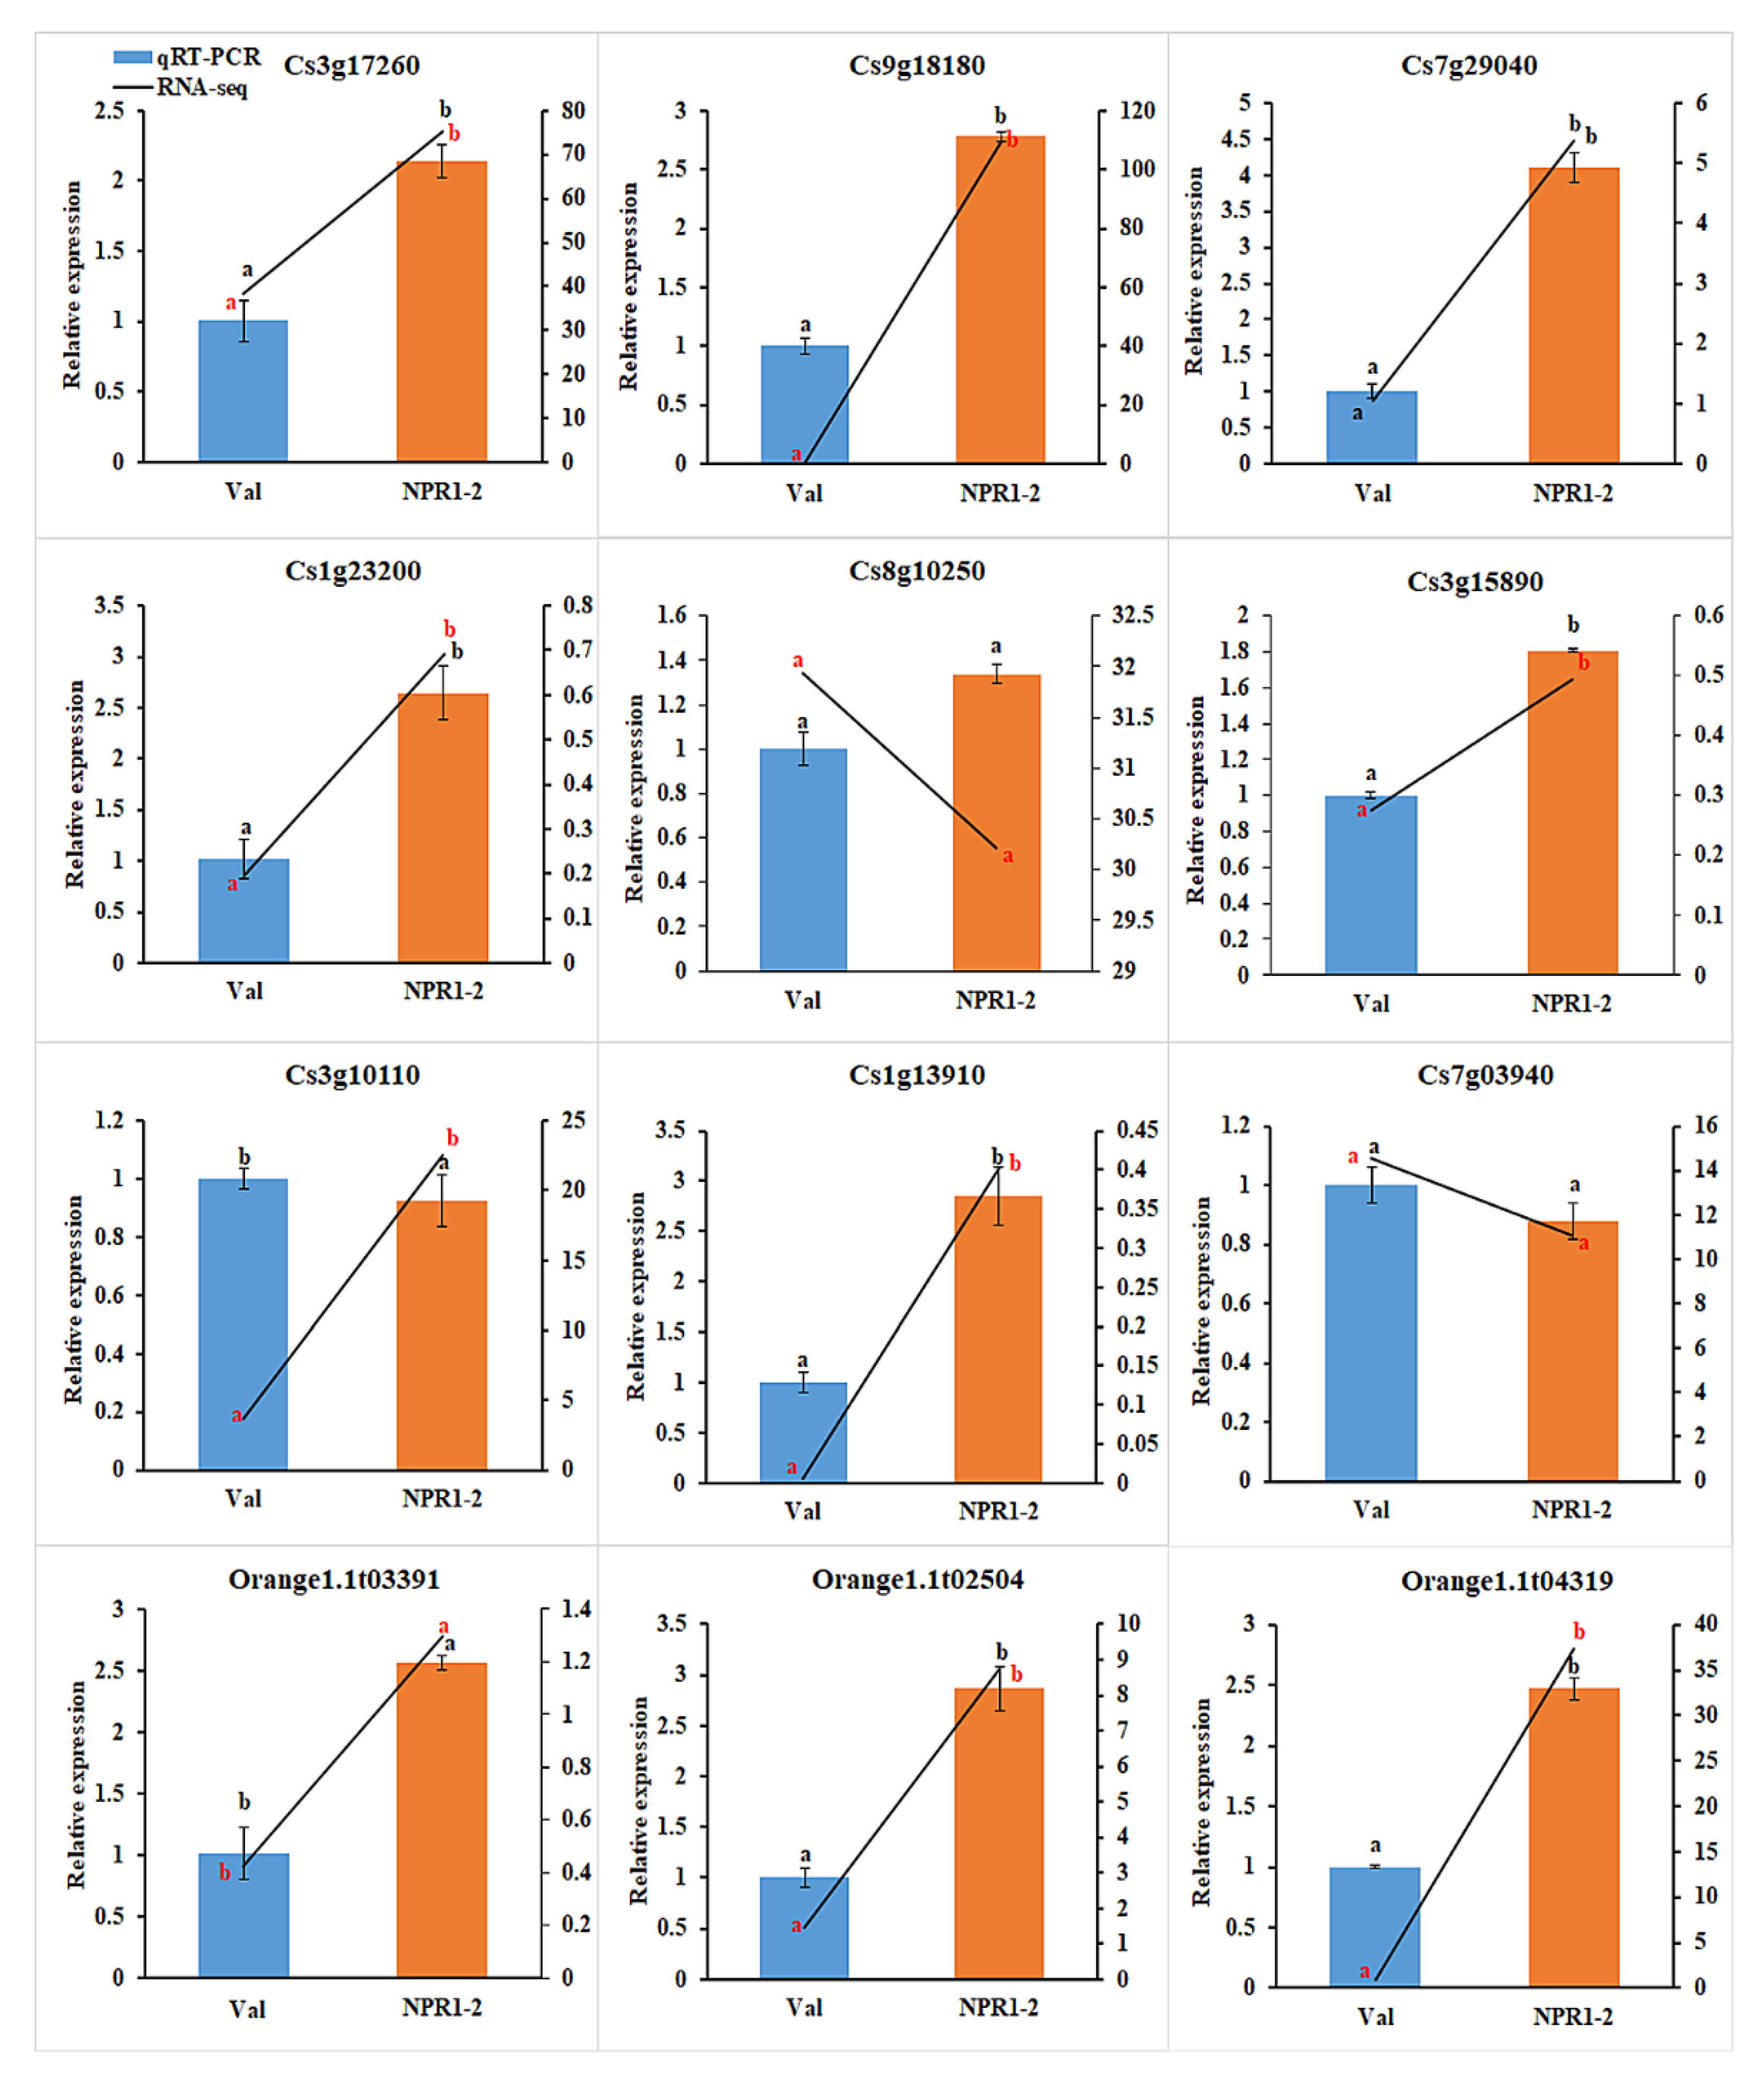
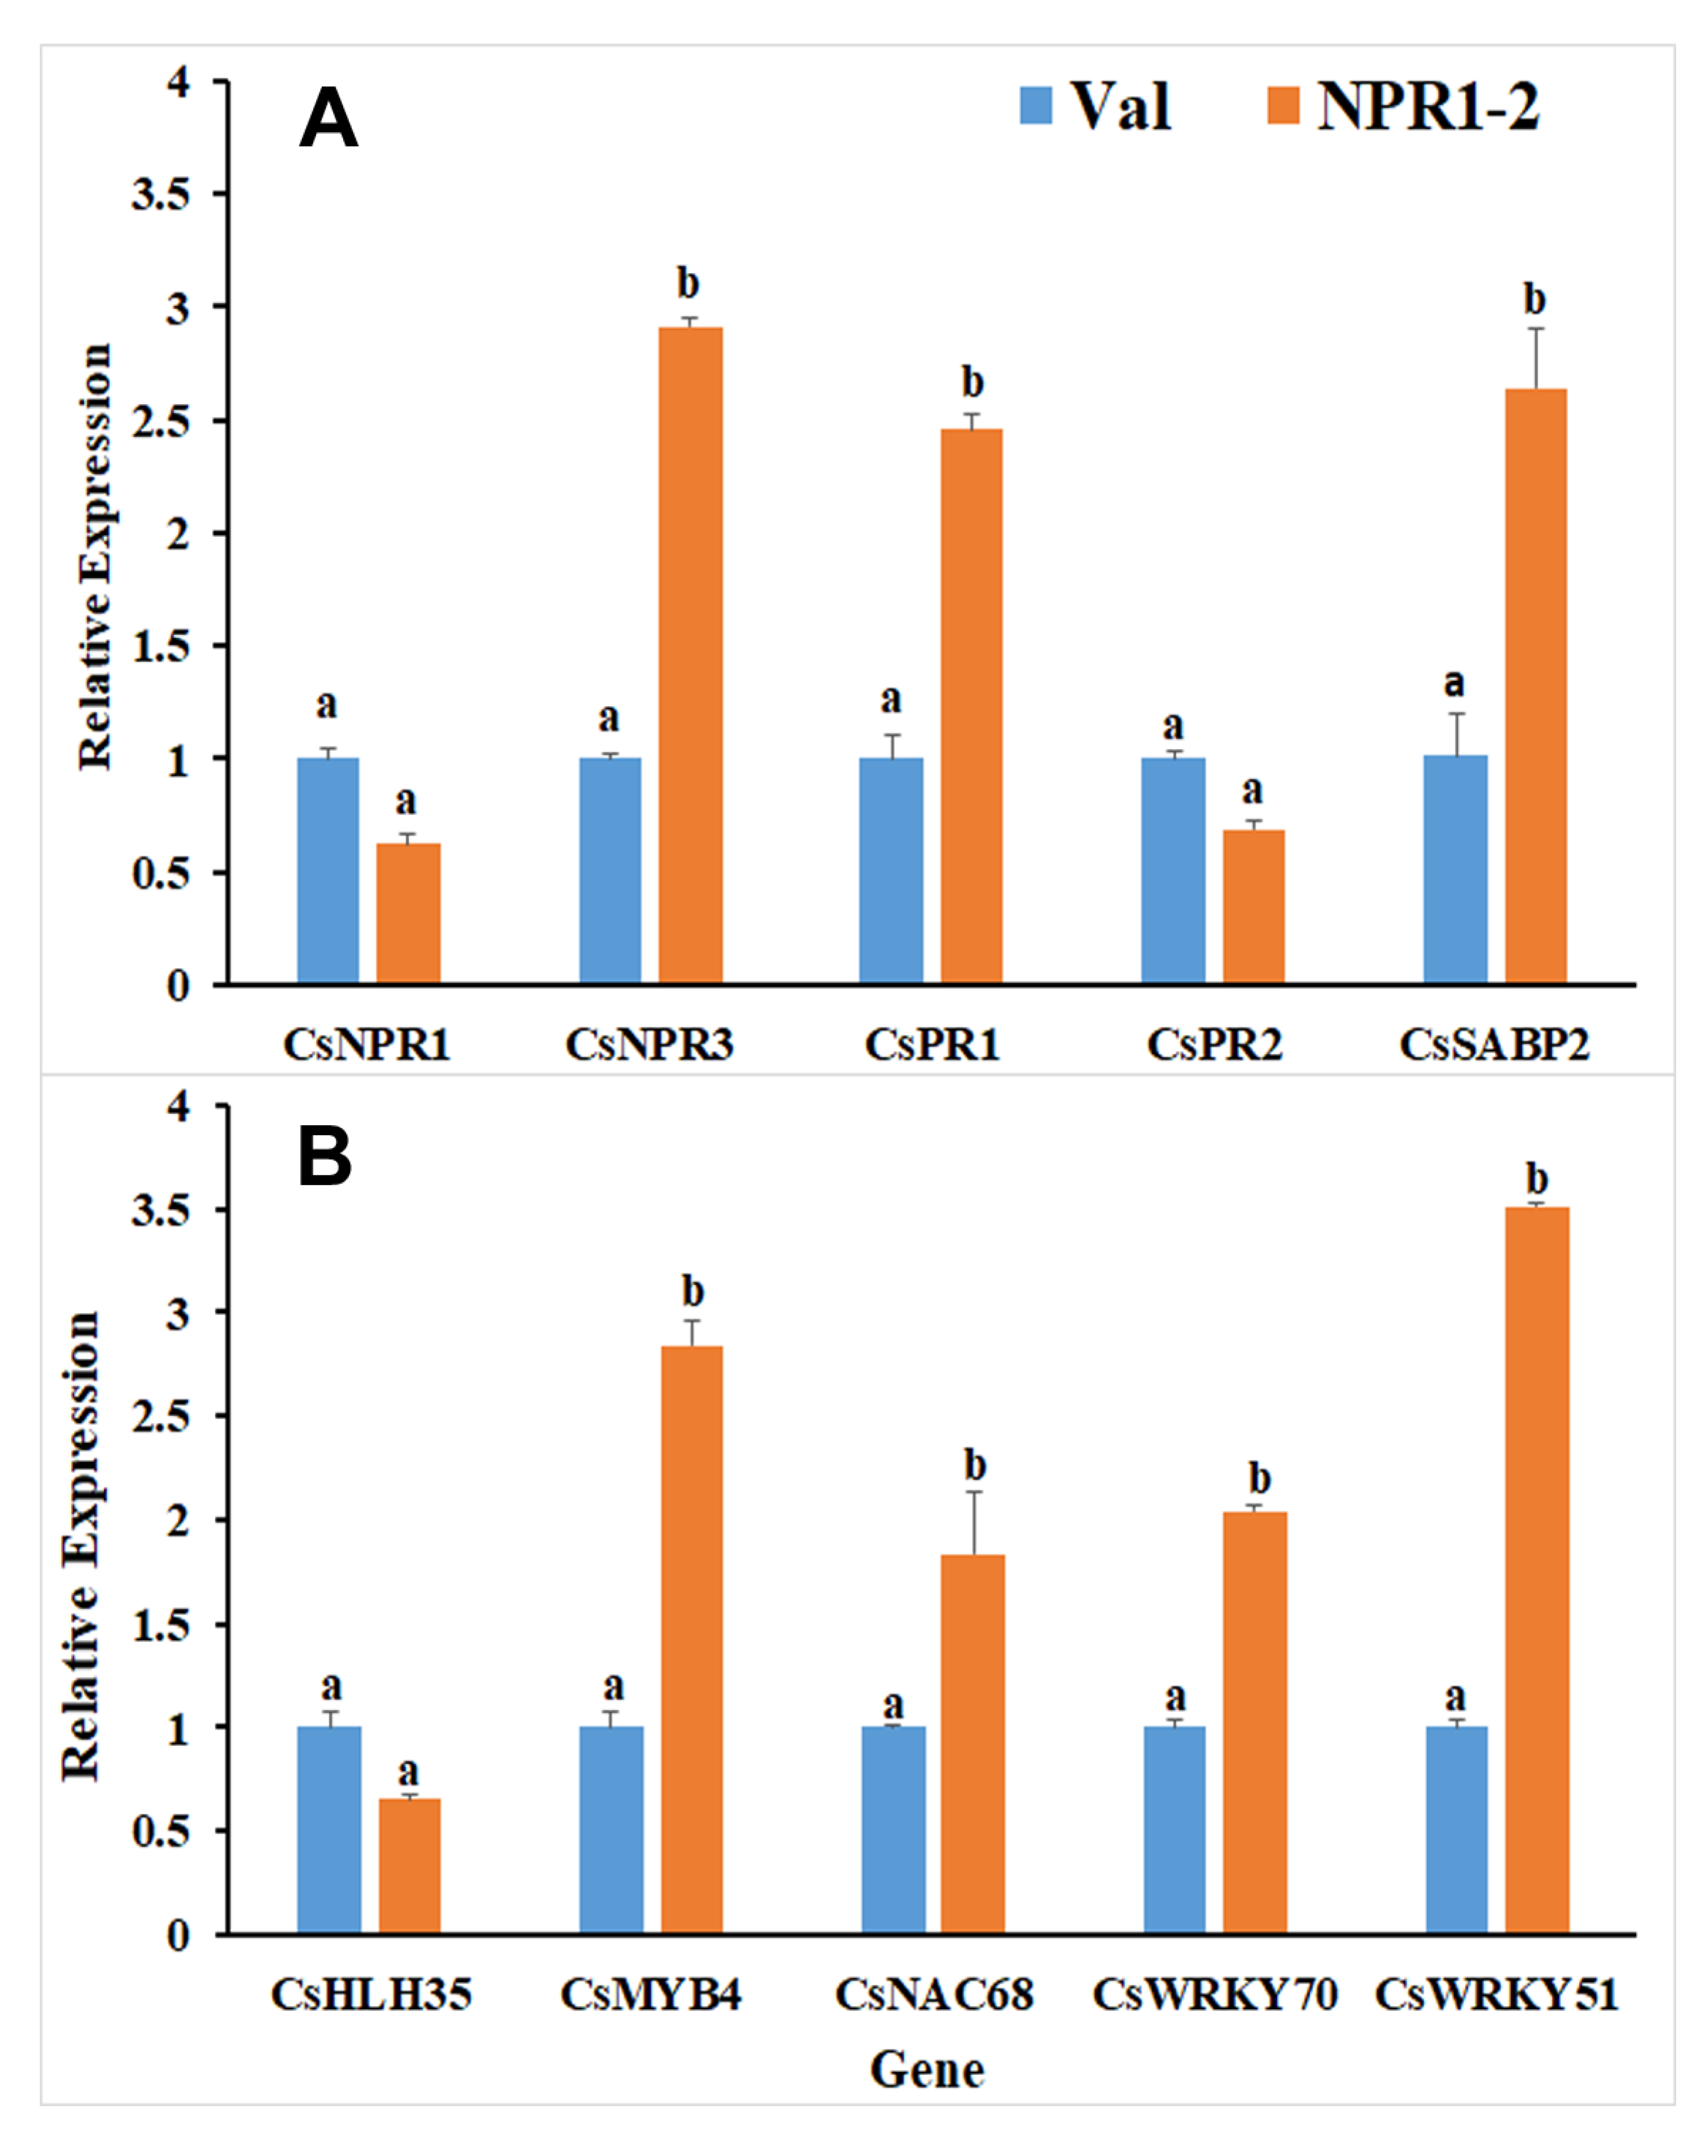
2.2. Expression of DEGs Candidate in RNAseq Correlates with qRT-PCR

To verify the accuracy of the RNAseq results, 12 DEGs were selected for quantitative PCR (qRT-PCR) validation (Supplementary Tables S1 and S2). The qRT-PCR and RNAseq expression levels of selected DEGs were calculated using the 2-ΔΔCt method and the fragments per kilobase of exon per million reads (FPKM) value, respectively. The results indicated that 11 DEGs, such as the CYCLIC NUCLEOTIDE-GATED ION CHANNEL 1, HEAT SHOCK COGNATE 70 KDA PROTEIN, LEUCINE RICH REPEAT (LRR) RECEPTOR-LIKE SERINE/THREONINE-PROTEIN KINASE, WALL-ASSOCIATED RECEPTOR KINASE-LIKE 10, and the ankyrin repeat-containing protein, showed consistent expression tendencies between both techniques, indicating the reliability of the RNAseq results for gene quantification analysis (Figure 4).
To get more insights regarding the defense-related pathways in the transgenic line, the expression levels of 10 other DEGs were quantified using qRT-PCR, wherein three of these genes are involved in the salicylic acid (SA) signaling pathway, two are PATHOGENESIS-RELATED genes, and five are transcription factors (TF) that function downstream of the NPR1 protein in the pathway. In comparison to the non-transgenic control (Val), Citrus sinensis NPR3 (CsNPR3), CsPR1, and CsSABP2 genes were upregulated in the NPR1-2 line whereas CsPR2 was significantly downregulated (Figure 5). Among the five TFs, only bHLH35 had reduced expression in line NPR1-2, whereas MYB4, NAC68, WRKY70, and WRKY51 were upregulated.

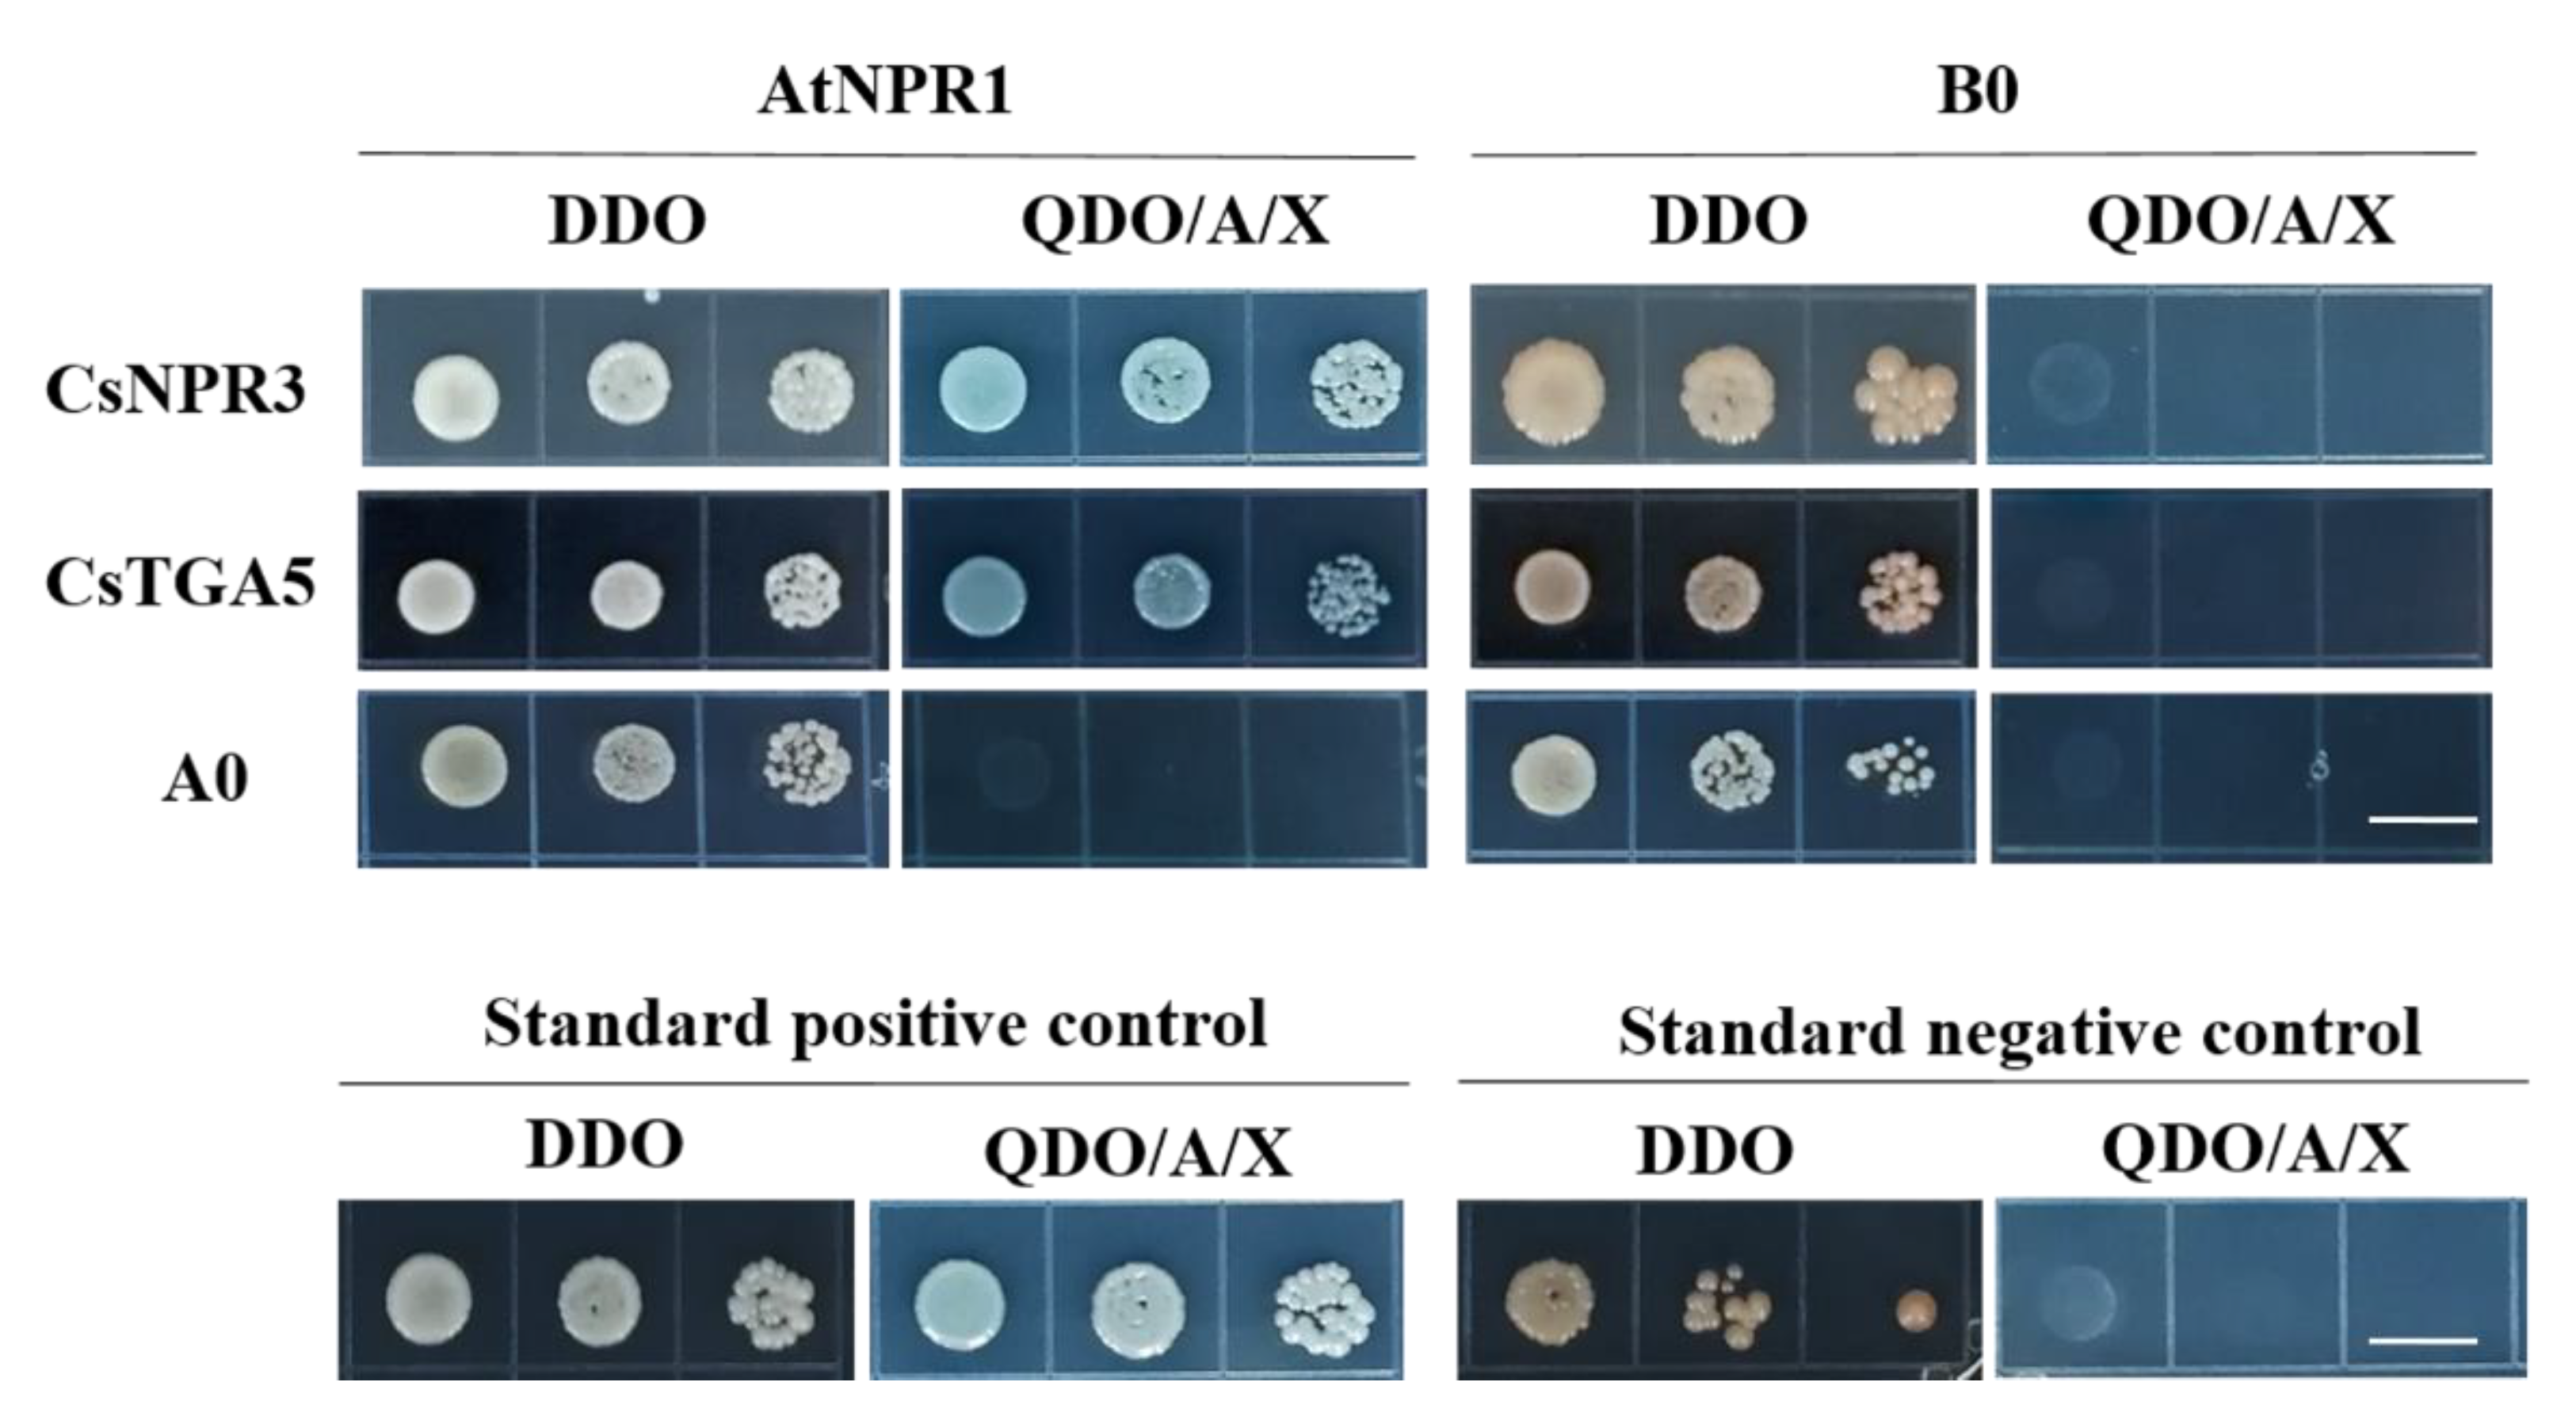
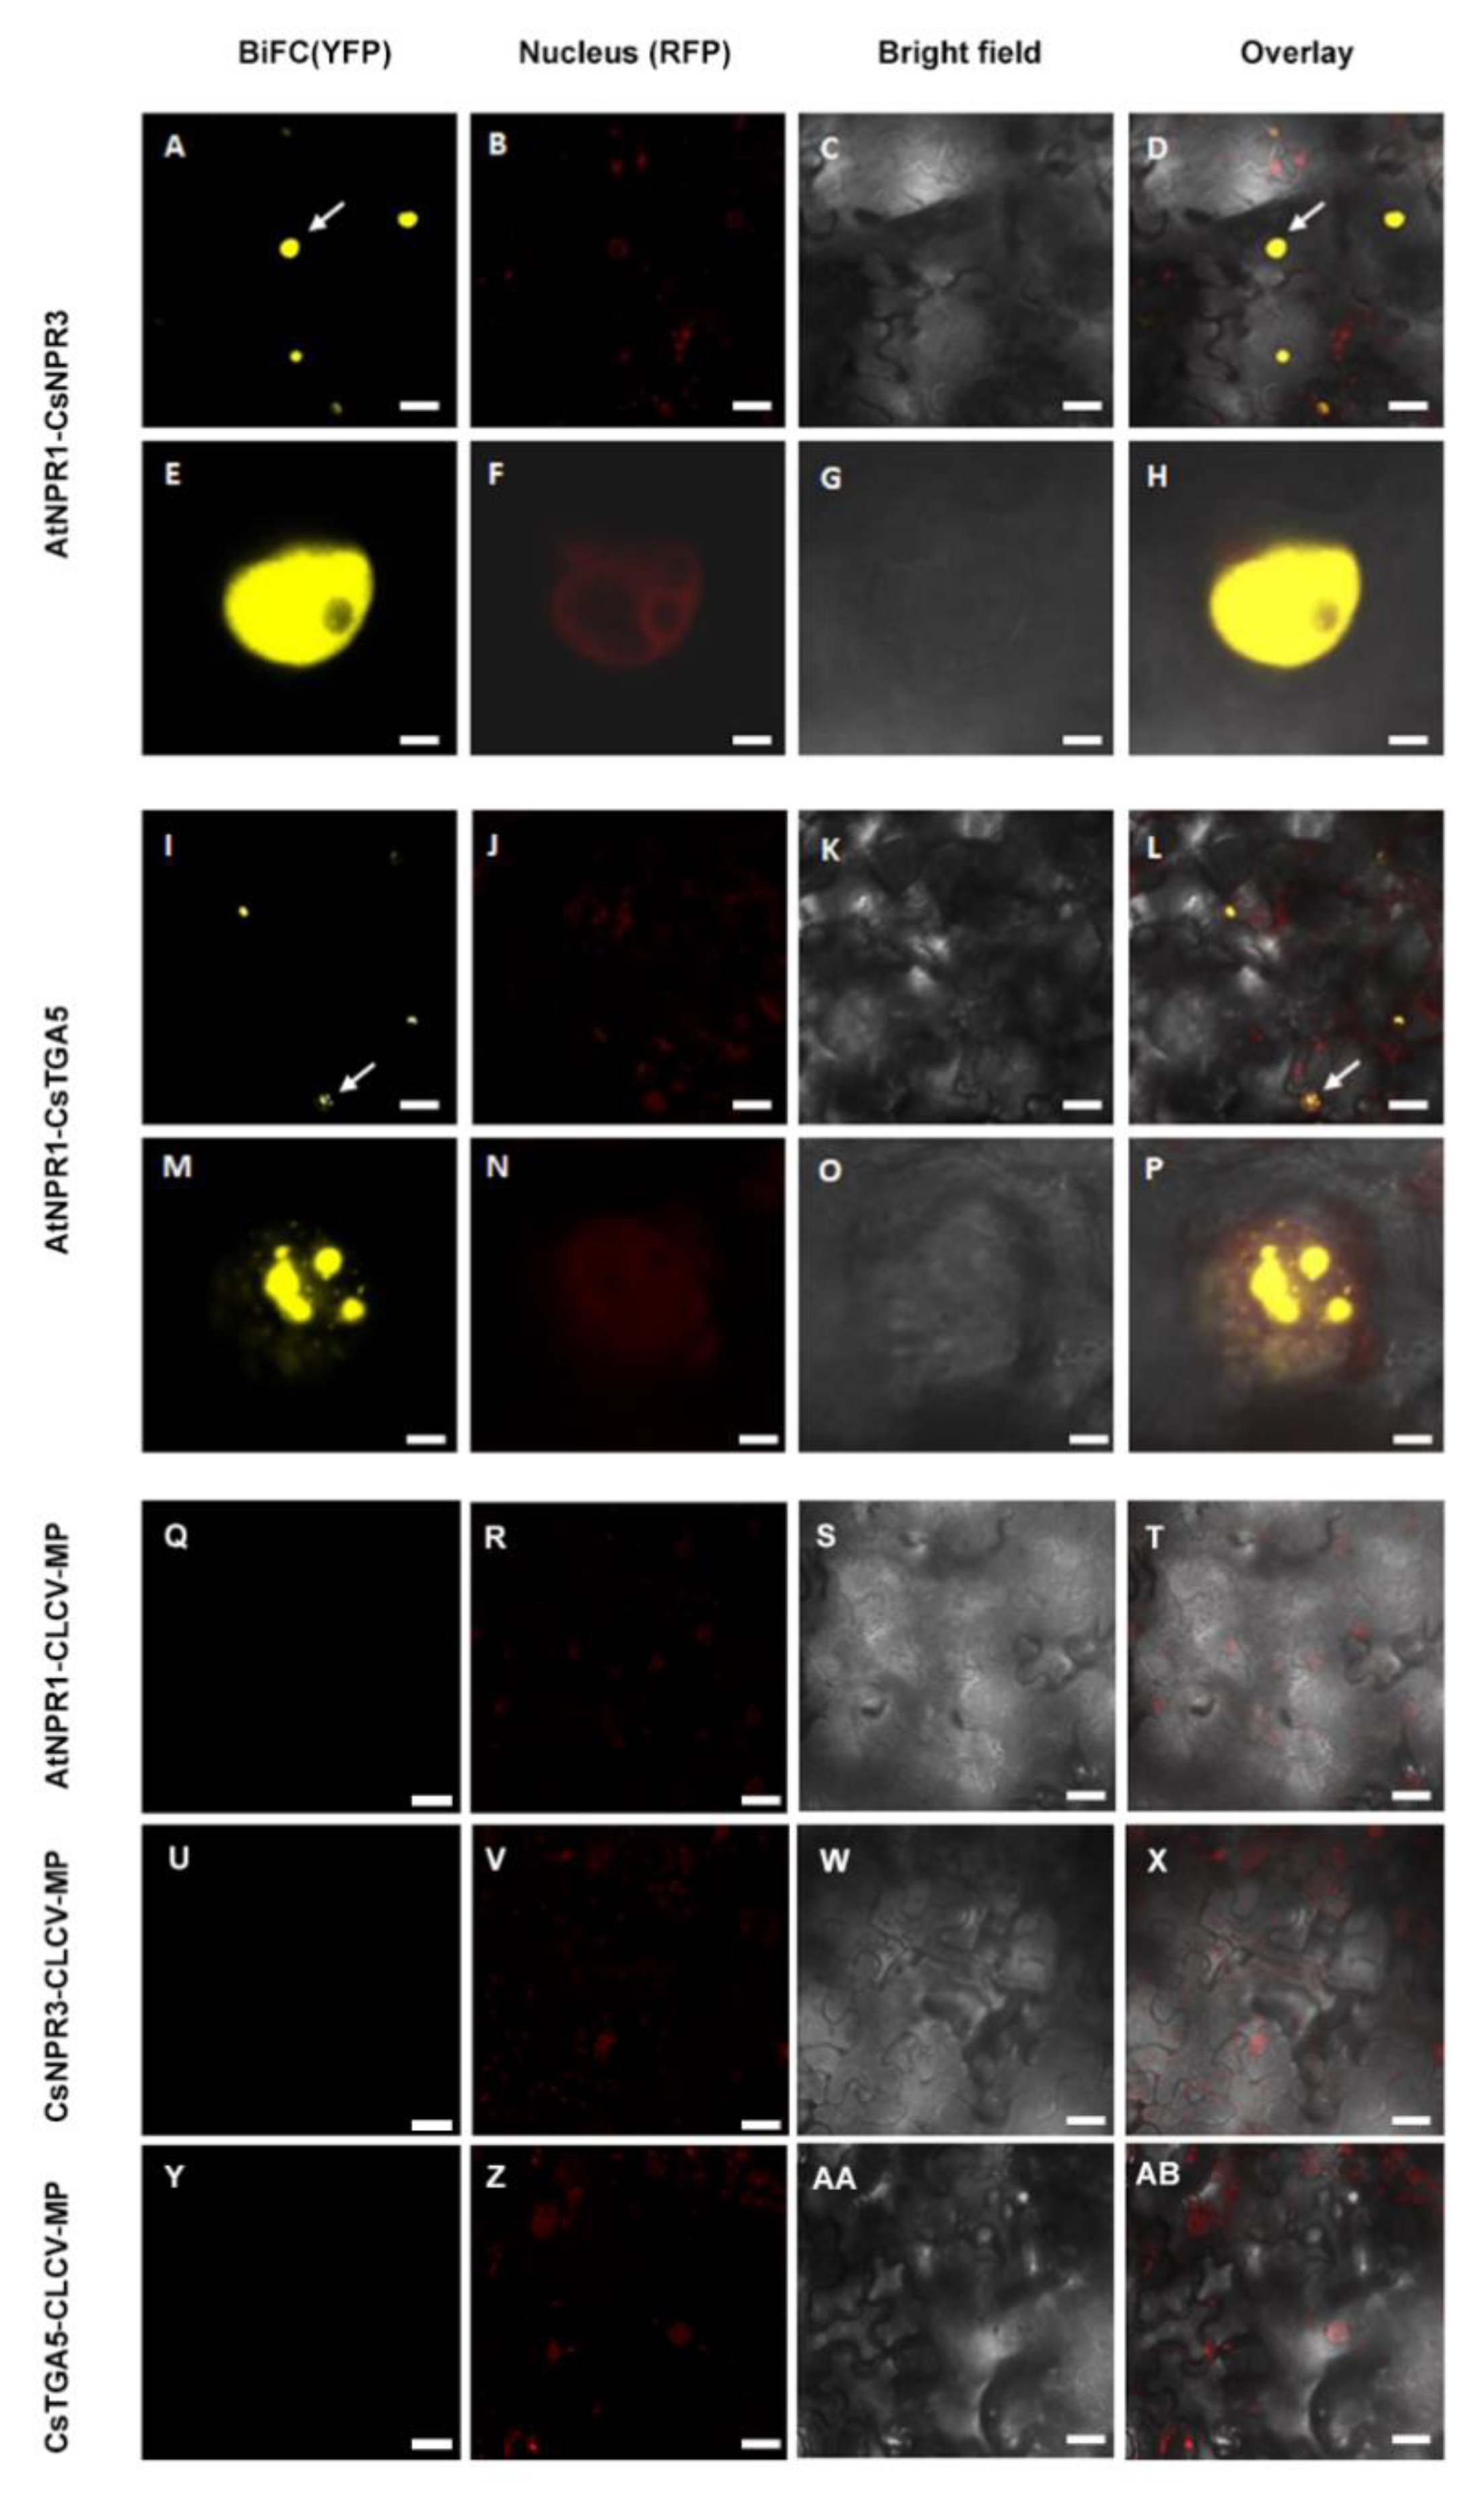
2.3. AtNPR1 Interacts with Citrus Homolog Proteins

The upregulation of several ankyrin repeat-containing proteins and defense related genes in the NPR1-2 transgenic line as observed in our RNAseq data prompted us to investigate whether AtNPR1 could interact with citrus homolog proteins. As we are focusing on the NPR1-dependent SA signaling pathway, we chose components of the pathway already known from Arabidopsis model plant research such as the NPR3 and TGA5. The citrus CsNPR3 homolog protein share 60% of similarity with the ankyrin-repeat domain proteins induced in our RNA-seq. The AtTGA transcription factors interact with AtNPR1 in the nucleus to physically bind to the PR1 promoter [32].
In this analysis, AtNPR1 was used as prey and CsNPR3 and CsTGA5 were used as baits. We detected positive interactions between the AtNPR1 protein and both citrus homologs using yeast two-hybrid system (Y2H) assays (Figure 6).
To confirm the positive interactions, bimolecular fluorescence complementation assays (BiFC) were performed, and similar to the Y2H assay, AtNPR1 was observed to be capable of interacting with both the CsNPR3 and CsTGA5 proteins. The yellow fluorescence indicating a positive interaction, was observed to have nuclear localization (Figure 7).

3. Discussion

To our knowledge, this study is the first report on the transcriptional analysis of a citrus transgenic plant that shows tolerance to HLB. Transcriptomic, proteomic, and metabolomic analyses were performed to further examine citrus genomics, from which candidate genes/proteins/metabolites were identified; however, the majority of previous studies compared samples infected with CLas to those without infection, or compared tolerant and susceptible citrus cultivars [33,34,35,36,37,38,39].

3.1. The Transcriptional Change in NPR1-2 Transgenic Line

Among the DEGs identified in this study, three isoforms of CYCLIC NUCLEOTIDE-GATED ION CHANNEL (CNGC) were upregulated in the NPR1-2 transgenic line. CNGCs are ion channels regulated by cytosolic signaling molecules (i.e., cyclic nucleotides, calmodulin, and Ca2+). Upon mechanical wounding or insect injury, a quick increase in Ca2+ influx takes place, activating Ca2+/CaM-dependent phosphorylation, resulting in a rapid burst of jasmonic acid (JA) and the activation of plant defense against herbivory [40]. In Arabidopsis, AtCNGC1 partly contributes to Ca2+ uptake into plants (along with other channels), affecting the primary root growth of seedlings [41]. AtCNGC2 and AtCNGC4 are essential for the activation of PAMP-triggered immunity upon pathogen infection of Arabidopsis plants [13]. Together, these proteins are assembled into a functional calcium channel, which becomes phosphorylated and activated by the effector kinase BOTRYTIS-INDUCED KINASE1 (BIK1) of the pattern-recognition receptor complex [42]. AtCNGC11 and AtCNGC12 induce a hypersensitive response (HR) and act as positive mediators of multiple pathogen resistant responses involved in SA signaling pathways and PR protein accumulation [43,44].
Other genes upregulated in the transgenic line were the LRR RECEPTOR-LIKE SERINE/THREONINE-PROTEIN KINASE and WALL-ASSOCIATED RECEPTOR KINASE-LIKE. The receptor-like kinases (RLKs) are plant extracellular receptors involved in pathogen recognition and the subsequent activation of plant defense responses [45,46]. The Arabidopsis LRR RECEPTOR-LIKE PROTEIN KINASES modulates brassinosteroid, abscisic acid, SA, and Ca2+ signaling, and positively regulates diverse responses against stresses such as pathogen infection, cold, salt, and aphid attacks [47,48]. In maize, a WALL-ASSOCIATED RECEPTOR-LIKE KINASE was found to confer quantitative field resistance against most Northern corn leaf blights [46].
MYB4, NAC68, WRKY70, and WRKY51 are the TFs found upregulated in NPR1-2. The WRKY family of TFs are exclusively found in plants and play an essential role in plant signaling, modulating several plant responses to biotic and abiotic stimuli. Both of the WRKY TFs upregulated in NPR1-2, namely, WRKY70 and WRKY51, are known to be involved in the cross-talk between the SA and the jasmonic acid (JA)/ethylene (ET) signaling pathways, and can regulate plant defense either positively or negatively [49,50,51]. WRKY70 activation of genes related to the SA signaling pathway and the simultaneous repression of JA pathway responses is partly coordinated by NPR1-dependent mechanisms; as such, WRKY70 is capable of fine tuning SA- and JA-dependent defenses [51]. Similarly, WRKY51 is also involved with repression of the JA signaling pathway; however, this repression is mediated by the reduction of oleic acid (18:1) levels. In Arabidopsis, an upregulation of SA-mediated responses is induced in low-18:1 background, leading to an increase in resistance to biotrophic but not to necrotrophic pathogens [50].
Previously, we demonstrated an induction of WRKY70 in the transgenic lines ectopically expressing AtNPR1 transgene either under the constitutive 35S promoter or the phloem-specific AtSUC2 promoter, which correlated with our RNAseq findings and the notion that NPR1 modulates WRKY70 to trigger plant defense [31]. Thus, it is reasonable to assume that an increase in expression of the DEGs, CNGCs, receptor-like kinases, and the plant defense response TFs could contribute to the enhancement of tolerance to HLB in NPR1-2 transgenic plants.

3.2. AtNPR1 Interacted with NPR Orthologs Proteins

The NPR1-dependent pathway involves activation through a complex signaling network and requires an accumulation of the SA phytohormone and different protein–protein interactions. The Arabidopsis isoforms of NPR, NPR1, NPR3/4, and TGA TFs need to interact before defense can be triggered [18,52,53]. Interestingly, AtNPR1 was found to be capable of interacting with the citrus isoforms of NPR3 and TGA5; therefore, the AtNPR1 transgene in the NPR1-2 line may be recruiting the citrus NPR orthologs to regulate the innate defense mechanisms against HLB.
AtNPR1 overexpressing transgenic trees showed enhanced transcription of genes encoding for pathogen-associated molecular patterns (PAMP), transcription factors, leucine-rich repeat receptor kinases (LRR-RKs), and putative ankyrin repeat-containing proteins. Furthermore, analysis of protein–protein interactions demonstrated that AtNPR1 could interact with CsNPR3 and CsTGA5 in the nucleus indicating that the involvement of AtNPR1 transgene in the citrus SA-pathway could possibly regulate innate defense mechanisms boosting resistance and protecting the plant against HLB.

4. Materials and Methods

4.1. Plant Materials

‘Valencia’ (Citrus sinensis Osbeck) sweet orange lines overexpressing the Arabidopsis thaliana NPR1 (AtNPR1; AT1G64280) cDNA under the control of a constitutive CaMV 35S promoter have been previously identified [31]. A selected transgenic and non-transgenic line were clonally propagated onto Carrizo citrange (Citrus sinensis (L.) Osbeck × Poncirus trifoliata (L.) Raf.) rootstock. Leaf samples from one-year-old trees maintained in greenhouse located at the University of Florida’s Citrus Research and Education Center (Lake Alfred, FL, USA) were used for RNA extraction.

4.2. RNA Extraction and cDNA Synthesis

RNA was extracted using TRIzol® [54], following the manufacturer’s protocol. RNA concentration was determined using a NanoDrop™ 1000 Spectrophotometer (Thermo Fisher Scientific, Franklin, MA, USA). The purity and integrity of the RNA were analyzed using electrophoresis on a 1.0% agarose gel, and then examined using the Agilent 2100 Bioanalyzer (Agilent Technologies, Santa Clara, CA, USA). High quality RNA samples with RNA integrity number (RIN) value > 6.5 were used for cDNA synthesis and RNA-sequencing. Single-strand cDNA was synthesized using the RevertAid First Strand cDNA Synthesis Kit (Thermo Fisher Scientific, Franklin, MA, USA).

4.3. RNAseq Libraries Construction and Sequencing

Approximately 3 μg of RNA was used for sequencing library construction using the NEBNext® Ultra™ RNA Library Prep Kit for Illumina® (New England Biolabs, Ipswich, MA, USA) following the manufacturer’s instructions. Briefly, mRNA was enriched using oligo (dT) beads and then fragmented randomly, after which first-strand cDNA was synthesized using random hexamers and M-MuLV reverse transcriptase. Second strand cDNA synthesis was subsequently performed using DNA Polymerase I and RNase H. After adenylation of the 3′ ends of DNA fragments, NEBNext® adaptors were ligated to prepare for hybridization. cDNA fragments of 150-200 bp in length were purified using the AMPure XP system (Beckman Coulter, Brea, CA, USA). Afterwards, 3μL USER Enzyme (New England Biolabs, Ipswich, MA, USA) was added to size-selected, adaptor-ligated cDNA, and was incubated at 37 °C for 15 min, followed by 5 min at 95 °C to facilitate hybridization. PCR was performed using Phusion High-Fidelity DNA polymerase (New England Biolabs, Ipswich, MA, USA), the products were purified using the AMPure XP purification system (Beckman Coulter, Brea, CA, USA), and library quality was assessed on the Agilent 2100 Bioanalyzer. The library was sequenced using an Illumina® HiSeq 2000 platform, and 125 bp/150 bp paired-end reads were generated. Library construction and sequencing were performed by Novogene Corporation (Novogene, Sacramento, CA, USA). For each line, three technical replicates were created. The raw data was deposited into the National Center for Biotechnology Information Sequence Read Archive (https://www.ncbi.nlm.nih.gov/sra, accessed on 11/2/2020) with a SRA accession number: PRJNA602381.

4.4. Data Mapping and Differentially Expressed Genes Identification

Raw reads that were in FASTQ format were firstly processed using in-house Perl scripts. Clean reads were obtained by removing reads containing adapters or reads of low quality; these clean reads were used for downstream analyses. TopHat (v2.0.12) software (Johns Hopkins University, Baltimore, MD, USA) was chosen to map the clean reads to the sweet orange genome (http://citrus.hzau.edu.cn/orange/, accessed on 27/2/2017), with mismatch parameter set to two and other parameters set to default. Gene expression level was calculated by counting the reads that map to genes or exons. The FPKM (Fragments Per Kilobase of transcript sequence per Millions base pairs sequenced) value was used to normalize the read counts to estimate gene expression levels, as this takes into account the effects of both sequencing depth and gene length on the counting of fragments. In this study, the final FPKM was calculated as the mean value of the three technical replicates. DESeq software was used to analyze the differentially expressed genes (DEGs) using a negative binomial distribution p-value estimation model, with the differentially expressed gene screening standard set to padj < 0.05 [55]. To annotate the DEGs, BLASTx alignment (E-value < 10-5) was performed based on the UniProtKB/Swiss-Prot database (https://www.uniprot.org/blast/, accessed on 27/2/2017).

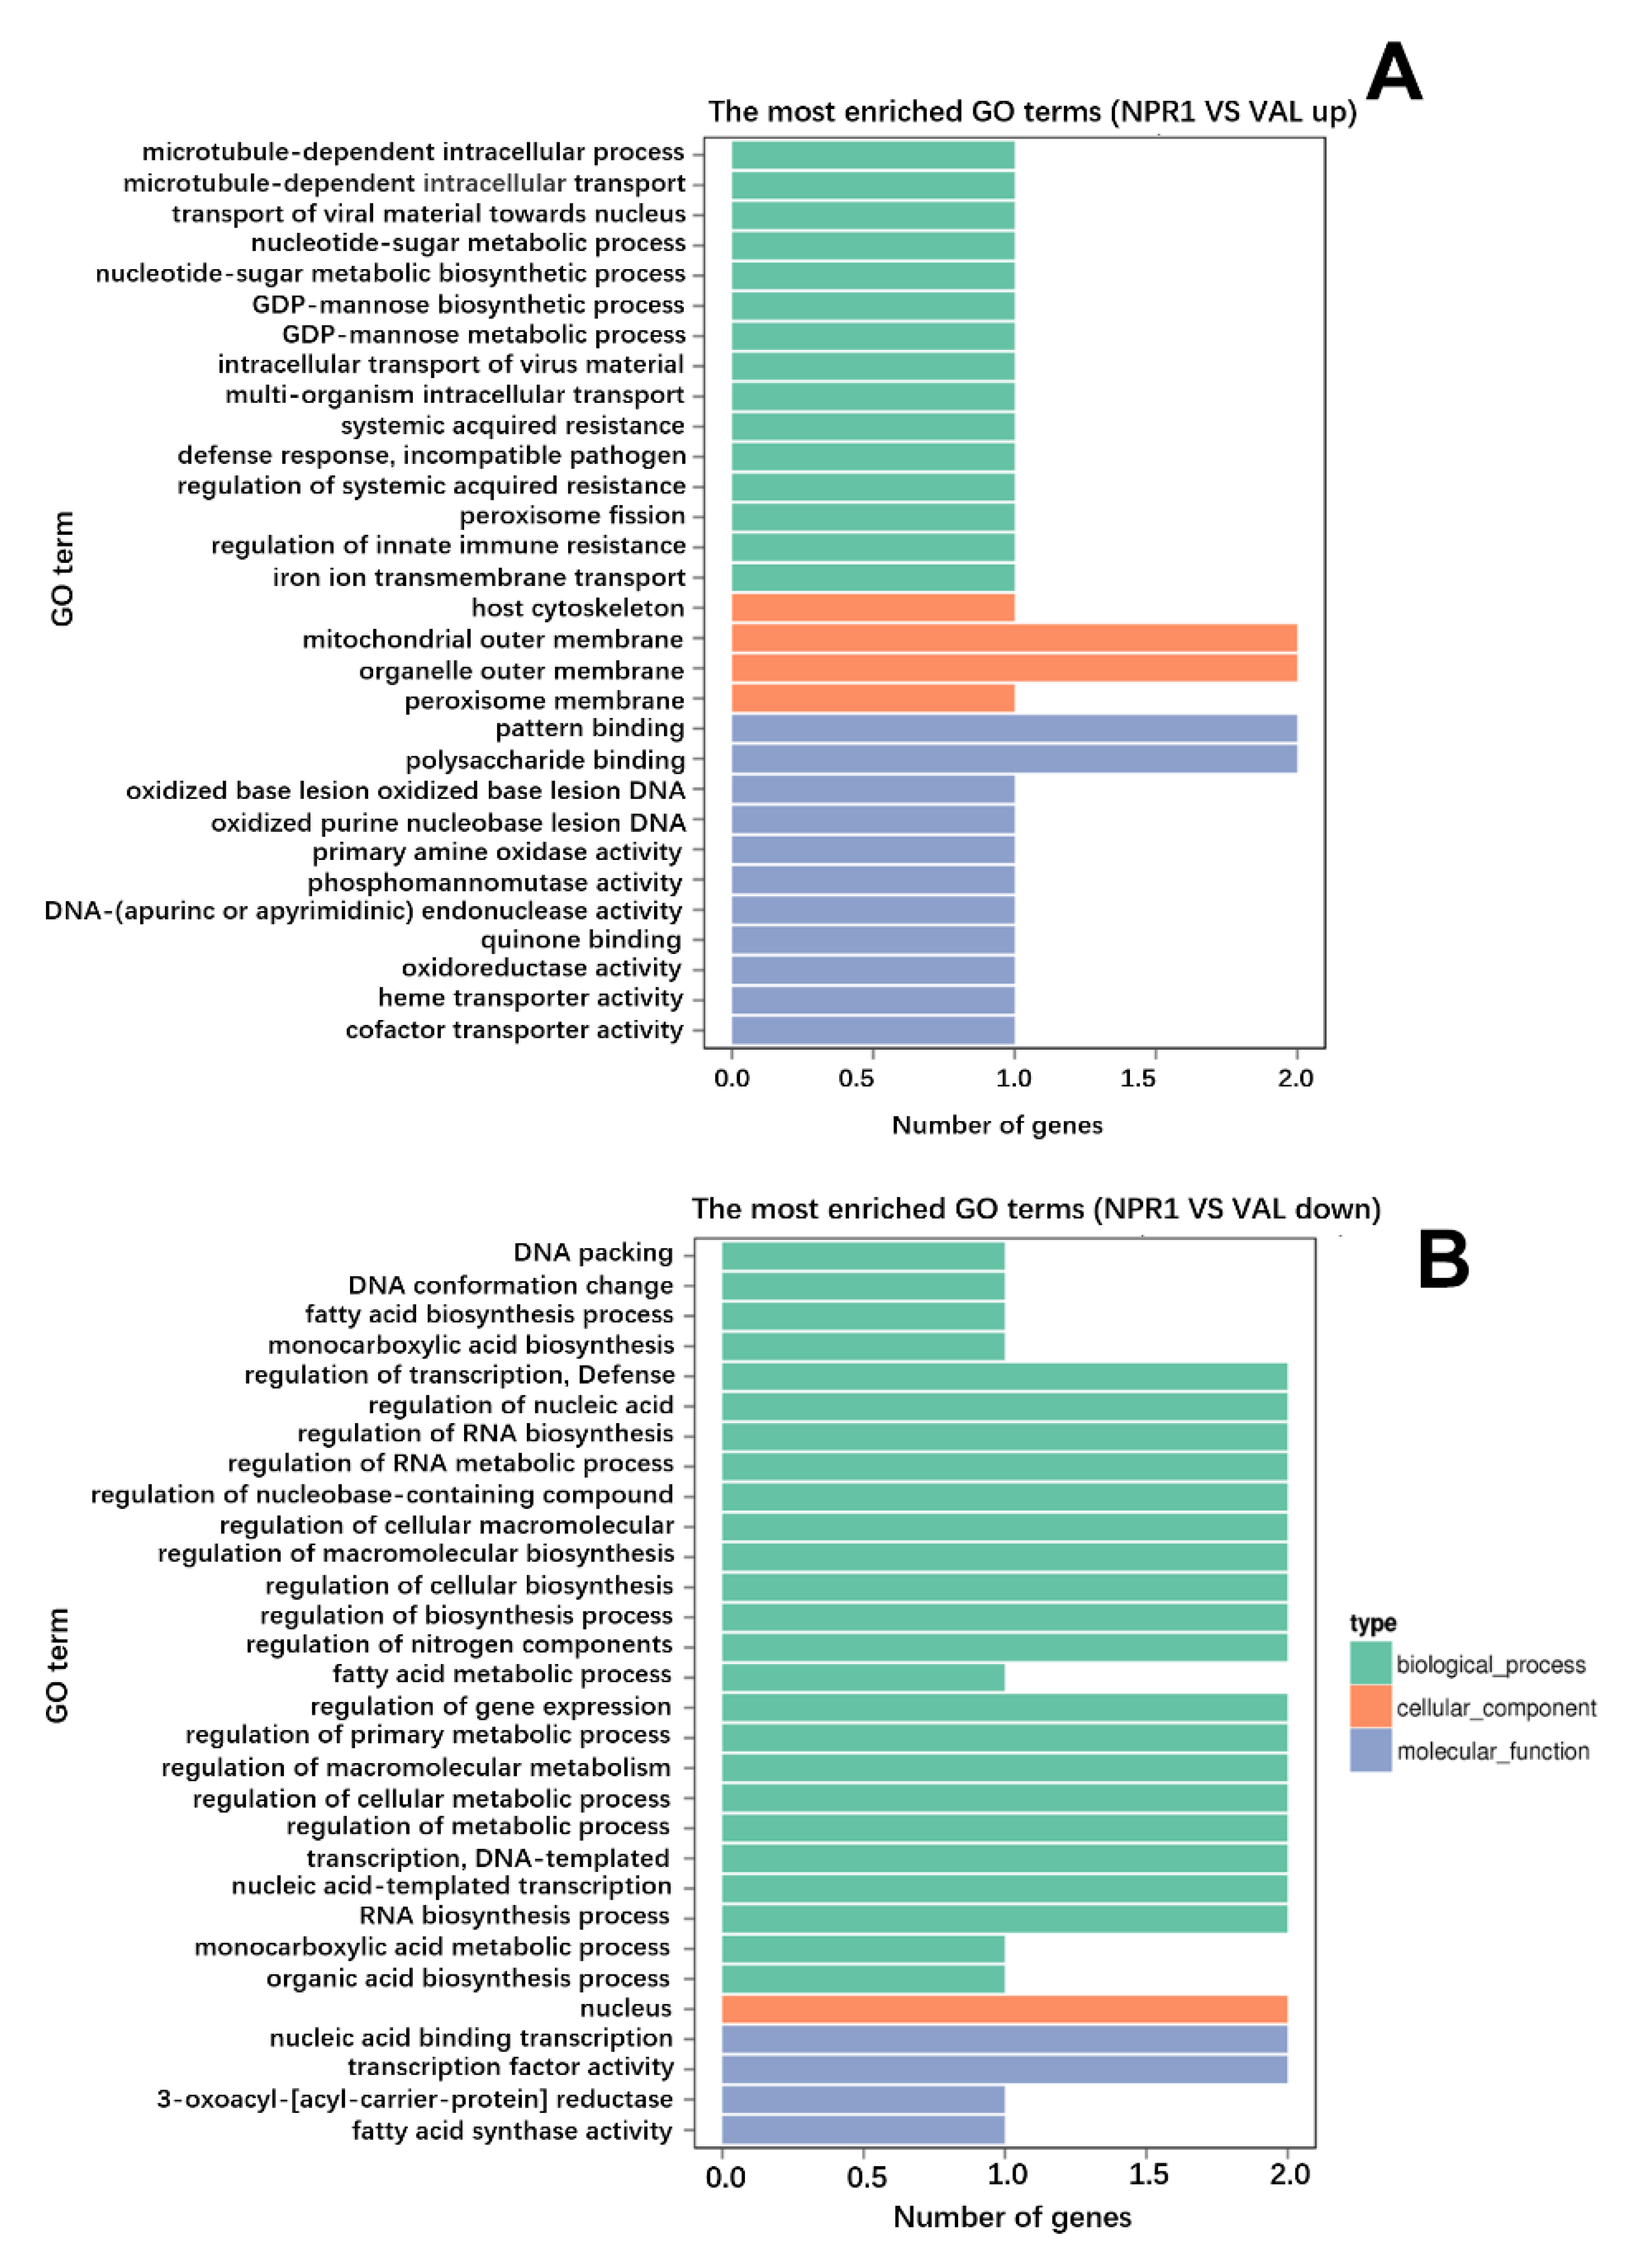
4.5. GO and KEGG Pathway Analysis

Gene Ontology (GO) enrichment analysis was performed using GOseq. A GO enrichment bar chart was used to illustrate the DEG-enriched GO terms as well as the DEG counts for each GO term. Overrepresented p-values in the hypergenometric test were used to identify significantly enriched GO terms with corrected p-values < 0.05 [56]. The Kyoto Encyclopedia of Genes and Genomes (KEGG) pathway enrichment analysis was used to identify significantly enriched metabolic pathways or signal transduction pathways associated with DEGs when compared to the whole genome background. A scatter diagram was used to display KEGG enrichment analysis results. The KEGG enrichment degree was measured based on the rich factor, Q value, and gene counts enriched in this pathway. Pathways with corrected p-values < 0.05 were determined to be significantly enriched in DEGs. As the number of enriched pathways counts was less than 20, all of them were plotted.

4.6. Quantitative Real-Time RT-PCR (qRT-PCR) Analysis

Selected gene-specific primers (Supplementary Table S1) were designed using the online real-time PCR tool provided by Integrated DNA Technologies, Inc (Integrated DNA Technologies, Coralville, IA, USA; https://www.idtdna.com, accessed on 26/9/2018). The final volume of reaction mixture containing 1× PowerUp™ SYBR® Green Master Mix (Thermo Fisher Scientific, Franklin, MA, USA), 50 ng cDNA, and 500 nM forward and reverse primers were 10 µL, and three replicates for each reaction were prepared. qRT-PCR was performed in a StepOnePlus™ Real-Time PCR System (Thermo Fisher Scientific, Franklin, MA, USA). Cycling conditions were set as follows: 95 °C denaturation for 15 s, followed by 40 cycles of 95 °C denaturation for 15 s and 60 °C annealing and extension for 1 min. To test for PCR specificity, the melting curve was generated by gradually increasing the temperature to 95 °C. The citrus β-actin housekeeping gene was used as the reference gene [57]. Relative gene expression was calculated using the 2-ΔΔCt method described previously [58].

4.7. Vector Construction Using Gateway Technology

Q5® High-Fidelity 2× Master Mix (New England Biolabs, Ipswich, MA, USA) was used for all gene amplification reactions. The primers used and gene accession numbers are listed in Supplementary Tables S2 and S3. PCR products were purified using the QIAquick Gel Extraction Kit (QIAGEN, Germantown, MD, USA) and cloned into the Gateway pDONR211 entry clone using the BP recombination reaction (Thermo Fisher Scientific, Franklin, MA, USA). Clones were transformed into competent DH5α E. coli cells using the heat-shock method. After validation through Sanger sequencing, the correct clones were recombined into pSITE-c/nYFP-C1/N1 destination vectors using Gateway® LR Clonase® II enzyme mix (Thermo Fisher Scientific, Franklin, MA, USA) according to the manufacturer’s protocol. Positive colonies were selected using LB plates supplemented with spectinomycin; these were confirmed to have the plasmid through PCR, and plasmid DNA was extracted using the GeneJET Plasmid Miniprep Kit (Thermo Fisher Scientific, Franklin, MA, USA). The destination clones were introduced into Agrobacterium tumefaciens strain EHA105 by freeze-thaw method [59]. Positive EHA105 clones were validated by PCR.

4.8. Bimolecular Fluorescence Complementation Assays

Bimolecular fluorescence complementation (BiFC) assays using a split YFP system were conducted according to previously described protocol [60]. Vectors were generated with Gateway technology as described above. As negative control, Cabbage leaf curl virus (CLCV) movement protein (CLCV-MP) were used. All of the BiFC assays were performed in Nicotiana benthamiana transgenic plants that constitutively express RFP fused to histone 2B (N. benthamiana RFP-H2B), generated by Martin, et al. [61]. The CLCV-MP constructs and N. benthamiana RFP-H2B seeds were kindly donated by Dr. Amit Levy. Transient expression of fusion proteins in N. benthamiana was performed according the methods described by Sparkes et al. [62] with minor modifications. A single colony of Agrobacterium strain EHA105 containing each destination clone was grown in Luria–Bertani broth containing rifampicin (50 mg/L) and spectinomycin (100 mg/L) incubated at 28 °C overnight. The culture was centrifuged and re-suspended in infiltration buffer (10 mM 2-(N-morpholino) ethanesulfonic acid (MES), pH 5.85; 10 mM MgCl2) containing 200 µm acetosyringone. The infiltration buffer was kept at room temperature for 3–4 h and infiltrated into the leaves using a 1 mL needleless syringe. The plants were evaluated and photographed 3 days after infiltration using a confocal microscope (Leica Microsystems Inc., Buffalo Grove, IL, USA).

4.9. Yeast Two-Hybrid Assays

Yeast vectors pGBKT7 (GAL4 DNA-binding domain, BD), pGADT7 (GAL4 activation domain, AD), and the yeast strain Y2HGold (Clontech, Mountain View, CA, USA) were used in the yeast two-hybrid assays. To test the interaction between AtNPR1 and the candidate target proteins (CsNPR3 and CsTGA5), cDNA sequences of AtNPR1 were cloned into the pGBKT7 vector in-frame with the GAL4 DNA-binding domain (BD). The cDNA sequences of target proteins were cloned into the pGADT7 vector in-frame with the GAL4 DNA-activating domain (AD). Co-transformation of BD and AD vectors in Y2HGold was performed to confirm the interaction. Empty BD and AD vectors were used as negative controls. Additionally, standard positive controls (pGBKT7-53 and pGADT7-T; Clontech) and standard negative controls (pGBKT7-Lam and pGADT7-T) were included. Yeast transformants were plated on double dropout medium (DDO) with -Trp and -Leu and were screened on quadruple dropout medium (QDO) with -Trp, -Leu, -Ade, and -His supplemented with X-α-Gal and aureobasidin A (QDO/X/A). QDO/X/A was supplemented with 100 µM SA (Sigma Aldrich, Saint Louis, MO, USA).

Supplementary Materials

Supplementary materials can be found at https://www.mdpi.com/1422-0067/21/6/2009/s1.

Author Contributions

W.Q. and M.D. conceived the research and designed the experiments, W.Q., J.S., and M.D. wrote the manuscript. W.Q. analyzed the RNAseq data, J.S. and W.Q. conducted the bimolecular fluorescence complementation assays, Z.P. and Y.H. conducted the yeast two-hybrid assays, Z.S., N.W., and J.G. revised the manuscript, and provided the work platform. All authors read and approved the final manuscript.

Acknowledgments

We would like to thank Amit. Levy for providing the N. benthamiana RFP-H2B seeds and the CLCV-MP constructs and F.N.C. Vasconcelos for helpful discussion about the protein interaction assays. This work was supported by University of Florida’s Institute of Food and Agricultural Sciences (UF/IFAS) Citrus Initiative and National Key R&D Program of China (2018YFD1000300).

Conflicts of Interest

The authors declare that they have no conflict of interest.

References

  1. Duan, Y.; Zhou, L.; Hall, D.G.; Li, W.; Doddapaneni, H.; Lin, H.; Liu, L.; Vahling, C.M.; Gabriel, D.W.; Williams, K.P.; et al. Complete genome sequence of citrus Huanglongbing bacterium, ‘Candidatus Liberibacter Asiaticus’ obtained through Metagenomics. Mol. Plant Microbe Interact. 2009, 22, 1011–1020. [Google Scholar] [CrossRef] [PubMed] [Green Version]
  2. Shi, Q.; Pitino, M.; Zhang, S.; Krystel, J.; Cano, L.M.; Shatters, R.G.; Hall, D.G.; Stover, E. Temporal and spatial detection of Candidatus Liberibacter asiaticus putative effector transcripts during interaction with Huanglongbing-susceptible, −tolerant, and -resistant citrus hosts. BMC Plant Biol. 2019, 19, 122. [Google Scholar] [CrossRef] [PubMed] [Green Version]
  3. Qureshi, J.A.; Kostyk, B.C.; Stansly, P.A. Insecticidal suppression of Asian citrus Psyllid Diaphorina citri (Hemiptera: Liviidae) vector of Huanglongbing pathogens. PLoS ONE 2014, 9, e112331. [Google Scholar] [CrossRef] [PubMed] [Green Version]
  4. Wang, N. The citrus Huanglongbing crisis and potential solutions. Mol. Plant 2019, 12, 607–609. [Google Scholar] [CrossRef]
  5. Zhang, M.; Guo, Y.; Powell, C.A.; Doud, M.S.; Yang, C.; Duan, Y. Effective antibiotics against ‘Candidatus Liberibacter asiaticus’ in HLB-affected citrus plants identified via the graft-based evaluation. PLoS ONE 2014, 9, e111032. [Google Scholar] [CrossRef] [Green Version]
  6. Young, M.; Ozcan, A.; Myers, M.E.; Johnson, E.G.; Graham, J.H.; Santra, S. Multimodal generally recognized as safe ZnO/nanocopper composite: A novel antimicrobial material for the management of citrus phytopathogens. J. Agric. Food Chem. 2017, 66, 6604–6608. [Google Scholar] [CrossRef]
  7. Hoffman, M.T.; Doud, M.S.; Williams, L.; Zhang, M.-Q.; Ding, F.; Stover, E.; Hall, D.; Zhang, S.; Jones, L.; Gooch, M. Heat treatment eliminates ‘Candidatus Liberibacter asiaticus’ from infected citrus trees under controlled conditions. Phytopathology 2013, 103, 15–22. [Google Scholar] [CrossRef] [Green Version]
  8. Hu, J.; Jiang, J.; Wang, N. Control of citrus Huanglongbing via trunk injection of plant defense activators and antibiotics. Phytopathology 2017, 108, 186–195. [Google Scholar] [CrossRef] [Green Version]
  9. Li, J.; Trivedi, P.; Wang, N. Field evaluation of plant defense inducers for the control of citrus huanglongbing. Phytopathology 2015, 106, 37–46. [Google Scholar] [CrossRef]
  10. Stansly, P.A.; Arevalo, H.A.; Qureshi, J.A.; Jones, M.M.; Hendricks, K.; Roberts, P.D.; Roka, F.M. Vector control and foliar nutrition to maintain economic sustainability of bearing citrus in Florida groves affected by huanglongbing. Pest Manag. Sci. 2014, 70, 415–426. [Google Scholar] [CrossRef]
  11. Dong, X. NPR1, all things considered. Curr. Opin. Plant Biol. 2004, 7, 547–552. [Google Scholar] [CrossRef] [PubMed]
  12. Pieterse, C.M.J.; Van Loon, L.C. NPR1: The spider in the web of induced resistance signaling pathways. Curr. Opin. Plant Biol. 2004, 7, 456–464. [Google Scholar] [CrossRef] [PubMed] [Green Version]
  13. Köhler, C.; Merkle, T.; Roby, D.; Neuhaus, G. Developmentally regulated expression of a cyclic nucleotide-gated ion channel from Arabidopsis indicates its involvement in programmed cell death. Planta 2001, 213, 327–332. [Google Scholar] [CrossRef]
  14. Cao, H.; Bowling, S.A.; Gordon, A.S.; Dong, X. Characterization of an arabidopsis mutant that is nonresponsive to inducers of systemic acquired resistance. Plant Cell 1994, 6, 1583–1592. [Google Scholar] [CrossRef] [PubMed]
  15. Delaney, T.; Friedrich, L.; Ryals, J. Arabidopsis signal transduction mutant defective in chemically and biologically induced disease resistance. Proc. Natl. Acad. Sci. USA 1995, 92, 6602–6606. [Google Scholar] [CrossRef] [PubMed] [Green Version]
  16. Mou, Z.; Fan, W.; Dong, X. Inducers of plant systemic acquired resistance regulate NPR1 function through redox changes. Cell 2003, 113, 935–944. [Google Scholar] [CrossRef] [Green Version]
  17. Zhang, Y.; Tessaro, M.J.; Lassner, M.; Li, X. Knockout analysis of Arabidopsis transcription factors TGA2, TGA5, and TGA6 reveals their redundant and essential roles in systemic acquired resistance. Plant Cell 2003, 15, 2647–2653. [Google Scholar] [CrossRef] [Green Version]
  18. Ding, Y.; Sun, T.; Ao, K.; Peng, Y.; Zhang, Y.; Li, X.; Zhang, Y. Opposite roles of salicylic acid receptors NPR1 and NPR3/NPR4 in transcriptional regulation of plant immunity. Cell 2018, 173, 1454–1467.e15. [Google Scholar] [CrossRef]
  19. Zhang, Y.; Cheng, Y.T.; Qu, N.; Zhao, Q.; Bi, D.; Li, X. Negative regulation of defense responses in Arabidopsis by two NPR1 paralogs. Plant J. 2006, 48, 647–656. [Google Scholar] [CrossRef]
  20. Fitzgerald, H.A.; Chern, M.S.; Navarre, R.; Ronald, P.C. Overexpression of (At)NPR1 in rice leads to a BTH- and environment-induced lesion-mimic/cell death phenotype. Mol. Plant Microbe Interact. 2004, 17, 140–151. [Google Scholar] [CrossRef] [Green Version]
  21. Molla, K.A.; Karmakar, S.; Chanda, P.K.; Sarkar, S.N.; Datta, S.K.; Datta, K. Tissue-specific expression of Arabidopsis NPR1 gene in rice for sheath blight resistance without compromising phenotypic cost. Plant Sci. 2016, 250, 105–114. [Google Scholar] [CrossRef] [PubMed]
  22. Makandar, R.; Essig, J.S.; Schapaugh, M.A.; Trick, H.N.; Shah, J. Genetically engineered resistance to Fusarium head blight in wheat by expression of Arabidopsis NPR1. Mol. Plant Microbe Interact. 2006, 19, 123–129. [Google Scholar] [CrossRef] [Green Version]
  23. Li, B.; Gao, R.; Cui, R.; Lü, B.; Li, X.; Zhao, Y.; You, Z.; Tian, S.; Dong, H. Tobacco TTG2 suppresses resistance to pathogens by sequestering NPR1 from the nucleus. J. Cell Sci. 2012, 125, 4913–4922. [Google Scholar] [CrossRef] [PubMed] [Green Version]
  24. Zhang, C.; Gao, H.; Li, R.; Han, D.; Wang, L.; Wu, J.; Xu, P.; Zhang, S. GmBTB/POZ, a novel BTB/POZ domain-containing nuclear protein, positively regulates the response of soybean to Phytophthora sojae infection. Mol. Plant Pathol. 2019, 20, 78–91. [Google Scholar] [CrossRef] [PubMed] [Green Version]
  25. Zhang, F.; Zhang, L.; Li, L.; Chen, M.; Shi, P.; Shen, Q.; Yan, T.; Hao, X.; Fu, X.; Ma, Y.; et al. Interaction of AaTGA6 with salicylic acid signaling modulates Artemisinin biosynthesis in Artemisia Annua. J. Exp. Bot. 2019, 70, 3969–3979. [Google Scholar] [CrossRef] [Green Version]
  26. Babourina, O.; Rengel, Z.; Jayakannan, M.; Bose, J.; Shabala, S.; Poschenrieder, C.; Massart, A. The NPR1-dependent salicylic acid signalling pathway is pivotal for enhanced salt and oxidative stress tolerance in Arabidopsis. J. Exp. Bot. 2015, 66, 1865–1875. [Google Scholar] [CrossRef] [Green Version]
  27. La, V.H.; Lee, B.R.; Islam, M.T.; Park, S.-H.; Jung, H.I.; Bae, D.W.; Kim, T.H. Characterization of salicylic acid-mediated modulation of the drought stress responses: Reactive oxygen species, proline, and redox state in Brassica napus. Environ. Exp. Bot. 2019, 157, 1–10. [Google Scholar] [CrossRef]
  28. Olate, E.; Jiménez-Gómez, J.M.; Holuigue, L.; Salinas, J. NPR1 mediates a novel regulatory pathway in cold acclimation by interacting with HSFA1 factors. Nat. Plants 2018, 4, 811–823. [Google Scholar] [CrossRef]
  29. Silva, K.J.P.; Mahna, N.; Mou, Z.; Folta, K.M. NPR1 as a transgenic crop protection strategy in horticultural species. Hortic. Res. 2018, 5, 15. [Google Scholar] [CrossRef] [Green Version]
  30. Zhang, X.; Francis, M.I.; Dawson, W.O.; Graham, J.H.; Orbović, V.; Triplett, E.W.; Mou, Z. Over-expression of the Arabidopsis NPR1 gene in citrus increases resistance to citrus canker. Eur. J. Plant Pathol. 2010, 128, 91–100. [Google Scholar] [CrossRef]
  31. Dutt, M.; Barthe, G.; Irey, M.; Grosser, J. Transgenic citrus expressing an Arabidopsis NPR1 gene exhibit enhanced resistance against Huanglongbing (HLB; Citrus Greening). PLoS ONE 2015, 10, e0137134. [Google Scholar] [CrossRef] [PubMed]
  32. Pajerowska-Mukhtar, K.M.; Emerine, D.K.; Mukhtar, M.S. Tell me more: Roles of NPRs in plant immunity. Trends Plant Sci. 2013, 18, 402–411. [Google Scholar] [CrossRef] [PubMed]
  33. Zheng, Z.L.; Zhao, Y. Transcriptome comparison and gene coexpression network analysis provide a systems view of citrus response to ‘Candidatus Liberibacter asiaticus’ infection. BMC Genom. 2013, 14, 27. [Google Scholar] [CrossRef] [PubMed] [Green Version]
  34. Zhong, Y.; Cheng, C.Z.; Jiang, N.H.; Jiang, B.; Zhang, Y.Y.; Wu, B.; Hu, M.L.; Zeng, J.W.; Yan, H.X.; Yi, G.J.; et al. Comparative Transcriptome and iTRAQ proteome analyses of citrus root responses to Candidatus Liberibacter Asiaticus infection. PLoS ONE 2015, 10, e0126973. [Google Scholar] [CrossRef] [PubMed] [Green Version]
  35. Rawat, N.; Kiran, S.P.; Du, D.; Gmitter, F.G.; Deng, Z. Comprehensive meta-analysis, co-expression, and miRNA nested network analysis identifies gene candidates in citrus against Huanglongbing disease. BMC Plant Biol. 2015, 15, 184. [Google Scholar] [CrossRef] [PubMed] [Green Version]
  36. Nwugo, C.C.; Doud, M.S.; Duan, Y.-P.; Lin, H. Proteomics analysis reveals novel host molecular mechanisms associated with thermotherapy of ‘Ca. Liberibacter asiaticus’-infected citrus plants. BMC Plant Biol. 2016, 16, 253. [Google Scholar] [CrossRef] [Green Version]
  37. Killiny, N.; Jones, S.E.; Nehela, Y.; Hijaz, F.; Dutt, M.; Gmitter, F.G.; Grosser, J.W. All roads lead to Rome: Towards understanding different avenues of tolerance to huanglongbing in citrus cultivars. Plant Physiol. Biochem. 2018, 129, 1–10. [Google Scholar] [CrossRef]
  38. Yao, L.; Yu, Q.; Huang, M.; Hung, W.; Grosser, J.; Chen, S.; Wang, Y.; Gmitter, F.G. Proteomic and metabolomic analyses provide insight into the off-flavour of fruits from citrus trees infected with ‘Candidatus Liberibacter asiaticus’. Hortic. Res. 2019, 6, 31. [Google Scholar] [CrossRef]
  39. Wang, Y.; Zhou, L.; Yu, X.; Stover, E.; Luo, F.; Duan, Y. Transcriptome profiling of Huanglongbing (HLB) tolerant and susceptible citrus plants reveals the role of basal resistance in HLB tolerance. Front. Plant Sci. 2016, 7, 933. [Google Scholar] [CrossRef] [Green Version]
  40. Yan, C.; Fan, M.; Yang, M.; Zhao, J.; Zhang, W.; Su, Y.; Xiao, L.; Deng, H.; Xie, D. Injury activates Ca2+/Calmodulin-dependent phosphorylation of JAV1-JAZ8-WRKY51 complex for jasmonate biosynthesis. Mol. Cell 2018, 70, 136–149. [Google Scholar] [CrossRef] [Green Version]
  41. Ma, W.; Ali, R.; Berkowitz, G.A. Characterization of plant phenotypes associated with loss-of-function of AtCNGC1, a plant cyclic nucleotide gated cation channel. Plant Physiol. Biochem. 2006, 44, 494–505. [Google Scholar] [CrossRef]
  42. Tian, W.; Hou, C.; Ren, Z.; Wang, C.; Zhao, F.; Dahlbeck, D.; Hu, S.; Zhang, L.; Niu, Q.; Li, L.; et al. A calmodulin-gated calcium channel links pathogen patterns to plant immunity. Nature 2019, 572, 131–135. [Google Scholar] [CrossRef]
  43. Yoshioka, K.; Moeder, W.; Kang, H.G.; Kachroo, P.; Masmoudi, K.; Berkowitz, G.; Klessig, D.F. The chimeric Arabidopsis CYCLIC NUCLEOTIDE-GATED ION CHANNEL11/12 activates multiple pathogen resistance responses. Plant Cell 2006, 18, 747. [Google Scholar] [CrossRef] [PubMed] [Green Version]
  44. Urquhart, W.; Gunawardena, A.H.; Moeder, W.; Ali, R.; Berkowitz, G.A.; Yoshioka, K. The chimeric cyclic nucleotide-gated ion channel ATCNGC11/12 constitutively induces programmed cell death in a Ca2+ dependent manner. Plant Mol. Biol. 2007, 65, 747–761. [Google Scholar] [CrossRef]
  45. Romeis, T. Protein kinases in the plant defence response. Curr. Opin. Plant Biol. 2001, 4, 407–414. [Google Scholar] [CrossRef]
  46. Hurni, S.; Scheuermann, D.; Krattinger, S.G.; Kessel, B.; Wicker, T.; Herren, G.; Fitze, M.N.; Breen, J.; Presterl, T.; Ouzunova, M.; et al. The maize disease resistance gene Htn1 against northern corn leaf blight encodes a wall-associated receptor-like kinase. Proc. Natl. Acad. Sci. USA 2015, 112, 8780–8785. [Google Scholar] [CrossRef] [PubMed] [Green Version]
  47. Sun, X.L.; Yu, Q.Y.; Tang, L.L.; Ji, W.; Bai, X.; Cai, H.; Liu, X.F.; Ding, X.D.; Zhu, Y.M. GsSRK, a G-type lectin S-receptor-like serine/threonine protein kinase, is a positive regulator of plant tolerance to salt stress. J. Plant Physiol. 2013, 170, 505–515. [Google Scholar] [CrossRef] [PubMed]
  48. Sun, M.; Voorrips, R.E.; van’t Westende, W.; van Kaauwen, M.; Visser, R.G.F.; Vosman, B. Aphid resistance in Capsicum maps to a locus containing LRR-RLK gene analogues. Theor. Appl. Genet. 2019. [Google Scholar] [CrossRef] [Green Version]
  49. Pandey, S.P.; Somssich, I.E. The role of WRKY transcription factors in plant immunity. Plant Physiol. 2009, 150, 1648–1655. [Google Scholar] [CrossRef] [Green Version]
  50. Gao, Q.-M.; Venugopal, S.; Navarre, D.; Kachroo, A. Low oleic acid-derived repression of Jasmonic acid-inducible defense responses requires the WRKY50 and WRKY51 proteins. Plant Physiol. 2011, 155, 464–476. [Google Scholar] [CrossRef] [Green Version]
  51. Li, J.; Brader, G.; Kariola, T.; Tapio Palva, E. WRKY70 modulates the selection of signaling pathways in plant defense. Plant J. 2006, 46, 477–491. [Google Scholar] [CrossRef] [PubMed]
  52. Fu, Z.Q.; Yan, S.; Saleh, A.; Wang, W.; Ruble, J.; Oka, N.; Mohan, R.; Spoel, S.H.; Tada, Y.; Zheng, N. NPR3 and NPR4 are receptors for the immune signal salicylic acid in plants. Nature 2012, 486, 228. [Google Scholar] [CrossRef] [PubMed] [Green Version]
  53. Wu, Y.; Zhang, D.; Chu, J.Y.; Boyle, P.; Wang, Y.; Brindle, I.D.; De Luca, V.; Després, C. The Arabidopsis NPR1 protein is a receptor for the plant defense hormone salicylic acid. Cell Rep. 2012, 1, 639–647. [Google Scholar] [CrossRef] [PubMed] [Green Version]
  54. Liu, Y.; Liu, Q.; Tao, N.; Deng, X. Efficient isolation of RNA from fruit peel and pulp of ripening navel orange (Citrus sinensis Osbeck). J. Huazhong Agric. Univ. 2006, 25, 300–304. [Google Scholar]
  55. Anders, S.; Huber, W. Differential expression analysis for sequence count data. Genome Biol. 2010, 11, R106. [Google Scholar] [CrossRef] [Green Version]
  56. Young, M.D.; Wakefield, M.J.; Smyth, G.K.; Oshlack, A. Gene ontology analysis for RNA-seq: Accounting for selection bias. Genome Biol. 2010, 11, R14. [Google Scholar] [CrossRef] [PubMed] [Green Version]
  57. Mafra, V.; Kubo, K.S.; Alves-Ferreira, M.; Ribeiro-Alves, M.; Stuart, R.M.; Boava, L.P.; Rodrigues, C.M.; Machado, M.A. Reference genes for accurate transcript normalization in citrus genotypes under different experimental conditions. PLoS ONE 2012, 7, e31263. [Google Scholar] [CrossRef]
  58. Livak, K.J.; Schmittgen, T.D. Analysis of relative gene expression data using real-time quantitative PCR and the 2(-Delta Delta C(T)) Method. Methods 2001, 25, 402–408. [Google Scholar] [CrossRef]
  59. Burow, M.D.; Chlan, C.A.; Sen, P.; Lisca, A.; Murai, N. High-frequency generation of transgenic tobacco plants after modified leaf disk cocultivation with Agrobacterium tumefaciens. Plant Mol. Biol. Report. 1990, 8, 124–139. [Google Scholar] [CrossRef]
  60. Bracha-Drori, K.; Shichrur, K.; Katz, A.; Oliva, M.; Angelovici, R.; Yalovsky, S.; Ohad, N. Detection of protein–protein interactions in plants using bimolecular fluorescence complementation. Plant J. 2004, 40, 419–427. [Google Scholar] [CrossRef]
  61. Martin, K.; Kopperud, K.; Chakrabarty, R.; Banerjee, R.; Brooks, R.; Goodin, M.M. Transient expression in Nicotiana benthamiana fluorescent marker lines provides enhanced definition of protein localization, movement and interactions in planta. Plant J. 2009, 59, 150–162. [Google Scholar] [CrossRef] [PubMed]
  62. Sparkes, I.A.; Runions, J.; Kearns, A.; Hawes, C. Rapid, transient expression of fluorescent fusion proteins in tobacco plants and generation of stably transformed plants. Nat. Protoc. 2006, 1, 2019–2025. [Google Scholar] [CrossRef] [PubMed]
Figure 1. RNAseq analysis (A) Correlation between RNA-Seq samples. NPR1_1/2/3 represent three replicates of the NPR1 overexpressing line (NPR1-2), Val_1/2/3 represent three replicates of the control non-transgenic ‘Valencia’ line, heat maps of the correlation coefficient between samples, R2 means the square of the Pearson coefficient; (B) Venn diagram of expressed genes in transgenic NPR1 overexpressing line (NPR1-2) and control non-transgenic ‘Valencia’ line. FPKM > 1 is the expression threshold, NPR1 and Val represent the AtNPR1-transgenic line (NPR1-2) and non-transgenic ‘Valencia’ line, respectively.
Ijms 21 02009 g001
Figure 2. Analysis of the differentially expressed genes (DEGs). (A) DEGs between the transgenic NPR1 overexpressing line (NPR1-2) and control non-transgenic ‘Valencia’ line; (B) Kyoto Encyclopedia of Genes and Genomes (KEGG) enrichment scatter plot of DEGs. The y-axis shows the name of the pathway and the x-axis shows the Rich factor. Dot size represents the number of different genes and the color indicates the q-value.
Ijms 21 02009 g002
Figure 3. Gene ontology (GO) term enrichment analysis. (A,B) The GO enrichment terms of (A) upregulated (B) and downregulated DEGs. In the x-axis the number of DEGs is represented, and in the y-axis the GO terms enriched. Different colors are used to distinct biological process, cellular components, and molecular function.
Ijms 21 02009 g003
Figure 4. qRT-PCR verification for expression pattern of selected DEGs. The expression levels of DEG candidates in NPR1-2 transgenic line compared to Val control determined by qRT-PCR (2-ΔΔCt). Different letters (a, b) represent a significant difference at p ≤ 0.05 using Duncan’s Multiple Range Test and error bars represent SE (n = 3).
Ijms 21 02009 g004
Figure 5. qRT-PCR for RNAseq data validation of genes involved with plant defense responses. Comparison between NPR1-2 transgenic and non-transgenic plants of genes involved in the (A) NPR1-SA dependent pathway, including CsNPR1, CsNPR3, and CsSABP2 along with pathogenesis related proteins, CsPR1 and CsPR2; and (B) transcription factors. Different letters (a, b) represent a significant difference at p ≤ 0.05 using Duncan’s Multiple Range Test and error bars represent SE (n = 3).
Ijms 21 02009 g005
Figure 6. Yeast-two-hybrid (Y2H) interaction assays of AtNPR1 with CsNPR3 and CsTGA5. DDO (double dropout medium): SD/-Trp and -Leu, QDO (quadruple dropout medium)/X/A: SD/-Leu/-Trp/-Ade/-His + X-α-Gal and Aureobasidin A. The empty BD (B0) and AD (A0) vectors were used as negative controls. Standard positive control (pGBKT7-53 and pGADT7-T; Clontech) and standard negative control (pGBKT7-Lam and pGADT7-T) were included. The scale bar at the bottom of the figure denotes 1 cm length.
Ijms 21 02009 g006
Figure 7. Confocal micrographs showing results of bimolecular fluorescence complementation assays (BiFC) assays to determine interactions between AtNPR1 with CsNPR3 and CsTGA5 proteins. (A–AB) show micrographs of YFP (BiFC), nuclear marker (Nucleus), transmission white light (Bright field) and the resultant overlay, respectively. The upper set of panels are showing positive interaction and the bottom set of pictures are showing the negative controls. (AH) show the AtNPR1 and CsNPR3 positive interaction. (EH) is a zoom up containing nuclei details. In (IP) the positive interaction between AtNPR1 and CsTGA5 is demonstrated and (MP) is a zoom up showing nuclei. White arrows indicate nuclear interaction. (QAB) pictures show the negative controls. All the constructs were transiently co-expressed in Nicotiana benthamiana RFP-H-2B plants. The scale bars represent 35 µM in length and for the magnified images each bar represent 5 µM in length.
Ijms 21 02009 g007
Table 1. Summary of sequencing data from the different replicates of the NPR1-2 transgenic line and control non-transgenic ‘Valencia’ line.
Sample *Clean ReadsClean Bases≥Q30 (%)GC Content (%)Total Mapped (%)Uniquely Mapped (%)
NPR1_162,607,2647.91G92.8944.8447,656,347 (76.12%)46,101,606 (73.64%)
NPR1_259,175,1507.40G92.7945.2345,972,884 (77.69%)44,572,333 (75.32%)
NPR1_359,225,2987.41G92.5844.9247,206,105 (79.71%)45,624,108 (77.03%)
Val_165,551,7288.20G92.4444.454,260,656 (82.78%)52,711,952 (80.41%)
Val_265,372,8808.18G92.8444.1954,287,742 (83.04%)52,522,887 (80.34%)
Val_361,717,4067.72G92.744.5951,647,046 (83.68%)50,005,354 (81.02%)
Total/Average373,649,72647.00G92.7144.6950,171,797 (80.50%)48,589,707 (77.96%)
* NPR1_1/2/3 represent three replicates of NPR1-2 line while Val_1/2/3 represent three replicates of the control non-transgenic ‘Valencia’ line.
Table 2. List of all DEGs between the NPR1-2 transgenic line and control non-transgenic ‘Valencia’ line.
Gene IDlog2 (Fold Change)padjFunctional DescriptionE-Value
Cs9g18210Inf2.76E-04Cyclic nucleotide-gated ion channel 11.26E-100
orange1.1t0144710.702.35E-03Transactivator/viroplasmin protein2.95E-06
orange1.1t0144810.363.52E-04Putative Polyprotein CP2.51E-07
Cs9g181809.602.48E-32Cyclic nucleotide-gated ion channel 12.41E-98
orange1.1t043186.711.70E-19Ankyrin repeat-containing protein1.39E-15
orange1.1t043166.522.20E-19Ankyrin repeat-containing protein5.38E-21
Cs1g139106.341.76E-02Wall-associated receptor kinase-like 103.06E-167
Cs9g182405.913.92E-02Cyclic nucleotide-gated ion channel 11.81E-129
Cs1g038705.275.92E-05Probable WRKY transcription factor 518.66E-38
orange1.1t043195.268.15E-05Ankyrin repeat-containing protein 5.68E-07
Cs2g274304.002.22E-03MYB-related protein Myb41.25E-50
orange1.1t044433.973.98E-03TMV resistance protein N1.09E-39
orange1.1t038023.963.80E-02Protein Enhanced disease susceptibility 13.56E-135
Cs2g274103.864.63E-05MYB-related protein Myb48.93E-51
orange1.1t043133.852.11E-05Huamn Ankyrin-21.79E-15
Cs2g010903.811.23E-04UPF0481 protein8.09E-36
Cs7g119403.771.13E-02Cytosolic sulfotransferase 124.84E-116
Cs1g244403.622.76E-04Salicylate carboxymethyl transferase6.62E-158
orange1.1t030833.333.98E-03Putative ribonuclease H protein3.42E-20
Cs1g119603.311.15E-04G-type lectin S-receptor-like serine/threonine-protein kinase6.12-131
Cs5g163103.174.40E-05Flavanone 3-dioxygenase2.30E-69
orange1.1t020713.138.55E-05UPF0481 protein2.10E-28
Cs2g210003.043.17E-04Linolenate hydroperoxide lyase, chloroplastic0
Cs2g132803.038.73E-05Probable receptor-like protein kinase5.18E-98
orange1.1t049133.022.44E-03TMV resistance protein N1.45E-54
Cs7g295703.008.73E-05Probable WRKY transcription factor 701.61E-41
Cs4g042102.842.92E-04Transcription factor bHLH35 4.47E-67
orange1.1t018402.831.05E-02TMV resistance protein N8.85E-172
Cs4g059002.721.06E-02Ankyrin repeat-containing protein3.72E-27
Cs3g101102.622.54E-03LRR receptor-like serine/threonine-protein kinase9.01E-17
orange1.1t025042.553.90E-03Probable disease resistance protein3.26E-175
Cs4g183202.494.46E-03Glutaredoxin-C62.03E-57
Cs9g121602.406.88E-03LRR receptor-like serine/threonine-protein kinase GSO13.67E-14
Cs7g290402.342.61E-02Heat shock cognate 70 kDa protein0
Cs7g154302.311.25E-02Cytochrome P450 89A23.06E-171
Cs5g042502.252.55E-02Mitochondrial outer membrane protein porin of 36 kDa3.27E-51
Cs6g018702.182.61E-02Probable LRR receptor-like serine/threonine-protein kinase6.63E-13
orange1.1t005892.143.59E-02NAC domain-containing protein 681.50E-20
Cs5g060002.133.10E-02Copper methylamine oxidase3.84E-167
Cs1g037002.093.15E-02Mechanosensitive ion channel protein 101.20E-13
Cs5g12280−6.396.99E-05Agamous-like MADS-box protein AGL83.38E-33
Cs5g12290−5.761.70E-06Agamous-like MADS-box protein AGL89.58E-34
Cs7g11800−3.658.18E-06Developmental protein SEPALLATA 28.38E-33
Cs9g07970−2.338.25E-033-ketoacyl-CoA synthase 110
orange1.1t04139−2.291.01E-02Geraniol 8-hydroxylase0

