Article

Can We Use Forest Inventory Mapping as a Coarse Filter in Ecosystem Based Management in the Black Spruce Boreal Forest?

1
NSERC-UQAT-UQAM Industrial Chair in Sustainable Forest Management, Université du Québec en Abitibi-Témiscamingue, 445 boul. de l'Université, Rouyn-Noranda, QC J9X 5E4, Canada
2
Université de Québec à Montréal, 141 Avenue du Président-Kennedy, Montréal, QC H2X 1Y4, Canada
*
Author to whom correspondence should be addressed.
Forests 2015, 6(4), 1195-1207; https://doi.org/10.3390/f6041195
Submission received: 11 December 2014 / Revised: 22 March 2015 / Accepted: 3 April 2015 / Published: 15 April 2015

Abstract

:
Forest inventory mapping is used worldwide to describe forests at a large spatial scale via the delimitation of portions of the landscape that are structurally homogeneous. Consequently, there is a significant amount of descriptive forest data in forest inventory maps, particularly with the development of ecosystem classification, which represents a significant potential for use in ecosystem based management. With this study we propose to test whether forest inventory maps can be used to describe not only stand characteristics but also dynamic processes. The results indicate that stand types identifiable in forest inventory maps do not in fact represent unique developmental stages, but rather confound stands at multiple developmental stages that may be undergoing different ecological processes. The reasons for this are linked to both the interaction between succession, fire severity and paludification. Finally, some aspects of the process of forest inventory mapping itself contribute to the disjunction between forest types and forest succession. Given the low similarity between spruce mapping types and their actual description following forest inventories, it would be too ambitious to infer the dynamic aspects of spruce forest by map units.

1. Introduction

Black spruce ecosystems dominate the boreal forests of eastern Canada, supporting an extensive forest industry and these forests are under significant management pressure. Sustainable management of the earth’s forest ecosystems, including black spruce forests, is required to maintain the services they provide, particularly with a re-valorization of wood products as a less carbon intensive alternative to steel and concrete [1]. Ecosystem based management has been suggested as an approach to achieve sustainable forest management, as it focuses on reducing differences between natural and managed forests and forested landscapes [2]. As such it is similar to the coarse filter approach from conservation biology [3], which suggests that the majority of species in a region can be conserved by protecting a proportion of all habitat types present in the natural landscapes of the region.
For this approach to be successful, a forest landscape must be accurately described in terms of stand structure and composition in order to determine the type and relative abundance of different habitat types, in this case forest types. Forest inventory mapping, based on interpretation of aerial photos and ground truthing, is used worldwide to describe forests at a large spatial scale (e.g., [4,5,6]) via the delimitation of portions of the landscape that are structurally homogeneous. Consequently, there is a significant amount of descriptive forest data in forest inventory maps, particularly with the development of ecosystem classification [7], which represents a significant potential for use in ecosystem based management. This potential has been exploited in the development of wildlife habitat assessments (e.g., [8,9]).
However, many species respond not only to static stand characteristics but also to dynamic processes operating on the landscape such as ecological succession (which is sometimes related with stand characteristics; e.g., [10]), fire (including its attributes such as severity [11]), and paludification [12]. For example Fenton and Bergeron [13] found that bryophyte species composition varied with the severity of the last stand replacing fire for centuries after fire. Consequently ecosystem based management requires an understanding of the abundance and distribution of not only stand characteristics but also the processes that are operating in each stand in order to capture biodiversity needs. Forest inventory maps can be useful in this approach if the static stand composition and structure classifications can describe the dynamic and functional attributes of actual forest ecosystems.
In addition to post-fire succession, fire severity and paludification are included in this evaluation. Fire constitutes the most important natural disturbance influencing forest structural development and succession in boreal forests [11,14] and some of its attributes can alter successional sequences. One such attribute is fire severity (as defined by Miyanishi and Johnson [15], as the effect of fire on the thickness of the post-fire residual organic layer), which can alter successional sequences. For example, under similar edaphic conditions, variations in fire severity can modify successional pathways by selecting for species with different regeneration and fire adaptation traits [11,16], and forest structures [14].
In some regions of the boreal forest with poor drainage, forest succession is influenced by the process of paludification in addition to the influences of fire. Paludification is the gradual accumulation of a thick organic layer on the mineral soil between fires, as production is greater than decomposition. This thick organic layer and the associated high water table can result in the transformation of a forest on mineral soil into a forested peatland [17,18]. Consequently, paludification alters stand structure and ecosystem biomass partitioning [19] and other ecosystem functions [20] and ultimately creates alternative post-fire successional pathways by both increasing the amount of organic matter needed to be burned to reach the mineral soil, and reducing the amount of carbon lost during fire [21,22].
With this study we propose to test whether forest inventory maps can be used to describe not only stand characteristics but also dynamic processes. As significant errors, such as errors in species and stand type identification and age misclassifications, have been detected in forest inventory maps when compared to field data in regions with multiple tree species (e.g., [8,23]), we focus on monospecific stands on a common soil type to eliminate one source of error in forest inventory maps. These stands also dominate our study region, the Clay Belt of northwest Quebec, Canada. We first evaluate the correlation between stand characteristics (i.e., height and density) derived from forest inventory maps (hereafter interpreted data) and actual forest stand characteristics in monospecific Black spruce (Mill.) B.S.P. stands on clay soils. Secondly we evaluate whether processes (i.e., succession, fire severity and paludification) can be detected using stand characteristics. We hypothesize that interpreted data can be used to describe dynamic processes that influence forest structure and the species they contain. Specifically, we hypothesize that combinations of height and density will be associated with specific levels of variables used as proxies for these processes: time since fire for succession, fire severity as an attribute of fire and organic layer thickness for paludification. A tight association between levels of these variables and stand types identified in forest inventory data would permit a detailed classification of the territory that takes into account currently active or past ecological processes, as well as stand structural characteristics.

2. Experimental Section
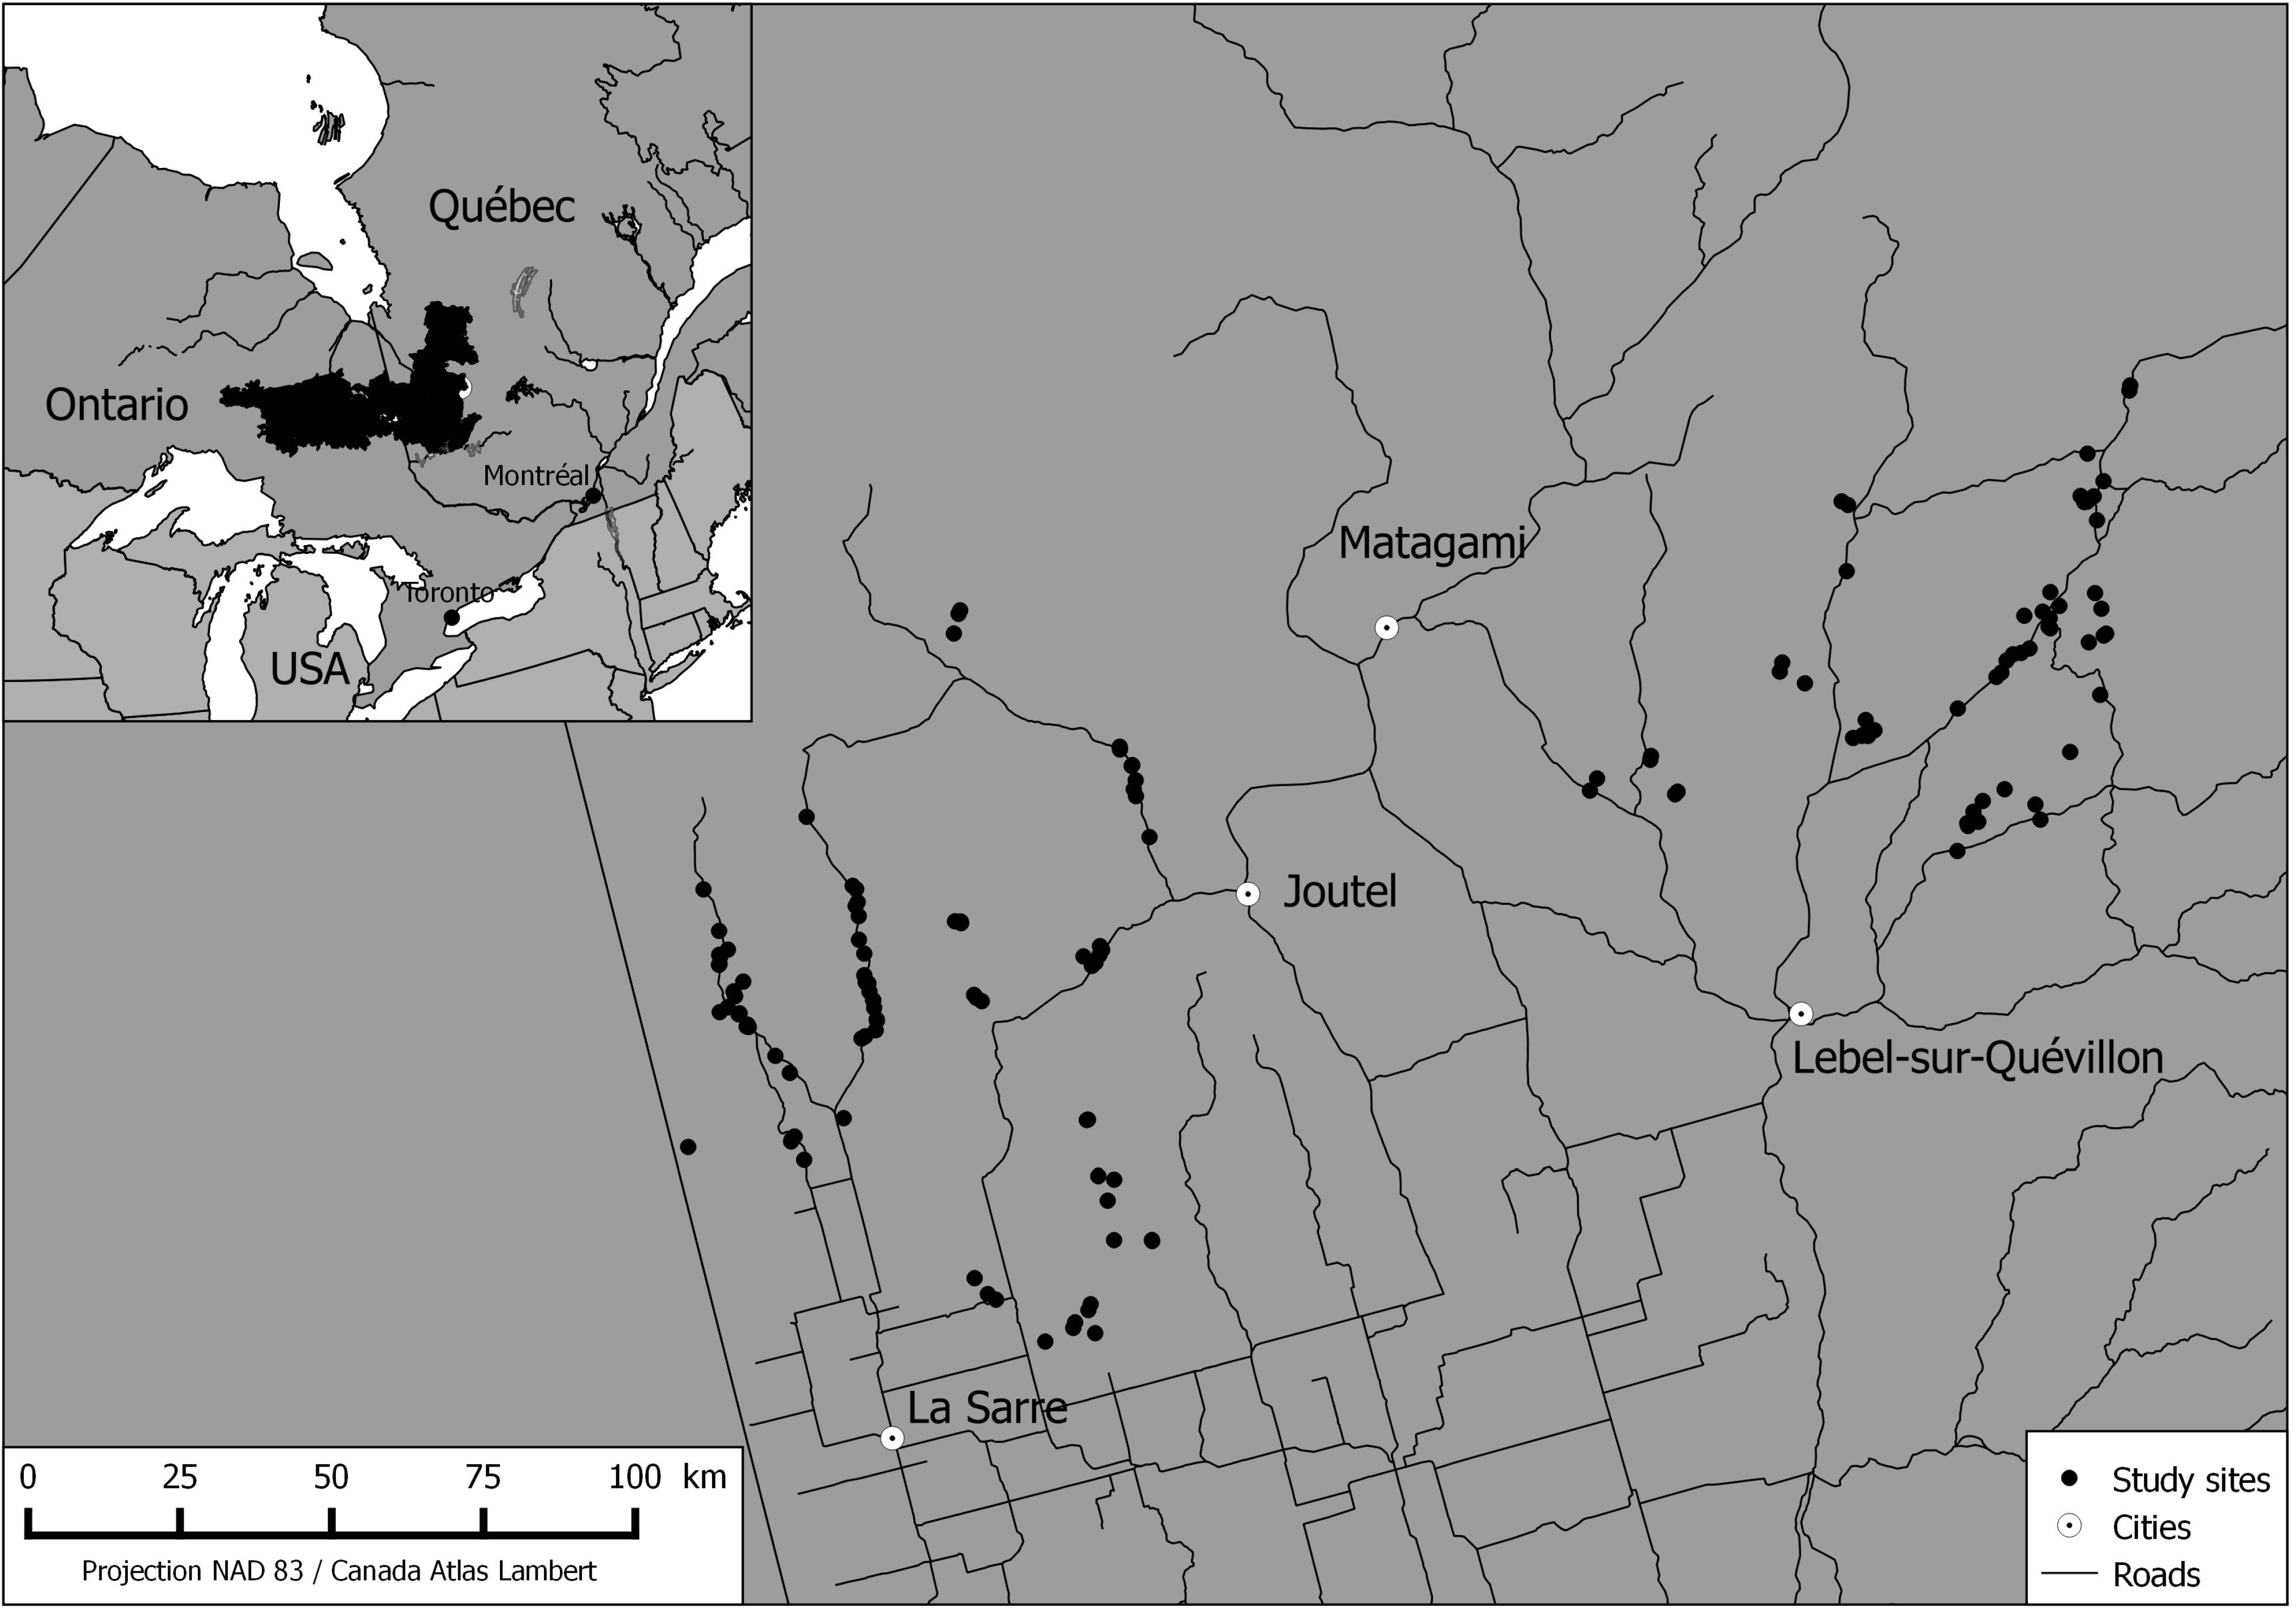
2.1. Study Area

The study area is located in the Clay Belt region of northwestern Quebec and Ontario (49°57′ N to 48°52′ N and 79°29′ W to 75°50′ W; Figure 1) and is part of the western black spruce-feathermoss bioclimatic domain [24]. In this region where the topography was flattened by glacial activity, the last glacial advance during the Wisconsin glaciation (ca., 8000 before present) compacted the lacustrine clays that had been laid down by glacial lakes Barlow and Ojibway [25].
The average annual temperature for the 1981–2010 period at Joutel, Québec, the nearest weather station (49°27′ N; 78°18′ W), was 0.0 °C, and average annual precipitation was 909 mm, with 35% falling during the growing season [26]. The average number of degree-days (>5 °C) was 1241, and the frost-free season was approximately 60 days; frost occasionally occurs during the growing season. Black spruce dominates the forest mosaic, jack pine (Pinus banksiana Lamb.), balsam fir (Abies balsamea L. Mill.), and trembling aspen (Populus tremuloides Michx.) are secondary species. The landscape is driven primarily by stand replacing fires. The fire cycle in the region was estimated at 101 years before 1850, 135 years between 1850 and 1920, and 398 years since 1920 [27].
Figure 1. Location of the study area within the province of Quebec. Left panel: the clay belt of Quebec and Ontario. Right panel: selected study sites.
Forests 06 01195 g001

2.2. Field Survey

In this study, interpreted data derived from the GIS based third decennial inventory of 1992–2002 [28] and characteristics determined by field measurements were compared. Forest inventory maps included information on stand height and stand density by class, which are described in Table 1. Classes of these two characteristics are typically combined to generate “forest types” and it is this combination that was compared both in terms of reliability of the interpreted data, but also in the possibility of describing processes with these forest types. Field measurements were collected in 130 black spruce stands randomly chosen from accessible (<2 km from a road) stands to proportionally represent the variability in stand characteristics identifiable on the landscape with the forest inventory maps (i.e., tall dense stands to open “unproductive” swamps) in 2008–2009.
Table 1. Classification of forest characteristics into forest types [28].
Cover DensityDefinitionCanopy HeightDefinition
B60%–80%217 m–21 m
C25%–60%312 m–17 m
D<25%4<12 m
Swamp<10%Swamp<12 m
Field data was collected in 2008 and 2009 using the standard methodology of the Quebec Ministry of Natural Resources [29]. One representative circular 400 m2 plot was established in each of the 130 sites, at least 50 m from the margins and DBH (diameter at breast height) and height of all commercial stems of all tree species (DBH ≥ 9 cm) were measured. Subsequently, field stand characteristics were calculated following the standard method for the inventories in Québec. Height was calculated as the mean height of the dominant trees in even-aged stands and as the mean height of the dominant layer (determined by basal area) in uneven stands [30]. Density was calculated as the proportion of the ground covered by the projection of the canopy of the dominant layer in even aged stands and of all stems over 7 m in height in uneven stands [30]. Stands were then stratified into classes following the forest inventory cut-off points as in Table 1 and determined by [28].
In addition to these characteristics that were identical to those of the interpreted data, additional independent variables were measured or estimated to describe the processes that are being examined, i.e., organic layer thickness, time since last fire and the severity of that fire. The thickness of the organic layer and the texture of the underlying mineral soil were determined in a soil pit that was dug in the center of each plot. Organic layer thickness was then divided into three classes, presenting a paludification gradient 0–30 cm, 31–60 cm, >60 cm.
Time since last fire was estimated via one of three methods. In even aged stands, time since last fire was estimated by coring and counting growth rings of ten dominant trees. In uneven aged stands minimum time since last fire was also estimated by coring and counting growth rings in ten of the tallest cohort. In these first two methods, the maximum age was used as the estimate of time since fire. However in sites where these trees approached the maximum life span of black spruce (i.e., >180 years), AMS radiocarbon dating was used to date the most recent fire event (18 stands). This approach is based on the methodology of Simard et al. [31]. More specifically, in each of these stands, a 2 m long soil pit was dug in order to expose the soil profile. This profile was scanned to identify the uppermost charcoal layer and carbonized plant remains were collected (0.05–4 g). These plant remains were then sent to Beta Analytic (Miami, FL, USA) for 14C radiocarbon dating. The charred material was selected with the following protocol [32]: in cases where there were many charcoal horizons within the organic layer, the uppermost layer was chosen and in order to reduce the inbuilt age (i.e., time accumulated in the sample before it was burned), only samples of charred seeds, small twigs, scales of cones, and needles were included; when only one charcoal horizon was present at the base of the soil profile, potentially representing many fire events, we chose to date the peat accumulated just above the charcoal horizon.
As fires of different severities have been shown to induce different successional trajectories on the Clay Belt [14,31], the severity (defined as the quantity of the organic/duff layer burnt; sensu [15]) of the last stand replacing fire disturbance was determined. Using the soil pits dug in each site fire severity was assessed using the thickness of the organic layer between the top charcoal layer and the mineral soil. Stands with a residual organic layer (ROM) >4 cm were considered to have originated after low-severity fires, whereas those with ROM <4 cm were considered to have originated after high-severity fires, as this residual thickness has been shown to influence seed germination and seedling survival [16].

2.3. Statistical Analyses

In order to determine the correspondence between interpreted and field data, we compared them in terms of cover density, height class, and forest type, with Cohen’s Kappa statistic, which specifically measures the agreement between two classifications. The values of Kappa vary between 1 (perfect match) and 0 (no correspondence).
To determine whether forest types generated using the characteristics used in forest inventory maps are associated with specific levels of the variables representing target processes, i.e., time since fire, fire severity and organic layer thickness we classed each stand for the three variables. We determined the mean age of each forest type (based on field data) and classed the stands into one of three age groups: 59–126 years, mature; 127–187 years, overmature; 190–3410 years, old growth. Similarly we classed the organic layer thickness into three groups: <30 cm, 30–60 cm and >60 cm. Stands were also classed as originating after a high or low severity fire. Subsequently, we calculated the frequency of stands of each forest type for each level of each variable. In order to determine whether certain forest types were associated with certain levels of the variables, we tested the null hypothesis that each stand type was equally likely to be found at each level of the variable, with the Chi square test. For example, for the forest type C3 (N = 43), the expected frequency in each of the three time since fire classes was 13.67 stands. If the Chi squared value is lower than the critical value (in this case d.f. = 2), the null hypothesis cannot be rejected and C3 is not associated with a particular time since fire.

3. Results

3.1. Correspondence between Interpreted and Field Data

Forest density was the most consistent between the two types of data with a Kappa statistic of 0.44 (Table 2). In contrast, height and forest type differed significantly between interpreted and field data with Kappa statistics of 0.12 and 0.29, respectively. In terms of height, most differences in classification were in the interpreted height class 4, which were predominately classified as class 3 with field data. In terms of forest type, a large proportion of each forest type corresponded. However, many stands differed by one height or density class, and in some cases, by two classes.

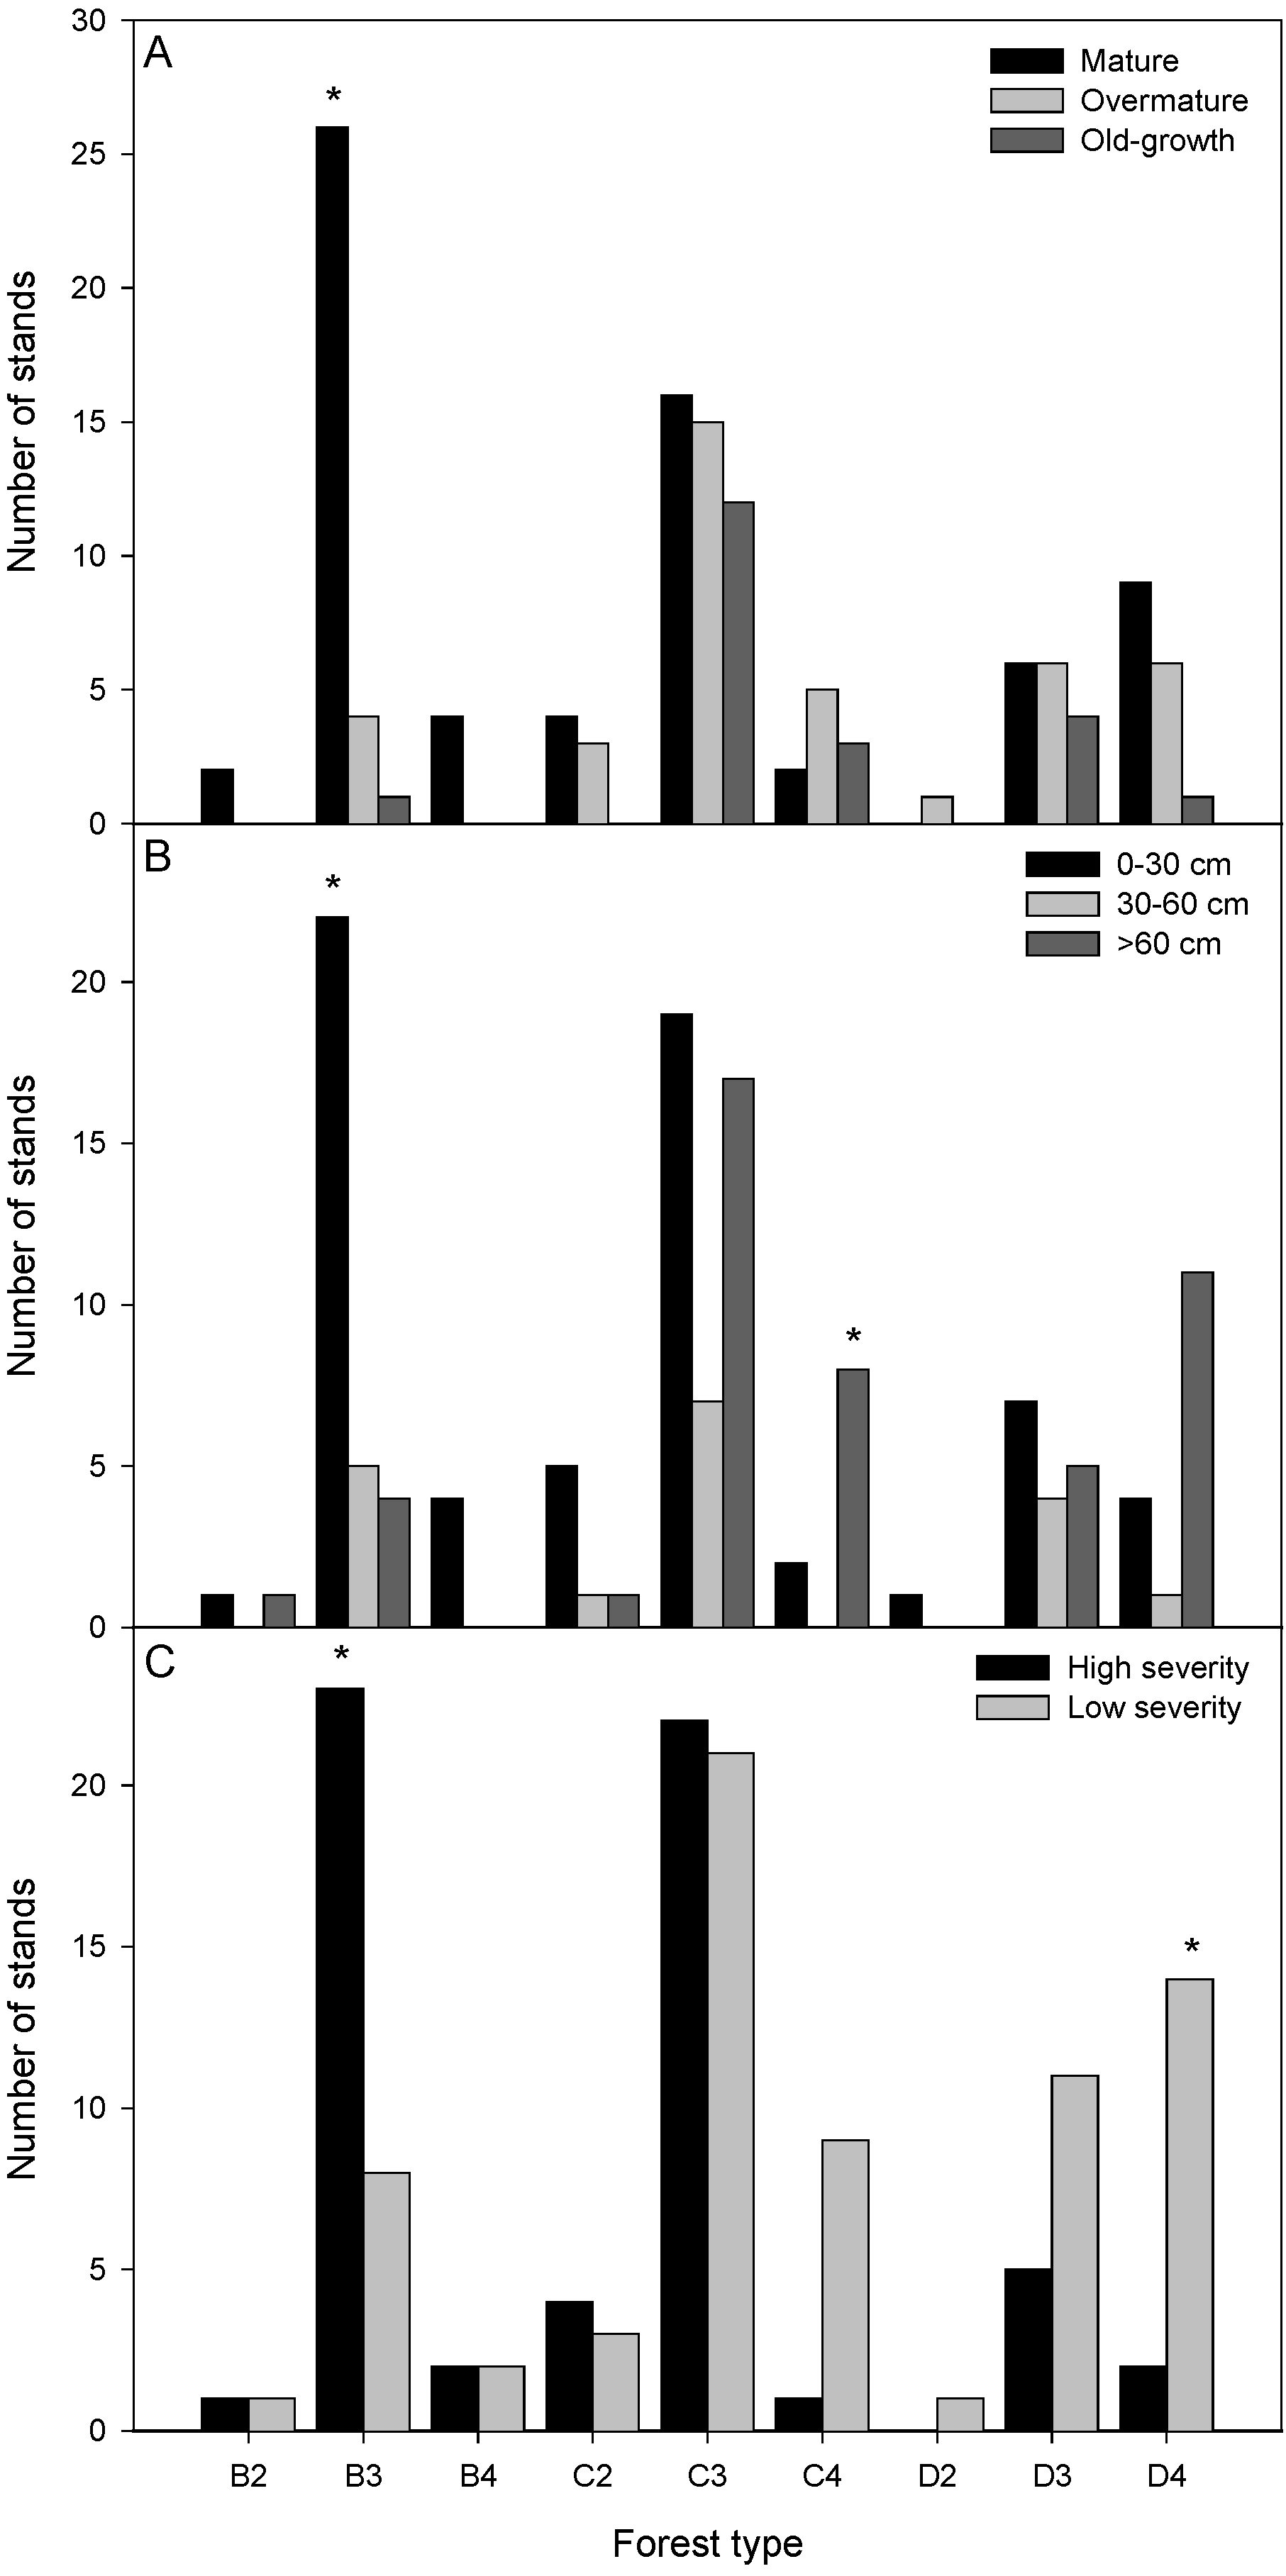
3.2. Including Processes

The possibility of describing the actions of processes on the landscape were subsequently examined using the forest types generated by field data (Figure 2). Overall, few forest types were associated with specific levels of individual variables representing processes, as indicated by the Chi-squared test, as the null hypothesis was rarely rejected. Time since fire showed no clear trends with forest type, except for the B3 forest type that was predominantly in the mature class (59–126 years). In terms of organic layer thickness, B3 stands were associated with the <30 cm class, and the C4 class was associated with the >60 cm class. Otherwise the forest types were not associated with a particular class. The B3 and the D4 forest types were the only forest types associated with a particular fire severity, the first with high severity and the second with low severity fire.
Table 2. Comparison of the map and field classification of stand height, stand density and forest type. Note that swamps were not included in the height class comparison, resulting in an N of 115. The number of stands in each forest type by interpreted and field data are represented by the row and column tables. Classifications were compared with the Cohen Kappa Test. Value for height class was 0.12, for density class was 0.44, and for forest type 0.29.
Canopy height class from mapCanopy Height Class from Field Data
234Total
20000
3664676
42251239
Total89131115
Canopy Density Class from Field Data
Canopy density class from mapBCDSwampTotal
B28101039
C7386051
D2914025
Swamp0312015
Total3760330130
Forest Type from Field Data
B2B3B4C2C3C4D2D3D4SwampTotal
Forest type from mapB200000000000
B3180121010014
B40164041000025
C200000000000
C31503260041040
C4000235001011
D200000000000
D3020161192022
D400001001103
Swamp0000120111015
Total231574210116160130
Figure 2. Frequency distribution of levels of variables representing target processes among different forest types. Time since fire (A); organic layer thickness (B); fire severity (C). Forest types where the distribution differs from the expected (i.e., an equal distribution among classes within a variable) are indicated by an asterisk.
Forests 06 01195 g002

4. Discussion

The general objective of this study was to evaluate the possibility of using forest inventory maps as a coarse filter in an ecosystem management strategy in black spruce (Picea mariana) forests. Specifically, we hypothesized that combinations of height and density will be associated with specific levels of variables used as proxies for these processes: time since fire for succession, fire severity as an attribute of fire and organic layer thickness for paludification. Globally the lack of significant differences in the frequencies of stand types among levels of the variables indicate that in black spruce forests forest types do not represent one developmental stage during forest succession, but in many cases represent several stages. The reasons for this are linked to both the interaction between stand age, fire severity and paludification. Finally, some aspects of the process of forest inventory mapping itself contribute to the disjunction between forest types and forest succession.

4.1. Interaction between Stand Age, Fire Severity and Paludification

We found that B3 stands were significantly associated with high severity fires, mature stands and organic layers less than 30 cm thick. This is unsurprising because fire severity is generally a function of the weather before fire ignition and during the burning period [33], at a local scale variations in fuel type can result in patches of forest that are burned less severely (sensu [16,21,34]). Consequently high-severity fire reduces the thickness of the organic layer [19] producing (i) favourable seedbeds for the germination of spruce seeds [16]; (ii) increased soil fertility [31]; and (iii) free growing space by eliminating competing vegetation. All of these effects have been shown to favour spruce stand regeneration, generating dense stands [19,35]. In the absence of fire, the gradual canopy opening of black spruce stands continues, both in the case of stands originating from high severity fire and those originating from low severity fire, to give ultimately the unproductive open stands (C3 and C4 stands that are very old, Figure 2). In contrast, following low-severity fire, stand structure development is characterized by slow tree regeneration and a high density of shade-tolerant shrubs that delay canopy closure [14]. Consequently, stands established after a low severity fire were predominantly in the partially open and open stands, as a high proportion of C4, D3 and particularly D4 stands were established after low severity fire, with many mature stands. This results in young forest stands with a structure similar to that of old-growth forests [14,19].

4.2. Accuracy of Interpreted Data

Any forest map remains a simplified representation of the true landscape as rigid typologies are applied to a landscape made up of continuous gradients, and as such it is an abstraction of reality. There is no mapping system therefore intrinsically better than any other, there are only mapping systems more or less satisfactory depending on the objectives and costs incurred. The question is what level of generalization will meet the needs of forest management in a given region. In a forest area as large as Québec, forest inventories are dependent on the use of remote sensing tools. The forest inventory of Québec is based on a combination of field plots and aerial photo interpretation [36]. While these methods are applicable to large areas they have an inherent error that results in certain inconsistencies in the maps, such as we found in this study. Accuracy in forest mapping can be discussed in two broad categories: positional and classification [37]. The delineation of stands within a forest mosaic deals with positional accuracy, as the placement of the edges of a stand is dependent on the judgment of the photo interpreter [37]. As forest characteristics are located along a gradient, the concept of a stand is rather a gradual transition of the forest characteristics along changing environmental conditions. Stands delineated on forest maps artificially truncate this gradual transition [8], which may be particularly problematic in our study system dominated by one species (black spruce) and soil type (clay). Classification accuracy is particularly problematic at the level of species identification and in mixed composition stands [8,22]. However, despite the fact that in this study we included only monospecific stands, classification accuracy was still problematic for height estimates, with the lowest Kappa statistic (0.12).

5. Conclusions

Ecosystem based management aims at reproducing, at the landscape-level, the forest features encountered under a natural disturbance regime. More specifically, it aims at maintaining at the landscape-level the proportions of different stands and of age structures encountered as well as all the possible combinations of composition and structure [24]. Forest inventory maps based on inventory data and photo-interpretation, represent a concentration of information on forest structure that could facilitate ecosystem based management by providing classified polygons. In general forest maps are underutilized because of inaccuracies and approximations in the identification of forest types. Several studies in boreal Canada have indicated that forest inventory maps may poorly predict habitat of birds and mammals [8], winter forage for caribou [9] and ground beetles [38]. This study confirms that this problem persists, even within a landscape dominated by one species and soil type, as forest types defined by density and height classes do not represent one developmental stage during forest succession, but in many cases may represent several stages. Our results may provide part of the answer as to why previous studies performed poorly, as in addition to classification and positional accuracy, forest types do not consistently represent dynamic processes on the landscape.
Given the low similarity between spruce mapping types and their actual description following forest inventories, it would be too ambitious to infer the dynamic aspects of spruce forest by map units. From an ecosystem based management standpoint, mapping tools have limitations due to the lack of accuracy that may be inadequate for conservation planning [39] and the use of better tools such as remote sensing [40], including LiDAR [41] or Radar [42] should be promoted. As the detection of the severity of an event that took place decades or even centuries previous via remote sensing is unlikely, studies should focus on finding a physical proxy that would remain within the forest. Perhaps recent findings of large amounts of buried wood after low severity fire [43] offers a solution, as this component of peat will undoubtedly alter it density and water retention capacity, which radar or other remote sensing techniques could detect.

Acknowledgments

We thank the numerous people who helped us during the fieldwork. Thanks to Louis Dumas at Tembec for helping with the selection and preparation of forest maps and Figure 1. Funding for this project was made possible by the Fonds Québécois pour la recherche sur la nature et les technologies (FQRNT), the Natural Science and Engineering Research Council (NSERC), Tembec and the UQAT-UQAM-NSERC Industrial Chair in Sustainable Forest Management.

Author Contributions

Chafi Chaieb, Nicole J. Fenton and Yves Bergeron conceived and designed the project. Chafi Chaieb and Nicole J. Fenton collected the data and completed the analyses. Chafi Chaieb, Nicole J. Fenton, Benoit Lafleur and Yves Bergeron wrote the paper.

Conflicts of Interest

The authors declare no conflict of interest.

References

  1. Gustavsson, L.; Pingoud, K.; Sathre, R. Carbon dioxide balance of wood substitution: comparing concrete- and wood-framed buildings. Mitig. Adapt. Strateg. Glob. Change 2006, 11, 667–691. [Google Scholar] [CrossRef]
  2. Gauthier, S.; Vaillancourt, M.-A.; Kneeshaw, D.D.; Drapeau, P.; de Grandpre, L.; Claveau, Y.; Paré, D. Aménagement forestier écosystémique. In Aménagement écosystémique en forêt boréale; Gauthier, S., Vaillancourt, M.A., Leduc, A., de Grandpré, L., Kneeshaw, D.D., Morin, H., Drapeau, P., Bergeron, Y., Eds.; Presses de l’Université du Québec: Québec, QC, Canada, 2008; pp. 13–40. [Google Scholar]
  3. Hunter, M.L.J. Wildlife, Forests, and Forestry: Priciples of Managing Forests for Biological Diversity; Prentice-Hall: Englewood Cliffs, NJ, USA, 1990; p. 370. [Google Scholar]
  4. Sirait, M.; Prasodjo, S.; Podger, N.; Flavelle, A.; Jefferson, F. Mapping customary land in East Kalimantan, Indonesia: A Tool for forest management. Ambio 1994, 23, 411–417. [Google Scholar]
  5. Lucas, R.M.; Honzák, M.; Curran, P.J.; Foody, G.M.; Milne, R.; Brown, T.; Amaral, S. Mapping the regional extent of tropical forest regeneration stages in the Brazilian Legal Amazon using NOAA AVHRR data. Int. J. Rem. Sens. 2000, 21, 2855–2881. [Google Scholar] [CrossRef]
  6. Burnett, C.; Fall, A.; Tomppo, E.; Kalliola, R. Monitoring current status of and trends in boreal forest land use in Russian Karelia. Cons. Ecol. 2003, 7. [Google Scholar]
  7. Bélanger, L.; Bergeron, Y.; Camiré, C. Ecological land survey in Quebec. For. Chron. 1992, 68, 42–52. [Google Scholar] [CrossRef]
  8. Thompson, I.D.; Maher, S.C.; Rouillard, D.P.; Fryxell, J.M.; Baker, J.A. Accuracy of forest inventory mapping: Some implications for boreal forest management. For. Ecol. Manag. 2007, 252, 208–221. [Google Scholar] [CrossRef]
  9. Boan, J.J.; McLaren, B.E.; Malcolm, J.R. Predicting non-inventoried forest elements using forest inventory data: The case of winter forage for woodland caribou. Ecoscience 2013, 20, 101–111. [Google Scholar] [CrossRef]
  10. Harper, K.A.; Bergeron, Y.; Drapeau, P.; Gauthier, S.; de Grandpré, L. Structural development following fire in black spruce boreal forest. For. Ecol. Manag. 2005, 206, 293–306. [Google Scholar] [CrossRef]
  11. Johnstone, J.; Chapin, F. Effects of soil burn severity on post-fire tree recruitment in boreal forest. Ecosystems 2006, 9, 14–31. [Google Scholar] [CrossRef]
  12. Belleau, A.; Leduc, A.; Lecomte, N.; Bergeron, Y. Forest succession rate and pathways on different surface deposit types in the boreal forest of northwestern Quebec. Ecoscience 2011, 18, 329–340. [Google Scholar] [CrossRef]
  13. Fenton, N.J.; Bergeron, Y. Stochastic processes dominate during boreal bryophyte community assembly. Ecology 2013, 94, 1993–2006. [Google Scholar] [CrossRef] [PubMed]
  14. Lecomte, N.; Simard, M.; Bergeron, Y. Effects of fire severity and initial tree composition on stand structural development in the coniferous boreal forest of northwestern Quebec, Canada. Ecoscience 2006, 13, 152–163. [Google Scholar] [CrossRef]
  15. Miyanishi, K.; Johnson, E.A. Process and patterns of duff consumption in the mixedwood boreal forest. Can. J. For. Res. 2002, 32, 1285–1295. [Google Scholar] [CrossRef]
  16. Greene, D.F.; Macdonald, S.E.; Haeussler, S.; Domenicano, S.; Noel, J.; Jayen, K.; Charron, I.; Gauthier, S.; Hunt, S.; Gielau, E.T.; et al. The reduction of organic-layer depth by wildfire in the North American boreal forest and its effect on tree recruitment by seed. Can. J. For. Res. 2007, 37, 1012–1023. [Google Scholar] [CrossRef]
  17. Glebov, F.; Korzukhin, M. Transitions between boreal forest and wetland. In A Systems Analysis of the Global Boreal Forest; Shugart, H., Leemans, R., Bonan, G., Eds.; Cambridge University Press: Cambridge, UK, 1992; pp. 241–266. [Google Scholar]
  18. Fenton, N.; Legare, S.; Bergeron, Y.; Pare, D. Soil oxygen within boreal forests across an age gradient. Can. J. Soil Sci. 2006, 86, 1–9. [Google Scholar] [CrossRef]
  19. Lecomte, N.; Simard, M.; Fenton, N.; Bergeron, Y. Fire severity and long-term biomass dynamics in coniferous boreal forests of eastern Canada. Ecosystems 2006, 9, 1215–1230. [Google Scholar] [CrossRef]
  20. Bisbee, K.E.; Gower, S.T.; Norman, J.M.; Nordheim, E.V. Environmental controls on ground cover species composition and productivity in a boreal black spruce forest. Oecologia 2001, 120, 261–270. [Google Scholar] [CrossRef]
  21. Harden, J.; Trumbore, S.; Stocks, B.; Hirsch, A.; Gower, S.; O’Neill, K.; Kasischke, E. The role of fire in the boreal carbon budget. Glob. Change Biol. 2000, 6, 174–184. [Google Scholar] [CrossRef]
  22. Terrier, A.; de Groot, W.J.; Girardin, M.P.; Bergeron, Y. Dynamics of moisture content in spruce-feather moss and spruce-Sphagnum organic layers during an extreme fire season and implications for future depths of burn in Clay Belt black spruce forests. Int. J. Wildland Fire 2014, 23, 490–502. [Google Scholar] [CrossRef]
  23. Magnussen, S.; Russo, G. Uncertainty in photo-interpreted forest inventory variables and effects on estimates of error in Canada’s National Forest Inventory. For. Chron. 2012, 88, 439–447. [Google Scholar] [CrossRef]
  24. Bergeron, Y.; Harvey, B.; Leduc, A.; Gauthier, S. Forest management guidelines based on natural disturbance dynamics: Stand- and forest-level cconsiderations. For. Chron. 1999, 75, 49–51. [Google Scholar] [CrossRef]
  25. Vincent, J.-S.; Hardy, L. L’évolution et l’extension des lacs glaciaires Barlow et Ojibway en territoire québécois. Géogr. Phys. Quat. 1977, 31, 357–372. [Google Scholar]
  26. Environment Canada. Canadian Climate Normals 1981–2010. Available online: http://climate.weather.gc.ca/climate_normals/index_e.html (accessed on 23 February 2015).
  27. Bergeron, Y.; Gauthier, S.; Flannigan, M.; Kafka, V. Fire regimes at the transition between mixedwood and coniferous boreal forest in northwestern Quebec. Ecology 2004, 85, 1916–1932. [Google Scholar] [CrossRef]
  28. Ministère des Ressources naturelles et de la Faune Forêt Québec Direction des inventaires forestiers. In Normes De Cartographie Écoforestière Troisième Inventaire Écoforestier; Gouvernement du Québec: Québec, QC, Canada, 2009; p. 109.
  29. Ministère des Ressources naturelles du Québec. Normes d'inventaire Forestier. Les Placettes échantillons Permanentes édition Provisoire; Services des inventaires forestiers: Québec, QC, Canada, 1997; p. 248. [Google Scholar]
  30. Philibert, Y.; Denis, A.; Morin, F.; Routhier, N. Les Placettes-échantillons Permanentes, Version Provisoire; Forêt Québec: Québec, QC, Canada, 2006. [Google Scholar]
  31. Simard, M.; Lecomte, N.; Bergeron, Y.; Bernier, P.Y.; Paré, D. Forest productivity decline caused by successional paludification of boreal soils. Ecol. Appl. 2007, 17, 1619–1637. [Google Scholar] [CrossRef] [PubMed]
  32. Payette, S.; Delwaide, A.; Schaffhauser, A.; Magnan, G. Calculating long-term fire frequency at the stand scale from charcoal data. Ecosphere 2012, 3. [Google Scholar] [CrossRef]
  33. Turner, M.G.; Romme, W.H.; Tinker, D.B. Surprises and lessons from the 1988 Yellowstone fires. Front. Ecol. Environ. 2003, 1, 351–358. [Google Scholar] [CrossRef]
  34. Shetler, G.; Turetsky, M.R.; Kane, E.; Kasischke, E. Sphagnum mosses limit total carbon consumption during fire in Alaskan black spruce forests. Can. J. For. Res. 2008, 38, 2328–2336. [Google Scholar] [CrossRef]
  35. Lussier, J.M.; Morin, H.; Gagnon, R. Comparison de la croissance de marcottes d'épinette noire (Picea mariana) adultes après coupe avec celle d’individus issus de graines après feu. Can. J. For. Res. 1992, 22, 1524–1535. [Google Scholar] [CrossRef]
  36. Bergeron, J.F.; Saucier, J.P.; Robitaille, A.; Robert, D. Québec forest ecological classification program. For. Chron. 1992, 68, 53–63. [Google Scholar] [CrossRef]
  37. Morgan, J.L.; Gergel, S.E.; Coops, N.C. Aerial photography: A rapidly evolving tool for ecological management. Bioscience 2010, 60, 47–59. [Google Scholar] [CrossRef]
  38. Bergeron, J.A.C.; Blanchet, F.G.; Spence, J.R.; Volney, W.J.A. Ecosystem classification and inventory maps as surrogates for ground beetle assemblages in boreal forest. J. Plant Ecol. 2012, 5, 97–108. [Google Scholar] [CrossRef]
  39. Dussault, C.; Courtois, R.; Huot, J.; Ouellet, J.P. The use of forest maps for the description of wildlife habitats: Limits and recommendations. Can. J. For. Res. 2001, 31, 1227–1234. [Google Scholar] [CrossRef]
  40. Cunningham, M.A. Accuracy assessment of digitized and classified land cover data for wildlife habitat. Landsc. Urban Plan. 2006, 78, 217–228. [Google Scholar] [CrossRef]
  41. Laamrani, A.; Valeria, O.; Bergeron, Y.; Fenton, N.; Cheng, L.Z. Distinguishing and mapping permanent and reversible paludified landscapes in Canadian black spruce forests. Geoderma 2015, 237–238, 88–91. [Google Scholar] [CrossRef]
  42. Hüttich, C.; Korets, M.; Bartalev, S.; Zharko, V.; Schepaschenko, D.; Shvidenko, A.; Schmullius, C. Exploiting growing stock volume maps for large scale forest resource assessment: cross-comparisons of ASAR- and PALSAR-based GSV estimates with forest inventory in central Siberia. Forests 2014, 5, 1753–1776. [Google Scholar] [CrossRef] [Green Version]
  43. Moroni, M.T.; Morris, D.M.; Shaw, C.; Stokland, J.N.; Harmon, M.E.; Fenton, N.J.; Merganičová, K.; Merganič, J.; Okabe, K.; Hagemann, U. Buried wood: A common yet poorly documented form of deadwood. Ecosystems 2015. [Google Scholar] [CrossRef]

