
Contribution of Driving Efficiency to Vehicle-to-Building
by
 , , and
David Borge-Diez
1,* ,
,
Pedro Miguel Ortega-Cabezas
2,
Antonio Colmenar-Santos
2 and
Jorge Juan Blanes-Peiró
1 1
Department of Electrical and Control Engineering, Universidad de León, 24071 Léon, Spain
2
Department of Electric, Electronic and Control Engineering, National Distance Education University UNED, 28040 Madrid, Spain
*
Author to whom correspondence should be addressed.
Energies 2021, 14(12), 3483; https://doi.org/10.3390/en14123483
Submission received: 26 May 2021
/
Revised: 4 June 2021
/
Accepted: 8 June 2021
/
Published: 11 June 2021
(This article belongs to the Special Issue Smart V2G for the Smart Grid)
Abstract
:Energy consumption in the transport sector and buildings are of great concern. This research aims to quantify how eco-routing, eco-driving and eco-charging can increase the amount of energy available for vehicle-to-building. To do this, the working population was broken into social groups (freelancers, local workers and commuters) who reside in two cities with different climate zones (Alcalá de Henares-Spain and Jaén-Spain) since the way of using electric vehicles is different. An algorithm based on the Here® application program interface and neural networks was implemented to acquire data of the stochastic usage of EVs of each social group. Finally, an increase in the amount of energy available for vehicle-to-building was assessed thanks to the algorithm. The results per day were as follows. Owing to the algorithm proposed a reduction ranging from 0.6 kWh to 2.2 kWh was obtained depending on social groups. The proposed algorithm facilitated an increase in energy available for vehicle-to-building ranging from 13.2 kWh to 33.6 kWh depending on social groups. The results show that current charging policies are not compatible with all social groups and do not consider the renewable energy contribution to the total electricity demand.
1. Introduction
When it comes to Spain, the transport sector is the main culprit for discharging pollutants into the atmosphere as well as consuming vast amounts of energy [1]. Recently, the private research center named Economics for Energy has confirmed this statement in its latest transport report as this trend will certainly continue in the year to come due to mobility needs [1]. As published by the Spanish Government, the energy consumption linked to transport has been increasing since 2013, just after the economic crisis from 1,074,714 TJ to 1,196,381 TJ in 2018 (latest data available) [2]. The same trend can be found for CO2 emissions which accounted for 115,402,074 t in 2013 and 128,275,075 t in 2020 [2].
Electric mobility plays a key role when reducing greenhouse emissions as shown by Pillay et al. [3]. In their research, they showed how emissions could be reduced in South Africa up to 12.3% considering a specific e-car, e-truck and e-bus penetration in the market. Bastida-Molina, Hurtado-Pérez and Peñalvo-López drew similar conclusions proving that emissions can be reduced by increasing the number of electric vehicles (EVs) and boosting the number of MW of renewable energy (RE) [4]. As they stated in their research, a 100% RE generation will be needed in order to reduce up to 74 million tons per year. Zheng et al. display in their research that, from 2011 to 2017, 682,047 plug-in EVs were sold in five provinces of China, with 18.3 billion electric vehicle kilometers traveled, 3.0 TWh of electricity consumed, a reduction in gasoline consumption of 1.6 billion liters and in CO2 emissions by 611,824 tons [5]. Despite these results, some research is focused on the impact of EVs on the environment and tries to evaluate whether they are more sustainable than traditional powertrains such as internal combustion engine vehicles. Helmers et al. made an interesting study comparing the environmental impacts of petrol, diesel engines and natural gas engines as well as EVs. They proved that producing battery cells with renewable electricity decreases the environmental impacts of EVs considerably [6]. In addition, EV impacts can be reduced even more by making a better use of mineral resources [6]. Messagie et al. proved that EVs are the most sustainable means of transport taking into account the whole life cycle [7].
EVs are useful, not only for being zero-pipeline vehicles, but for being a key element in several important techniques such as vehicle-to-grid (V2G), vehicle-to-home (V2H) and, generally speaking, vehicle-to-X connections [8,9,10,11]. V2G aims to use EVs as virtual power plants in such a way that the energy stored in EV batteries could be injected into the electricity network when needed in order to reduce consumption peaks and emissions among others [12]. As detailed by Bibak and Tekiner-Mogulkoç, V2G is currently facing several barriers and obstacles such as high investments needed to apply this technology, stochastic nature of EVs (arrival and departure times, km covered, etc.), social issues and, finally, battery degradation [13]. V2G success is based on the participation of the EV owner. Consequently, the willingness to pay is an essential concept that has already been discussed in some research [14,15]. This willingness can be defined by the maximum price that can stimulate an EV owner to inject the energy available from the EV battery into the grid. Other approaches linked to social issues were introduced by Noel et al. In their dissertation, they proved how concepts such as tinkering, testing and tacit knowledge (As discussed by Noel et al., tinkering is defined as “user modification of a technology to develop new innovations and uses”. Testing “deals intently with experimentation in technology, especially between the designers of a product or artifact and its users”. Finally, tacit knowledge “is the embodied knowledge a user may have in learning to utilize or modify a technology”) may accelerate the adoption of V2G [16]. Therefore, policies are an essential topic as discussed in several studies [17,18]. An important advantage of V2G is its capacity for better integration of the RE into the system as detailed by Mwasilu et al. [19]. At this point, it is vital to consider that the usage of V2G must be reliable; in other words, it must guarantee the system reliability, and EVs can play an important role to ensure it. To assure this, this study has proposed the usage of artificial intelligence. Rahbari et al. proposed a solution based on a neuro-fuzzy inference system in order to integrate better REs and EVs into the grid considering generation source intermittency and energy usage inconsistency [20]. Mozafar, Moradi and Amini proposed a genetic algorithm-particle swarm optimization algorithm aiming at reducing power losses, voltage fluctuations, charging and demand supplying costs as well as EV battery costs [21]. Battery degradation is an important topic to be considered when assessing the V2G participation. Recent studies show that calendar ageing is influenced by such factors as standing time, the state of charge and temperature whereas cycling ageing is affected by number of charges, the depth of discharge and charging rates [22]. Finally, regarding EVs, another important topic to be considered is aperiodic phenomena and failures in the development of the electromobility system, as they have an impact to increase or decrease the EV demand as shown by Wróblewsky et al. [23]. As shown in their research, the impact of aperiodic failures of the economic operation of a given drive system is significant, which is closely related to the nature of the speed profile, and it mainly affects the operation of the drive system. In addition to this, these phenomena affecting the operation of the selected drive system as well as environmental and infrastructural factors, determine the application of a given electromobility concept. Consequently, the highest frequency of such phenomena is, the worse economic justification for EVs in comparison to conventional solutions is [23]. Similar studies from Wróblewsky related to aperiodic phenomena which deal with other powertrains can be found in the literature [24].
Vehicle-to-building (V2B) is an important topic analyzed in this research. As stated by Odkhuu et al. V2B allows bidirectional chargers and small-scale renewable energy resources, such as photovoltaic systems and small-scale with turbines [25]. Consequently, it is possible to draw and transfer energy from/to buildings depending on the battery status. In addition to this, V2B technology offers important services to reduce the on-peak load of the building’s power consumption through peak shaving, load shifting, valley filling, better integration of RE and back-up in case of electricity shortage [25]. A V2B system is mainly composed of EVs, local distributed energy generators, critical loads, a control system in charge of building energy management (BEMS) and static storage. The aim of the BEMS is to run algorithms to obtain economic revenues, such as peak reduction [26]. Some research shows that an important reduction of fossil electricity is obtained due to the RE contribution when charging EV batteries whose energy will be transferred to the building as detailed by Buonomano et al. [27]. Zhou et al. describe in their research the main advantages of integrating EVs with RE such as cutting energy consumption of buildings, reducing the import/export pressure on the electric grid and shifting peak-loads to sub-peak or off-peak periods [28]. There are technical issues linked to V2B technology, such as the stochastic characteristic of driving schedule of EVs [29,30], which our research is focused on. Other topics are related to infrastructure and lifetime of EV batteries [31]. Ghaderi showed in his research that V2B offers significant profit even considering the battery degradation based on a scenario composed of six EVs and a V2B system [32]. Gagne et al. proved in their research that V2B is economically viable in regulated markets [33]. Similar studies linked to economic viability for similar technologies such V2G can be found in the literature [34].
All aforementioned techniques are based on EVs and, if their energy efficiency was improved, the amount of energy available to be used would be increased. Eco-driving (EDR) and eco-routing (ER) are key elements to improve energy efficiency. ER consists of finding the most energy-efficient route for a vehicle to travel between two points in such a way that an optimal way to reduce energy consumption is offered to drivers. Thibault and Sciaretta proposed an energy consumption model which considers speed fluctuations and road infrastructure to reduce consumption [35]. Some elements such as slopes have a significant influence on energy consumption and are considered in some ER algorithms [36]. Other authors have proposed the usage of evolutionary algorithms [37]. When it comes to EDR and pollutants, research is focused on this topic no matter what types of powertrains are used. Orfila, Saint-Pierre and Messias proposed an Android application based on EDR assistance for internal combustion engines [38]. Similar research can be found for hybrid cars and EVs [39,40].
Emission reduction is of great concern in the European Union (EU) and EDR and ER claim to play a key role. From 2010 to 2013 the ECOWILL (Widespread Implementation for Learner Drivers and Licensed Drivers) project which was supported by the Intelligence energy Europe Program of the European Commission was conducted. This project was linked to qualify and certify driver instructors and roll-out EDR short-duration trainings for licensed drivers [41]. Due to this project, many European countries had a strong commitment to boost EDR in driving schools. As stated by Botte et al., cooperative-intelligent transportation systems (C-ITS) represent the set of technological and functional elements that allow specific communication tasks identified as V2X [42]. C-ITS should ensure environment-friendly driving through in-vehicle technologies such as EDR as stated in the JRC Science for Policy Report published by the European Commission [43]. In addition to this, the EU offers the opportunity to manufactures to consider CO2 saving from innovative technologies which cannot prove their CO2 reduction effects under the test procedure used for vehicle type approval [44,45]. Among these innovative techniques, one can find EDR. In addition to this, one can find initiatives and projects which consider ER and EDR at the same time such as a project called REDUCTION performed in the EU [46]. This project developed state-of-art methodologies for ecological routing, ecological driving, multi-modal ecological routing, in addition to cutting edge onboard communication devices [46]. Finally, eco-charging (EC), and generally speaking, smart charging is relevant to many topics such as RE, electricity market, etc. In 2019, the EU signed the EU’s Paris Agreement commitments for reducing greenhouse emissions focused on energy performance in buildings, RE, energy efficiency and electricity market design among others [47]. In addition to this, currently, one of the most important initiatives in the EU is the European Green Deal (EGD) which aims to make Europe the first climate-neutral continent. The EGD rests on three pillars: reduction in greenhouse emissions by 2050, stimulation of economic growth without linking it to the use of resources, and the involvement of all members of society in the implementation of this new strategy [48]. To achieve the goals of the EGD, many actions need to be undertaken in all sectors of the economy, such as: investing in environmentally friendly technologies, supporting industry to innovate, rolling out cleaner, cheaper and healthier forms of private and public transport, decarbonizing the energy sector, ensuring buildings are more energy efficient and working with international partners to improve global environmental standards [49,50]. Additionally, EGD aims to improve and promote the integration of RE into the transport and electricity sectors by drawing on several research studies that exist on this subject [51,52,53,54]. As suggested by Gil-García et al., it is imperative to consider the initiatives focused on EVs if the objective is to reduce emissions and increase RE’s penetration. They have concluded that renewable penetration of at least 82% is necessary to fulfil the emissions-reduction target by 2050 [51]. According to Keller et al., large-scale deployment of RE generators and EVs is expected to reduce emissions in the electricity and transport sectors [54]. Their research shows that electrifying all of the existing EVs will require a 60% increase in the generation capacity, and the levelized cost of electricity would increase only by 9%. Consequently, emissions reduction in transport, as well as RE integration, is a topic of great concern. Research shows how EDR, ER, and EC can contribute to sustainable mobility emissions reduction in transport and better integration of RE, reduction in the energy consumption of buildings, and clean energy.
Based on aforementioned policies, research which assesses the impact of EDR, ER and EC on several techniques such as V2G, V2B and V2X should be conducted. In this current research, the authors have studied this topic in depth by taking into account several important topics. Firstly, the stochastic usage of EVs according to social groups (freelancers, local workers and commuters) as their way of using EVs is different. Consequently, the results shown in this research will be highly valuable for policymakers. Secondly, the impact of EDR, ER and EC is assessed considering climate zones in Spain. Finally, the compatibility between V2X techniques has been analyzed in Spain based on the already installed RE power. This research aims to:
- (a)
- Analyze how EDR, ER and EC based on EVs can improve the amount of energy available in a V2B system. An algorithm coded in Python based on the Here® application program interface (API) and neural networks is presented to enhance the amount of energy available for V2B [55].
- (b)
- Assess how important is to consider social groups (freelancers, local workers, commuters) to calculate the energy available for V2B as the way of using EVs is different.
- (c)
- Quantify the reduction of energy consumption of buildings.
- (d)
- Analyze if current charging policies are coherent considering the social groups representing the working population and RE contribution in the Spanish electric system.
This paper is structured like this. Section 2 describes the method, including the cities chosen for this research and the description of the algorithm used. Section 3 and Section 4 detail the results and discuss the main findings. In addition, a validity section including a sensitivity analysis and threats to validity analysis is displayed in this Section 4. Section 5 analyzes the conclusions of this study. A beta version of the application coded in Python is available in Supplementary Materials.
2. Methods
2.1. Description
The method followed in this research is depicted in Figure 1. The main idea behind this method is to choose two representative cities, buildings and residents of those buildings in order to assess the improvements introduced by EDR, ER and EC based on an algorithm implemented on Python and neural networks. Firstly, the cities subjected to this study are chosen as detailed in Section 2.2 considering climatic zones, traffic conditions and population among others. Secondly, the buildings used to measure improvements in energy consumption when using EDR and ER are selected (Section 2.3). In Section 2.4 the participants, who are residents in the chosen buildings, are determined. In Section 2.5, the algorithm based on EDR, EC and ER concepts is described in detail. In Section 2.6 the energy consumption estimates of the buildings are made, and, owing to the algorithm, the improvements are assessed. Section 2.7 displays how statistical analysis of data coming from EV consumption is made. Section 2.8 describes the equipment used in this study. Finally, EC, EDR and EC contribution is assessed.
2.2. Choice of the City
Spain has different climatic zones but, as shown in Figure 2, two of them prevail in the country: the Mediterranean and Continental ones. The former is characterized by hot dry summers and mild winters. This climate can be broken down into three subtypes. The latter is characterized by wide diurnal and seasonal variations in temperature and by low, irregular rainfall with high rates of evaporation that make the land arid. To do this study more representative, two cities belonging to different climatic zones were chosen: Alcalá de Henares and Jaén (Figure 2). Due to the differences, the consumption patterns are different.
Alcalá de Henares belongs to the Community of Madrid (Spain), 32 km away from the Spanish capital. To be more specific, this city is the second biggest one in this Community. Its population is 197,345 inhabitants in 2020 based on the data provided by the Spanish National Institute of Statistics. Generally, traffic jams are often reported in the city. Aiming at monitoring the traffic state, the townhall has installed 17 cameras mainly located downtown. This city is also interesting as it is connected to one of the most important roads to enter Madrid.
The population of Jaén which is located in the south of Spain is 112,757 in 2020 according to the data provided by the Spanish National Institute of Statistics. This city has installed cameras in strategic points aiming to improve the traffic in the city due to its high intensity.
Taking into account all the data mentioned above, a comparison between two similar cities located in different climatic zones can be made.
2.3. Choice of the Buildings
Several factors influence energy consumption when it comes to buildings. As detailed by Huebner et al., different variables such as building factors, socio-demographics, attitudes and self-reported behavior in their research affect energy consumption in different buildings [56]. To be more specific, 39% of the variability in energy consumption is linked to buildings, 24% to social-demographic variables, 14% is linked to heating behavior and only 5% is linked to attitudes and other behaviors [56]. This study was based on a sample of 924 English households.
Hueber et al. did also research about the aforementioned topic focused on electricity consumption instead of energy consumption by using an 845 English household sample [57]. In their research, they showed that 34% of variability in electric consumption came from appliance use and lighting while 21% was linked to social-demographic variables. Harputlugil and de Wilde analyzed in-depth the interaction between buildings and humans when it comes to energy consumption. In this case, one important conclusion is that lifestyle is an essential factor to be considered to understand energy consumption profiles and occupants’ patterns [58]. Pan et al. concluded the importance of having a good understanding of how occupants use the appliances of buildings in order to improve energy efficiency [59]. Moreover, like this the occupants’ behavior could be addressed to a more sustainable one. Finally, Yousefi, Gholipour et Yan proved that occupants’ behavior and envelope materials play a key role when choosing the envelop material types [60].
Considering this, the conclusions that can be drawn when choosing buildings for this study are:
- a.
- Orientation of buildings is a key factor when it comes to electricity consumption and energy in general.
- b.
- Based on the previous studies, a different occupation rate for each flat must be considered.
- c.
- As EVs will be used to assess the energy available for V2B technology, different social sectors must be considered.
- d.
- Finally, different work timetables should be considered in this study.
2.4. Choice of the Participants in This Research
In this study, the authors have proceeded to choose participants according to their professions and the number of kilometers covered. This is a key point to be taken into account in order to obtain more accurate results. Based on this, one can distinguish:
- (a)
- Freelancers. They cover a considerable number of kilometers on a daily basis according to statistical data published by different institutions [61]. Consequently, they are supposed not to inject a large amount of energy when using the V2B technology.
- (b)
- Commuters. Commuters can choose between using the public transport and their own vehicles to get to work. In this study, commuters are supposed to drive to work by using EVs. Thanks to statistical methods described in Section 2.8, the daily mileage and energy consumption will be assessed.
- (c)
- Local workers. Again, local workers can use the public transport or their vehicles to get to work. In this study, local workers who use their vehicles to go to work have been considered. In this case, the number of kilometers covered is supposed to be low. Consequently, they can contribute in a very important way when using the V2B technology.
All assumptions made about kilometers covered on a daily basis have to be confirmed based on statistical methods. Consequently, the reduction of emissions and energy consumption is influenced by the type of workers mix living in a building. The number of participants is shown in Table 1: freelancers, local workers, commuters and other occupants of the household who do not belong to these social groups (mainly students and the unemployed). Potential deviations in the assumptions earlier described are considered in the sensitivity analysis displayed in Section 4.5. In this research, we have proceeded to choose medium size or big apartments which consume vast amount of energy. It is true that houses could have been chosen, but it was not done as almost all occupants were freelancers or commuters. Consequently, we were unable to draw a conclusion in regard to other social sectors. Finally, the aim of the authors was to choose buildings with a different mix of freelancers and commuters as they are supposed to be willing to invest in EVs taking into account that local workers cover a small number of kilometers, but they could be forced to invest a large amount of money in EVs.
2.5. Algorithm
The algorithm proposed in this study is based on ER, EDR and EC concepts. It was coded by using the Here® API which offers several location services with customization of navigation maps, current traffic conditions and historical traffic data patterns among others. One of the most important features of the Here® API is the energy consumption models. Due to them, when they are properly set up, the energy consumption for a specific trip can be easily assessed, which this research does.
To better understand what the algorithm does, seven different stages can be distinguished:
- Phase 1. Consumption models are tuned. As shown later, energy consumption models must be tuned by using real time driving data of the specific driver. This factor is of great significance in order to apply the EDR concept properly.
- Phase 2. The destination is chosen by the driver. This algorithm offers a web interface that the driver can use in order to type the destination.
- Phase 3. The Here® API is in charge of determining the best route available. It must be stated that the way how the algorithm plans the best routes belongs to the Here® competence. The Here® API is called by using the python code.
- Phase 4. Here® proposes different routes based on the energy consumption models already tuned. This topic makes Here® consider EDR and ER concepts. Here® can propose three types of routes. The first one is called the fastest, which is the one that requires less time. The second one is known as the shortest, which attempts to find the one which requires that less distance is covered. The last one is the balanced one which tries to find a compromise solution between distance and time. It is only use for trucks.
- Phase 5. Once the Python code obtains the three routes and the energy consumption, the algorithm can easily determine the final energy available of the battery and if a charging process will be needed. It must be stated that the initial autonomy of the EV before starting the trip must be specified by the driver before leaving.
- Phase 6. The algorithm chooses the route which implies that energy consumption is the lowest based on the data obtained in phase 4.
- Phase 7. The python code runs a block known as the EC block. Its aim is to determine the RE contribution as well as the energy structure generation (wind energy, photovoltaic, etc.) by using different types of neural networks. Thanks to this, the drivers obtain information about when the charging process is greener and less pollutant.
The Here® API includes energy consumption models that aim to estimate energy consumption based on several parameters, such as speed and auxiliary energy consumption (heating and cooling systems, for instance). When tuning the consumption models, each parameter has to be specified in kWh and based on its dependence with the EV speed (when possible, as some of them, such as radio consumption, are not dependant on speed). These values were calculated by acquiring the data after the drivers participating in the study drove the EVs for several months. Data were collected using laptops equipped with Inca® software and input/output from the ETAS® supplier (Figure 3) [62,63]. After having analyzed the data acquisition, the consumption models can be tuned (Appendix A). Figure 4 shows how this was performed. The process consists of specifying energy losses depending on acceleration, decelerations, slopes, etc. whose values were obtained by analyzing the data acquisitions thanks to MDA software [64]. Once this is done the experiment can be reproduced easily. The Here® API can assess and return an estimate of energy consumption for the fastest, the shortest and the balanced routes. The algorithm chooses the one with less energy consumption. Finally, based on the battery capacity before the trip, the algorithm can determine if the EV will have to be charged during the trip.
Finally, the assessment of how green the charging process is must be determined by using the EC block. This part of the Python code is responsible for predicting when the charging process should be done based on the RE contribution. Owing to this, the driver will be informed about the best moment to charge EV to reduce greenhouse emissions during charging. One of the main characteristics of this block is that it can predict the energy structure (solar energy power, wind power energy, nuclear energy, and so on). The main tasks of this EC block are as follows:
- (a)
- Based on the consumption models already tuned, analyze in-depth information regarding the battery capacity and energy consumption to cover a journey set by the driver.
- (b)
- Estimate when the charging process should be done according to the analysis obtained in a.
- (c)
After executing the EC block, a score is calculated based on the RE contribution following Equation (1). The higher this score, the more the contribution of RE in charging EVs.
REc,t is the RE contribution to the total electricity demand at t (in MW), and REmax,d is the maximal RE contribution (in MW) during the day when the charging process takes place. REc,t and REmax,d are calculated using the GRU neural networks. The RE contribution is assessed as follows (2):
REc is the RE contribution (in %), RE is the total electricity generated by RE sources (in MW), and NRE is the total electricity generated by not RE, such as coal (in MW).
REc,t and REmax,d are estimated using the Spanish system operator data published daily, where one can find the CO2 generation structure and the day’s total electricity demand [69]. The electricity demand and total RE generation usually follow the same pattern. Generally speaking, only weekends and seasons are the relevant parameters to be considered. Consequently, recurrent neural networks play a key role in predicting the electricity demand for a desired period of the day to midnight in the algorithm proposed in this study. The Python code analyzes the data provided by the neural networks and assesses the maximum RE contribution of that specific day by following Equations (1) and (2).
Recurrent networks face technical issues when predicting long-term series due to the vanishing gradient problem when the recurrent neural networks are trained with gradient-based learning methods and backpropagation. These methods imply that neural network weights are updated proportionally to the partial derivative of the error function with respect to the current weight in each training iteration. The gradient may be vanishingly small. Consequently, the weight may not change, and the training process might be stopped. Long short-term memory (LSTM) or GRU networks are used to make more accurate long-term predictions. In this research, the authors chose the GRU networks since they are more computationally efficient than LSTM networks. GRU is a recurrent neural network composed of update and reset gates. Basically, these are two vectors that decide what information should be passed to the output. The special characteristic about them is that they can be trained to keep information from long ago without washing it through time or remove information irrelevant to the prediction [66,67,68].
Figure 5 shows the pseudocode of the GRU networks employed in this study. The data used to implement the GRU network were provided by the Spanish system operator for the last four years. The first three-year data are used to train the network, and the last-year data are employed to test the network performance. As usual, when implementing a neuronal network, all the input and output data must be processed to make them range between 0 and 1 to assure optimum network performance. The GRU networks were implemented using the keras package of Python. To do this, some parameters must be configured. The Sequential parameter specifies that the model is sequential, and the output of each layer is the input for the next layer. In this study, the Dropout function was employed. Dropout is a technique in which randomly selected neurons are ignored during training to temporally remove their contribution to the activation of the downstream neurons on the forward pass and ensure that weight updates are not applied to the neuron on the backward pass. This technique renders the network less sensitive to the specific weights of neurons. To analyze the error loss, the mean squared error, since it is highly recommended for regression problems, was chosen. To optimize the model using an optimization algorithm, the Adam method, due to its computational efficiency, was used.
The algorithm proposed in this study integrates a code in Python that is able to estimate the structure generation for the next two hours based on the data provided by the Spanish system operator. This estimate is made by using NAR networks, which are widely used to manipulate and predict time series [66,67,68,69,70]. NAR networks are described mathematically as follows (3):
f is the network output for a specific set of input data, ε(t) represents the error between the prediction values and the actual ones y. Finally, d is the number of delays involved in prediction. When designing neural networks, some parameters can be chosen flexibly by the designer. These parameters, it should be noted, exert a significant impact on prediction accuracy. Some of them are the number of hidden layers and the number of neurons used in each layer. Despite this flexibility, these numbers must be chosen to achieve two goals: the first is to obtain a good prediction accuracy, and the second is to avoid the network from becoming too complex. Figure 6 shows how the accuracy of the network varies depending on the delay parameter. When a high value is chosen for d, the predicted value changes very slowly. However, if d is too low, the network cannot properly follow the trend. Consequently, d must be specified empirically to take the optimal value since d determines how important the past values are for the prediction. When generating electricity using RE, sudden changes in the RE generation structure can happen due to weather conditions. These changes may not be predicted using the past values. Consequently, in some cases, NAR may not be as accurate as it should be. Therefore, in the algorithm proposed in this study, the accuracy remains on the GRU networks and not on the NAR ones. Even if it has not been implemented in the current version of the algorithm, there is a technical solution: MATLAB® can update the network and correct predictions continuously for t + 1, t + 2, t + 3, and so on, if the real value of t is known. As the Spanish system operator provides data every hour in real-time, this solution can be applied. In this research, the optimal value for d was 3. The pseudocode used for coding the NAR networks is shown in Figure 7. The trainlm function was employed to train the network to update bias and weights using the Levenberg-Marquardt optimisation. This choice was based on the fact that it is the fastest backpropagation algorithm despite its major usage of memory.
2.6. Energy Consumption of EVs
The participants were driving EVs during the winter from December 2020 to January 2021 and during the summer from June 2020 to July 2020. These dates were chosen to consider the temperature effect. The trips were randomly chosen according to the participants’ professional and personal needs. This is a key element to consider the stochastic usage of EVs.
2.7. Statistical Analysis
To establish the average consumption of EVs for each social group, a statistical analysis must be done. Owing to this, the energy available for V2B is assessed for freelancers, local workers and commuters. As per the first analysis of the data collected, these data were closed to a normal distribution. The R software, and more specifically the PASSWR package, was used to confirm this assumption [71]. The main advantage of this package is that the data can be explored in depth thanks to the statistical parameters such as kurtosis, skewness and p-value. Kurtosis is a measure of relative peakedness of distribution. It is a shape parameter that characterises the degree of the peakedness. A distribution is said to be leptokurtic when the degree of peakedness is higher than 3; it is mesokurtic when the degree of peakedness is equal to 3, and it is platykurtic when the degree of peakedness is less than 3 [72,73,74]. Skewness refers to a distortion or asymmetry that deviates from the symmetrical bell curve or normal distribution in a set of data. When the data under analysis are close to a normal distribution, the skewness is close to 0. Symmetry, it is vital to note, does not infer that the data follow a normal distribution. Consequently, the aforementioned analysis must be carefully conducted. The p-value is the probability of finding the observed, or more extreme, results when the null hypothesis (H0) of a study question is true.
In addition to the statistical parameters described earlier, several plots were used to confirm that the data analyzed follow a normal distribution: histograms, Q-Q plots and boxplot. The histogram represents the frequency of occurrence of specific phenomena that lie within a specific range of values, which are arranged in consecutive and fixed intervals. The quantile-quantile or Q-Q plot is an exploratory graphical device used to check the validity of a distributional assumption for a data set. A boxplot, sometimes called a box and whisker plot, is a type of graph used to display patterns of quantitative data [73,74].
Finally, it is essential to describe how statistical outliers were assessed. These points are the ones whose values differ significantly from the rest of the observations. This difference is linked to variability. In order to detect them, the following tools have been used: histograms, z-scores and interquartile range [74]. The z-scores method measures how many standard deviations an element is from the mean. The interquartile range is a measure of statistical dispersion, being equal to the difference between 75th and 25th percentiles, or between upper and lower quartiles. As the data were analyzed on a daily basis, statistical outliers were mainly linked to unusual traffic conditions such as traffic accidents.
2.8. Equipment Used
The means employed were the following:
- Vehicle control units (VCU) designed by important European suppliers.
- EVs provided with a 40 kWh were employed. Their autonomy was 250 km with a maximum speed of 144 km/h.
- The INCA® software was used since it was necessary to read the memory positions of the VCU [62].
- The MDA software was employed to visualize the dat file and analyze the trend of the software variables [64].
- The ES411 and ES592 modules from ETAS® were used since they allowed connecting the laptop to EVs to record all the software variables specified using Inca®.
- Power meters. Manufacturer Gafild. Operating voltage 230 AC. Max. current 16 A.
3. Results
3.1. EV Consumption
The algorithm proposed in this research aims to improve energy efficiency by considering the stochastic usage of EVs. To do this, many measurements were performed on social groups such as freelancers, local workers and commuters. To assess each social group’s average energy consumption when using and not using the algorithm, the collected data were statistically analyzed as described in Section 2.8. The results obtained after this analysis are depicted in Table 2 for Alcalá de Henares and in Table 3 for Jaén. First of all, it must be taken into account that all these data are close to a normal distribution. This assumption was confirmed by assessing different parameters such as skewness, kurtosis and p-value. When it comes to freelancers, skewness is close to zero. Consequently, the distribution is symmetric. Kurtosis aims to prove that the data distribution tails are not dissimilar from normal distribution ones. The p-value represents the null hypothesis: the data follow a normal distribution. When the p-value is greater than 0.05, the null hypothesis is confirmed. One important characteristic of skewness and kurtosis is that they are sensitive to the sample size. Therefore, the Q-Q plots and histograms were used to confirm that the data collected followed a normal distribution. Based on this statistical analysis, the hypothesis Ho was confirmed. In addition to energy consumption, it is essential to establish the number of kilometers by following the same statistical method. Regarding freelancers, the number of kilometers was found to range from 95 km to 110 km per day. When it comes to local workers and commuters, the number of kilometers covered varies from 57 km to 70 km per day. Finally, commuters cover between 4 km and 6 km per day. When it comes to Jaén, the number of kilometers travelled by freelancers ranges between 78 km and 90 km a day. Regarding commuters, they drive between 3.5 km and 5.5 km daily. Finally, local workers cover between 3.2 km and 5.3 km a day. The main differences between both cities are analyzed in Section 4.1. These results are complementary to other studies. Zhang et al. detailed how large-scale EV development impacts the stability of electric grid as well as decisions linked to the construction of new facilities (charging facilities). They conducted a depth-study of stochastic usage of EVs based on several factors such as daily distance travelled, energy consumption, etc. [76]. Similar research was done by Shi et al. showing interesting data about the average speed and consumption based on stochastic usage of EVs [77]. The impact on the electricity grid can also be stochastic as shown by Schey, Scoffield and Smart [78]. All this research did not consider social groups which are a key element for future energy policies due to the fact that their usage of EVs is different as proved in this study.
3.2. Energy Consumption of Buildings
In order to verify the improvements introduced by the algorithm based on EC, ER and EDR, it is essential to measure energy consumption of the buildings chosen for this case-study. To do this, smart counters and power meters were installed in each participant’s apartment. Consequently, it was possible to measure the energy consumption of all facilities of the apartments such as: electric heating, air conditioning, lighting, TV sets, fridges, microwave ovens, vitroceramic hobs, washing machines and dishwashers. All these measurements were performed in the climatic areas described in Section 2.
When analyzing the Spanish electricity demand curve, there are two main consumption peaks. The first one is usually between 12 a.m. and 1 p.m. and the other one from 8 p.m. to 10 p.m. depending on the season. There are two main differences between the summer and the winter curves. Firstly, the electricity demand is lower in the summer. Secondly, the peak between 12 a.m. and 1 p.m. is higher than the other one in the summer. Therefore, it is important to check the energy consumption pattern of the buildings chosen in this case study. Figure 8 shows the winter energy consumption for buildings A, B and C which are located in Alcalá de Henares. As one can see, the energy consumption trend is similar to the Spanish one as there are two peaks present. However, there are important differences. Firstly, from 4 p.m. to 6 p.m. the energy consumption decreases as the energy consumption patterns of buildings A and C follow the Spanish one. Nevertheless, it is not the case for building B. Secondly, the trend followed by buildings A and C has similarities comparing to the Spanish trend, but this first energy consumption peak lasts less time than expected. Figure 9 shows results during summertime. As expected, two consumption peaks are present and the first one is the most important. Again, in this case, building B has a different behavior in comparison with buildings A and C as its consumption is higher during the off-peak periods. As explained in the discussion section, these particularities of electricity demand curves can be analyzed considering the number of occupants of the apartments as well as the diversity of social groups they belong to. The reader can find the curves for the second climatic zone in the Supplementary Data as the conclusions are similar except for the fact that total energy consumption changes slightly. This variation is totally normal as in Jaén the consumption is slightly lower as stated by the Institute of Diversification and Energy Saving of Spain. This analysis was done in the winter and in the summer when temperatures are the coldest and the hottest, respectively. The conditions of the electricity system cannot affect the results of the experiment.
Variations of energy consumption depending on climatic zones have been studied widely in the scientific literature [79,80,81,82]. Energy consumption profile is an essential topic to be considered as shown in a lot of research. Csoknyai et al. analyzed in detail energy consumption and household composition (couple with children, couples without children, single, single with children and other) [83]. Kavousian, Rajagopal and Fisher focused their efforts on analyzing pattern energy consumptions of buildings based on classifying the occupants into age groups [84]. Laaroussi et al. conducted research into how occupant presence and behavior influence energy consumption [85]. However, the research does not take into account social groups, occupants present, EDR, EC and ER at the same time. Table 4 quantifies how energy consumption of the building can be reduced when all these factors are considered at the same time. As one can see, the contribution to V2B is different for each building due to the number of freelancers, local workers and commuters. Consequently, it is essential to discuss this topic in the next section. Although the results depicted in these two tables imply that all participants in this research contribute to V2B, this assumption might be false. Therefore, a sensitivity analysis is done in Section 4.5.
4. Discussion
4.1. EV Consumption
The energy consumption of EVs is stochastic as already proved in the professional literature [76,77]. This research aims to show that social groups are so important that they should be considered when analysing the stochastic usage of EVs. As described in Section 3.1, freelancers covered many kilometers on a daily basis. Firstly, the results for Alcalá de Henares show that even though freelancers’ contribution to V2G and V2B may not be important, ER and EDR can improve energy efficiency up to 8.4%. Due to the fact that freelancers are a much consuming energy social group when it comes to EV usage, they are forced to participate in V2G or V2B, but not in both of them as discussed in Section 4.3. Regarding commuters, the energy efficiency enhancement can reach 14.3% owing to the algorithm proposed in this study. In addition, the amount of energy available for V2B participation is high and owing to ER and EDR it is even higher. Finally, local workers would be the biggest contributors to V2B if they had an intention to buy EVs. However, EVs high prices can pose a serious obstacle for a large number of local workers. It must also be stated that the energy efficiency gain for this social sector is low (0.6 kWh). These data are valuable for policy makers as they show the social groups which might contribute most to V2G and V2B technologies. When it comes to Jaén and using the algorithm, one can find improvements in energy efficiency up to 8.1%, 10.5% and 12.2% for freelancers, commuters and local workers, respectively. It is important to remark that the number of kilometers covered in both cities for each social sector are similar. After having analyzed the data collected during the trips, two conclusions are drawn. Firstly, people are more likely to get caught in traffic jams in Alcalá de Henares than in Jaén. Consequently, a higher consumption is expected. Secondly, the difference between both cities is more remarkable in the winter. As Alcalá is colder than Jaén, EV performance is affected by temperature. This conclusion is aligned with other research. Sagaria, Neto and Baptista proved that energy consumption can vary between 25% and 30% depending on the location where the EV is used- in the northern or southern countries [86]. On the other hand, the difference between both cities is not big enough in order to find significant distinctions in EV charging patterns contrary to the conclusions drawn by Yan et al. [87].
4.2. Energy Available for V2B
The number of kWh available for V2B purposes depends on three factors. The first one is the share of EVs in the market. The second one is energy efficiency linked to EVs. This parameter should be improved by means of EDR and ER in order to increase the amount of energy available to be used for V2B. Finally, the third one is the social groups to which the participants belong to, as the way of using EVs is completely different. This research is focused on the two last concepts. As shown in Figure 10, in the buildings chosen for this case-study, most of the people belong to the social groups of freelancers and commuters. Buildings D and E are the ones which achieve more significant savings in energy due to the enhancement in terms of EV energy consumption discussed in the previous section. As detailed earlier, freelancers fail to contribute in a significant way owing to the number of kilometers covered. However, even if local workers are the less important group, on some occasions such as the case of building B, they can contribute in a very important way as the number of kilometers covered is very low and, consequently, the energy available for V2B is high. When it comes to the usage of the algorithm proposed in this research, improvements which range from 13.2 kWh to 33.6 kWh can be obtained on a daily basis based on the results depicted in Figure 11.
Considering Figure 10 and Figure 11, commuters and local workers are the most important contributors to V2B. Consequently, policies should be addressed in order to increase the EV presence in these two social groups. Of course, freelancers are an important group to be considered based on an environmental point of view to reduce emissions but not based on their potential contribution to V2B.
The energy consumption which took place when freelancers, commuters and local workers were outside was not considered. Therefore, the household composition studied by Csoknyai et al. is not considered [83]. As shown in Figure 12, local workers make the first energy consumption peak last more time (Buildings A and B). Secondly, local workers and commuters make the second consumption peak earlier. All these consumption peaks can be reduced due to EDR and ER algorithm.
The energy self-sufficiency of the buildings subjected to this study depends on the participation of the EV owners as shown in the sensitivity analysis (Section 4.6.1).
4.3. Social Group Presence in Buildings
During this research, the authors have established which social groups contribute more to V2B. Consequently, it is of paramount importance to establish the percentage of people who belong to each social group. A binomial distribution was employed to determine the percentage of workers who belong to each social group:
- (a)
- Set an initial hypothesis based on the number of people belonging to each social groups. To do this, a sample of five buildings for each city was chosen.
- (b)
- A second sample was used in order to confirm or reject the hypothesis by using Equations (4) and (5):n is the sample size, is the probability of success for the sample considered, is the probability of confirmation of the hypothesis, and α is the significant level.
The results obtained are shown in Table 5 and Table 6. Based on the data obtained in these tables and the consumption estimate shown in Table 2 and Table 3, it is important to focus policies on these two social groups in order to increase kWh available to reduce electricity consumption in buildings.
4.4. RE and V2B
It is important to check the trend of electricity price, RE daily contribution and EV charging price on the Spanish market. As shown in Figure 13 and Figure 14, the EV charging price is set by the Government and from 1 p.m. is more expensive than the electricity price in the sport market. When it comes to RE contribution, the highest value is reached between 1 p.m. and 8 p.m. During the night, when EVs are supposed to be charged, the contribution is not extremely high comparing to the rest of the day. EVs are charged when RE contribution and the price are low. This policy is contradictory as EVs contribute to the reduction of pollution because their energy may be used to reduce the peak energy consumption from 7 p.m. to 10 p.m., but to do this, EVs must be charged before 12 a.m. At that moment, the RE contribution is the lowest. The main conclusion is that promotion of RE to decarbonize the electricity system, and policy prices are as important as policies to promote EVs penetration into the market or charging points implementation. Like this, the charging process can be performed when RE contribution is high. Regarding RE in Spain, the number of MW available has been almost stable since 2012. It must be stated that establishing the optimal sizing of RE facilities under high EV integration is a relevant topic researched in several studies [87].
One important point is that V2B must be compatible with other techniques, such as V2G. In this case, some important remarks must be made. Based on the total amount of energy available to be used for V2G, freelancers would tend to participate in V2B rather than in V2G, as they get more profit when using this energy to reduce their home energy consumption. When it comes to local workers, they could participate in V2G and V2B. The main issue is that they are not the most representative social sector. Finally, commuters seem to be a social sector that could also take advantage of both technologies. In order to extend the number of people who could participate in V2G and V2B, the fee to charge EVs in the second off-peak consumption should be reduced similar to Figure 15. To do this, RE should be promoted and increased in order to support energy demand to charge EVs [88]. Some research deals with the RE integration topics when using EVs. Pearre and Swan concludes that “With a 10% adoption rate of EVs, time-of-day charging increased local renewable energy usage by 20% and enables marginal wind energy converters to upgrade” [89]. Colmenar et al. proposed a novel grid technique in order to optimize the operation of RE and EVs to increase penetration of RE [90]. In our current research, RE, EDR, ER and EC are considered simultaneously. It is essential to highlight the importance of EC block which aim is to determine the energy structure generation as well as the RE contribution. Consequently, the EV owners know in advance, when it is the best moment to charge their vehicle based on an environmental point of view. As described in Section 2, this block can provide accurate forecasts owing to the implementation of neural networks. It must be stated that the network performance was assessed with an average value of 2.25 × 10⁻⁷. Finally, the algorithm presented in this research uses the Open Charge Map® API which aims to inform the driver where the closest charging point is. Therefore, by using the information provided by this API, the energy consumption estimate assessed by the Here® API and the consumption models tuned properly, the driver can decide if it is possible to postpone the EV charging to a better slot in which the RE contribution is higher. Consequently, the Open Charge Map® API is also useful to make the charging process greener.
4.5. Policy Implications
As discussed earlier in this paper, EDR, ER and EC are not subject to policies in many cases. Only some recommendations have been made and a few initiatives taken as detailed in the introduction [41,42,43]. Taking into account the results of this research and the main goals of important initiatives such as the EGD, ER, EDR and EC must play a key role vis-à-vis addressing important issues such as the better integration of the various measures to be adopted for RE and emissions reduction. Additionally, it must be highlighted that although algorithms, such as the one described in this research, have low implementation costs, their contribution to V2B is significant. Finally, the authors recommend factoring in social groups while developing policies as the usage of EVs is different and the contribution therefore to V2B can have significant variations. Hence, it is essential to promote EVs with the help of social groups even as the needed investments continue to be made in new RE facilities.
4.6. Validity of This Research
4.6.1. Sensitivity Analysis
It is important to assess the contribution of EDR and ER to V2B taking into account the participation of EV owners. Several factors such as battery degradation and policies influence this participation. In this sensitivity analysis, several participations have been considered when the number of participants was between 25% and 75%. As Figure 16 shows similar results as Figure 11. The gain goes from 4.225 kWh (25% for Building F) to 106.775 kWh (75% for Building E) on a daily basis.
4.6.2. Threats to Validity
In this section, the actions taken to reduce these threats are displayed in Table 7.
5. Conclusions
Emissions linked to the transport sector and building are of great concern nowadays. Consequently, improvement in both fields must be performed. This research proposed an algorithm based on the Here® application interface (one of the most important digital maps suppliers), neural networks, electric vehicles, eco-routing, eco-driving and eco-charging concepts. By using this algorithm, the increase in energy available to be used in vehicle-to-building technology was assessed. However, there is one important topic to analyze the energy available such as the stochastic usage of electric vehicles. To be more specific, it is essential to classify the working population into social groups such as freelancers, local workers and commuters. Due to this, many data were collected in real-driving conditions from drivers who belonged to different social groups as their way of driving is different. Finally, all these data acquisitions were conducted in two cities (Alcalá de Henares—Madrid-Spain and Jaén-Spain) which are located in different climatic zones. The main conclusions that can be drawn are:
- (a)
- Energy savingsAs shown in Section 3.1, this algorithm introduces reduction in energy consumption when driving electric vehicles. As it could be expected, energy consumption is different depending on the social group. Consequently, the contribution to vehicle-to-building technology differs. Regarding Alcala de Henares, energy efficiency reaches 2.2 kWh for freelancers per day. When it comes to commuters, this gain reaches 1.5 kWh a day and, finally, 0.6 kWh and for local workers on a daily basis. Regarding Jaén, the savings are similar. The energy efficiency reaches 1.9 kWh for freelancers per day. When it comes to commuters, this gain is 1 kWh on a daily basis and, finally, 0.6 kWh for local workers a day.
- (b)
- Contribution to vehicle-to-buildingVehicle-to-building is based on the principle that the electric vehicle owner will participate and inject energy stored in the electric vehicle battery into the building. However, it is essential to determine energy available and, again, the fact of taking into account social groups influences energy available to be used for vehicle-to-grid technique. Regarding Alcalá de Henares, energy available ranges between 112 kWh and 144 kWh a day depending on the social group mix existing in the building. In regard to Jaén, energy available ranges between 76 kWh and 152 kWh a day depending on the social group mix existing in the building. Finally, it must also be taken into account that energy consumption pattern may change depending on the social groups that occupants belong to as discussed in Section 4.2.
- (c)
- Charging policiesIn order to make the charging process greener, it is necessary to charge electric vehicles when renewable energy contribution is higher. Based on the analysis of building consumption done in this research, the energy consumption pattern can differ depending on the social group that the occupant belongs to. The algorithm provided in this research can determine when the contribution of renewable energy is higher. Due to this, when its contribution is higher, the charging price is more expensive. This paper proposes possible changes to charging fees to make vehicle-to-building and vehicle-to-grid compatible as discussed in Section 3.2 and Section 4.4. In order to apply this fee, the increase in megawatt of renewable energy installed is as important as increase in the number of electric vehicles.
Supplementary Materials
A beta version of the application coded in Python is provided at https://www.mdpi.com/article/10.3390/en14123483/s1. The full version cannot be provided as the company which collaborated in this study has not authorized it. The measurements obtained when driving Evs are not provided as the company which collaborated in this study has not authorized it.
Author Contributions
D.B.-D. and P.M.O.-C. were primarily responsible for creating this manuscript. D.B.-D. and P.M.O.-C. were responsible for creating the application in Python and obtained all measurements performed in this research. A.C.-S. and J.J.B.-P. analyzed the data obtained as well as policies and collected data and information from the Spanish System Operator. All authors have read and agreed to the published version of the manuscript.
Funding
This research received no external funding.
Institutional Review Board Statement
Not applicable.
Informed Consent Statement
Not applicable.
Data Availability Statement
Not applicable.
Conflicts of Interest
The authors declare no conflict of interest.
Appendix A. How to Configure Calls to Here® API
When assessing the best route to go from A to B, Here® API is a very powerful tool as it can provide a lot of information linked to the established route. The way of calling this API when coding in Python is easy. However, some factors must be taken into account. Figure A1 depicts the pseudocode employed in this case-study in order to call the Here® API. As one can see, one important parameter is known as PARAM which is composed of several variables such as:
- (a)
- apiKey. It is a key that must be generated when someone is registered in the Here® developers’ web. In Figure A1, the key is represented by XXXX and, of course, the reader should type their own key.
- (b)
- When going to A to B, waypoint0 and waypoint1 represent the latitude and longitude data of A and B. These values must be stored in Python by using a dictionary (location_coor). The main question is how to obtain the latitude and longitude. In this study, Geopy was used.
- (c)
- Mode. For a more accurate assessment of the route, the reader should specify the type of route (the fastest, the shortest) and traffic state.
- (d)
- In Section 2, the way of tuning the consumption model was explained. The Python code sends energy consumption models to Here® API by employing consumptionmodel and consumptiondetails variables.
Figure A1.
Pseudocode to obtain the desired Here® answer.

When the Here® API determines the best route, it sends a json file to the Python code. When analyzing the structure of the file provided by Here®, a lot of important information can be collected such as traffic condition, time needed to cover the route, etc. (Figure A2). Based on these parameters, the average values of some parameters such as speed or energy consumption can be estimated easily.
Figure A2.
Here® answer. Json format.

References
- Economics for energy. Available online: https://eforenergy.org/docpublicaciones/informes/informe_transporte.pdf (accessed on 7 March 2021).
- Spanish Ministry of Economics. Available online: https://www.miteco.gob.es/es/calidad-y-evaluacion-ambiental/publicaciones/02_16_transporte_pae2017_tcm30-498096.pdf (accessed on 7 March 2021).
- Pillay, N.; Brent, A.; Musango, J. Affordability of battery electric vehicles based on disposable income and the impact on provincial residential electricity requirements in South Africa. Energy 2019, 171, 1077–1087. [Google Scholar] [CrossRef]
- Bastida-Molina, P.; Hurtado-Pérez, E.; Peñalvo-López, E.; Moros-Gómez, M.C. Assessing transport emissions reduction while increasing electric vehicles and renewable generation levels. Transp. Res. Part D Transp. Environ. 2020, 88, 102560. [Google Scholar] [CrossRef]
- Zheng, J.; Sun, X.; Jia, L.; Zhou, Y. Electric passenger vehicles sales and carbon dioxide emission reduction potential in China’s leading markets. J. Clean. Prod. 2020, 243, 118607. [Google Scholar] [CrossRef]
- Helmers, E.; Dietz, J.; Weiss, M. Sensitivity Analysis in the Life-Cycle Assessment of Electric vs. Combustion Engine Cars under Approximate Real-World Conditions. Sustainability 2020, 12, 1241. [Google Scholar] [CrossRef] [Green Version]
- Messagie, M.; Boureima, F.-S.; Coosemans, T.; Macharis, C.; Van Mierlo, J. A Range-Based Vehicle Life Cycle Assessment Incorporating Variability in the Environmental Assessment of Different Vehicle Technologies and Fuels. Energies 2014, 7, 1467–1482. [Google Scholar] [CrossRef]
- Iwafune, Y.; Ogimoto, K. Economic Impacts of the Demand Response of Electric Vehicles Considering Battery Degradation. Energies 2020, 13, 5771. [Google Scholar] [CrossRef]
- Vopava, J.; Koczwara, C.; Traupmann, A.; Kienberger, T. Investigating the Impact of E-Mobility on the Electrical Power Grid Using a Simplified Grid Modelling Approach. Energies 2019, 13, 39. [Google Scholar] [CrossRef] [Green Version]
- Thompson, A.W.; Perez, Y. Vehicle-to-Everything (V2X) energy services, value streams, and regulatory policy implications. Energy Policy 2020, 137, 111136. [Google Scholar] [CrossRef]
- Pearre, N.S.; Ribbering, H. Review of research on V2X technologies, strategies, and operations. Renew. Sustain. Energy Rev. 2019, 105, 61–70. [Google Scholar] [CrossRef]
- Bibak, B.; Tekiner-Moğulkoç, H. A comprehensive analysis of Vehicle to Grid (V2G) systems and scholarly literature on the application of such systems. Renew. Energy Focus 2021, 36, 1–20. [Google Scholar] [CrossRef]
- Bibak, B.; Tekiner-Mogulkock, H. Influences of vehicle to grid (V2G) on power grid: An analysis by considering associated stochastic parameters explicitly. Sustain. Energy Grids Netw. 2021, 26, 100429. [Google Scholar] [CrossRef]
- Parsons, G.R.; Hidrue, M.K.; Kempton, W.; Gardner, M.P. Willingness to pay for vehicle-to-grid (V2G) electric vehicles and their contract terms. Energy Econ. 2014, 42, 313–324. [Google Scholar] [CrossRef]
- Maeng, K.; Ko, S.; Shin, J.; Cho, Y. How Much Electricity Sharing Will Electric Vehicle Owners Allow from Their Battery? Incorporating Vehicle-to-Grid Technology and Electricity Generation Mix. Energies 2020, 13, 4248. [Google Scholar] [CrossRef]
- Noel, L.; de Rubens, G.Z.; Kester, J.; Sovacool, B.K. Leveraging user-based innovation in vehicle-to-X and vehicle-to-grid adoption: A Nordic case study. J. Clean. Prod. 2021, 287, 125591. [Google Scholar] [CrossRef]
- Geske, J.; Schumann, D. Willing to participate in vehicle-to-grid (V2G)? Why not! Energy Policy 2018, 120, 392–401. [Google Scholar] [CrossRef]
- Kester, J.; Noel, L.; de Rubens, G.Z.; Sovacool, B.K. Promoting Vehicle to Grid (V2G) in the Nordic region: Expert advice on policy mechanisms for accelerated diffusion. Energy Policy 2018, 116, 422–432. [Google Scholar] [CrossRef]
- Mwasilu, F.; Justo, J.J.; Kim, E.-K.; Do, T.D.; Jung, J.-W. Electric vehicles and smart grid interaction: A review on vehicle to grid and renewable energy sources integration. Renew. Sustain. Energy Rev. 2014, 34, 501–516. [Google Scholar] [CrossRef]
- Rahbari, O.; Vafaeipour, M.; Omar, N.; Rosen, M.A.; Hegazy, O.; Timmermans, J.-M.; Heibati, S.; Bossche, P.V.D. An optimal versatile control approach for plug-in electric vehicles to integrate renewable energy sources and smart grids. Energy 2017, 134, 1053–1067. [Google Scholar] [CrossRef]
- Mozafar, M.R.; Moradi, M.H.; Amini, M.H. A simultaneous approach for optimal allocation of renewable energy sources and electric vehicle charging stations in smart grids based on improved GA-PSO algorithm. Sustain. Cities Soc. 2017, 32, 627–637. [Google Scholar] [CrossRef]
- Gao, Y.; Jiang, J.; Zhang, C.; Zhang, W.; Jiang, Y. Aging mechanisms under different state-of-charge ranges and the multi-indicators system of state-of-health for lithium-ion battery with Li(NiMnCo)O2 cathode. J. Power Sources 2018, 400, 641–651. [Google Scholar] [CrossRef]
- Wróblewski, P.; Drożdż, W.; Lewicki, W.; Miązek, P. Methodology for Assessing the Impact of Aperiodic Phenomena on the Energy Balance of Propulsion Engines in Vehicle Electromobility Systems for Given Areas. Energies 2021, 14, 2314. [Google Scholar] [CrossRef]
- Wróblewski, P.; Drożdż, W.; Lewicki, W.; Dowejko, J. Total Cost of Ownership and Its Potential Consequences for the Development of the Hydrogen Fuel Cell Powered Vehicle Market in Poland. Energies 2021, 14, 2131. [Google Scholar] [CrossRef]
- Odkhuu, N.; Lee, K.-B.; Ahmed, M.A.; Kim, Y.-C. Optimal Energy Management of V2B with RES and ESS for Peak Load Minimization. Appl. Sci. 2018, 8, 2125. [Google Scholar] [CrossRef] [Green Version]
- García-Villalobos, J.; Zamora, I.; Martín, J.S.; Junquera, I.; Eguía, P. Delivering Energy from PEV batteries: V2G, V2B and V2H approaches. Renew. Energy Power Qual. J. 2015, 89–94. [Google Scholar] [CrossRef]
- Buonomano, A.; Calise, F.; Cappiello, F.; Palombo, A.; Vicidomini, M. Dynamic analysis of the integration of electric vehicles in efficient buildings fed by renewables. Appl. Energy 2019, 245, 31–50. [Google Scholar] [CrossRef]
- Zhou, Y.; Cao, S.; Hensen, J.L.; Lund, P.D. Energy integration and interaction between buildings and vehicles: A state-of-the-art review. Renew. Sustain. Energy Rev. 2019, 114, 109337. [Google Scholar] [CrossRef]
- Zhang, X.; Zou, Y.; Fan, J.; Guo, H. Usage pattern analysis of Beijing private electric vehicles based on real-world data. Energy 2019, 167, 1074–1085. [Google Scholar] [CrossRef]
- Wang, G.; Makino, K.; Harmandayan, A.; Wu, X. Eco-driving behaviors of electric vehicle users: A survey study. Transp. Res. Part D Transp. Environ. 2020, 78, 102188. [Google Scholar] [CrossRef]
- Tchagang, A.; Yoo, Y. V2B/V2G on Energy Cost and Battery Degradation under Different Driving Scenarios, Peak Shaving, and Frequency Regulations. World Electr. Veh. J. 2020, 11, 14. [Google Scholar] [CrossRef] [Green Version]
- Ghaderi, A.; Nassiraei, A.A.F. The economics of using electric vehicles for vehicle to building applications considering the effect of battery degradation. In Proceedings of the IECON 2015—41st Annual Conference of the IEEE Industrial Electronics Society, Yokohama, Japan, 9–12 November 2015; Institute of Electrical and Electronics Engineers (IEEE): Piscataway, NJ, USA, 2015; pp. 3567–3572. [Google Scholar]
- Gagné, C.; Tanguy, K.; Lopez, K.L.; Dubois, M.R. Vehicle-to-Building Is Economically Viable in Regulated Electricity Markets. In Proceedings of the 2015 IEEE Vehicle Power and Propulsion Conference (VPPC), Montreal, QC, Canada, 19–22 October 2015; Institute of Electrical and Electronics Engineers (IEEE): Piscataway, NJ, USA, 2015; pp. 1–6. [Google Scholar]
- Colmenar-Santos, A.; Borge-Diez, D.; Ortega-Cabezas, P.M.; Míguez-Camiña, J. Macro economic impact, reduction of fee deficit and profitability of a sustainable transport model based on electric mobility. Case study: City of León (Spain). Energy 2014, 65, 303–318. [Google Scholar] [CrossRef]
- De Nunzio, G.; Thibault, L.; Sciarretta, A. A model-based eco-routing strategy for electric vehicles in large urban networks. In Proceedings of the 2016 IEEE 19th International Conference on Intelligent Transportation Systems (ITSC), Rio de Janeiro, Brazil, 1–4 November 2016; Institute of Electrical and Electronics Engineers (IEEE): Piscataway, NJ, USA, 2016; pp. 2301–2306. [Google Scholar]
- Sureth, A.; Moll, V.; Nachtwei, J.; Franke, T. The golden rules of ecodriving? The effect of providing hybrid electric vehicle (HEV) drivers with a newly developed set of ecodriving-tips. Transp. Res. Part F Traffic Psychol. Behav. 2019, 64, 565–581. [Google Scholar] [CrossRef]
- Chakraborty, N.; Mondal, A.; Mondal, S. Intelligent charge scheduling and eco-routing mechanism for electric vehicles: A multi-objective heuristic approach. Sustain. Cities Soc. 2021, 69, 102820. [Google Scholar] [CrossRef]
- Orfila, O.; Pierre, G.S.; Messias, M. An android based ecodriving assistance system to improve safety and efficiency of internal combustion engine passenger cars. Transp. Res. Part C Emerg. Technol. 2015, 58, 772–782. [Google Scholar] [CrossRef]
- Franke, T.; Arend, M.G.; McIlroy, R.; Stanton, N. Ecodriving in hybrid electric vehicles – Exploring challenges for user-energy interaction. Appl. Ergon. 2016, 55, 33–45. [Google Scholar] [CrossRef]
- Thijssen, R.; Hofman, T.; Ham, J. Ecodriving acceptance: An experimental study on anticipation behavior of truck drivers. Transp. Res. Part F Traffic Psychol. Behav. 2014, 22, 249–260. [Google Scholar] [CrossRef]
- ECODRIVING—CIECA. Available online: https://www.cieca.eu/sites/default/files/documents/projects_and_studies/ECOWILL_FINAL_REPORT.pdf%20 (accessed on 28 April 2021).
- Botte, M.; Pariota, L.; D’Acierno, L.; Bifulco, G.N. An Overview of Cooperative Driving in the European Union: Policies and Practices. Electronics 2019, 8, 616. [Google Scholar] [CrossRef] [Green Version]
- JRC Science for Policy Report. The r-evolution of driving: From Connected Vehicles to Coordinated Automated Road Transport (C-ART). Part I: Framework for safe & efficient Coordinated Automated Road Transport (C-ART) system. Available online: https://publications.jrc.ec.europa.eu/repository/handle/JRC106565 (accessed on 30 May 2021).
- Malfettani, S.; Lodi, C.; Huld, T.; Bonnel, P. Latest Developments on the European Eco-innovation Scheme for Reducing CO2 Emissions from Vehicles: Average Input Data for Simplified Calculations. Transp. Res. Procedia 2016, 14, 4113–4121. [Google Scholar] [CrossRef]
- European Union. Available online: https://circabc.europa.eu/sd/a/bbf05038-a907-4298-83ee-3d6cce3b4231/technical (accessed on 3 May 2021).
- European Union. Available online: http://www.reduction-project.eu/ (accessed on 5 May 2021).
- Clean Energy for All Europeans Package. Available online: https://ec.europa.eu/energy/topics/energy-strategy/clean-energy-all-europeans_en (accessed on 18 November 2020).
- European Union. Available online: https://eur-lex.europa.eu/legal-content/EN/TXT/?qid=1576150542719&uri=COM%3A2019%3A640%3AFIN (accessed on 4 May 2021).
- European Union. 2019. Available online: https://ec.europa.eu/info/strategy/priorities-2019-2024/european-green-deal_en (accessed on 10 May 2021).
- European Union. 2019. Available online: https://ec.europa.eu/info/files/annex-roadmap-and-key-actions_en (accessed on 3 May 2021).
- Gil-García, I.; García-Cascales, M.; Dagher, H.; Molina-García, A. Electric Vehicle and Renewable Energy Sources: Motor Fusion in the Energy Transition from a Multi-Indicator Perspective. Sustainability 2021, 13, 3430. [Google Scholar] [CrossRef]
- Tucki, K.; Orynycz, O.; Świć, A.; Mitoraj-Wojtanek, M. The Development of Electromobility in Poland and EU States as a Tool for Management of CO2 Emissions. Energies 2019, 12, 2942. [Google Scholar] [CrossRef] [Green Version]
- Bellocchi, S.; Manno, M.; Noussan, M.; Prina, M.G.; Vellini, M. Electrification of transport and residential heating sectors in support of renewable penetration: Scenarios for the Italian energy system. Energy 2020, 196, 117062. [Google Scholar] [CrossRef]
- Keller, V.; English, J.; Fernandez, J.; Wade, C.; Fowler, M.; Scholtysik, S.; Palmer-Wilson, K.; Donald, J.; Robertson, B.; Wild, P.; et al. Electrification of road transportation with utility controlled charging: A case study for British Columbia with a 93% renewable electricity target. Appl. Energy 2019, 253, 113536. [Google Scholar] [CrossRef]
- Here® API. Available online: https://developer.here.com/ (accessed on 7 March 2021).
- Huebner, G.M.; Hamilton, I.; Chalabi, Z.; Shipworth, D.; Oreszczyn, T. Explaining domestic energy consumption—The comparative contribution of building factors, socio-demographics, behaviours and attitudes. Appl. Energy 2015, 159, 589–600. [Google Scholar] [CrossRef] [Green Version]
- Huebner, G.; Shipworth, D.; Hamilton, I.; Chalabi, Z.; Oreszczyn, T. Understanding electricity consumption: A comparative contribution of building factors, socio-demographics, appliances, behaviours and attitudes. Appl. Energy 2016, 177, 692–702. [Google Scholar] [CrossRef] [Green Version]
- Harputlugil, T.; de Wilde, P. The interaction between humans and buildings for energy efficiency: A critical review. Energy Res. Soc. Sci. 2021, 71, 101828. [Google Scholar] [CrossRef]
- Pan, S.; Xiong, Y.; Han, Y.; Zhang, X.; Xia, L.; Wei, S.; Wu, J.; Han, M. A study on influential factors of occupant window-opening behavior in an office building in China. Build. Environ. 2018, 133, 41–50. [Google Scholar] [CrossRef]
- Yousefi, F.; Gholipour, Y.; Yan, W. A study of the impact of occupant behaviors on energy performance of building envelopes using occupants’ data. Energy Build. 2017, 148, 182–198. [Google Scholar] [CrossRef]
- European Commission. Available online: https://setis.ec.europa.eu/sites/default/files/reports/Driving_and_parking_patterns_of_European_car_drivers-a_mobility_survey.pdf (accessed on 7 March 2021).
- ETAS. Available online: https://www.etas.com/en/products/hardware_products.php (accessed on 13 March 2021).
- ETAS INCA Software. Available online: https://www.etas.com/en/products/inca_software_products.php (accessed on 13 March 2021).
- ETAS MDA. Software. Available online: https://www.etas.com/en/products/mda-mda_v8.php (accessed on 13 March 2021).
- Palma-Mendez, J.T.; Marín-Morales, R. Inteligencia Artificial, 2nd ed.; Mc Graw Hill: New York, NY, USA, 2008; pp. 647–691. [Google Scholar]
- Rothman, D. Artificial Intelligence by Example, 2nd ed.; Packt Publishing: Birmingham, UK, 2020; pp. 423–468. [Google Scholar]
- Russel, S. Artificial Intelligence: A Modern Approach, 3rd ed.; Pearson: New York, NY, USA, 2010; pp. 520–685. [Google Scholar]
- Melero, J.J.; Garibaldi, J.; Linares-Barranco, A.; Warwick, K.; Madani, K.E.; Yuhui, S. Computational Intelligence, 2nd ed.; Springer: New York, NY, USA, 2021; pp. 157–185. [Google Scholar]
- Spanish transmission operator. Available online: https://demanda.ree.es/visiona/home (accessed on 13 March 2021).
- Mathworks. Available online: https://es.mathworks.com/help/deeplearning/ref/narnet.html;jsessionid=1b35de9b0f7625f9bcc764bb5ac5 (accessed on 28 February 2021).
- Ruiz, L.G.B.; Cuéllar, M.P.; Calvo-Flores, M.D.; Jiménez, M.D.C.P. An Application of Non-Linear Autoregressive Neural Networks to Predict Energy Consumption in Public Buildings. Energies 2016, 9, 684. [Google Scholar] [CrossRef] [Green Version]
- R Official Documentation. Available online: https://cran.r-project.org/web/packages/PASWR/index.html (accessed on 28 February 2021).
- Elsevier. Available online: https://www.sciencedirect.com/topics/earth-and-planetary-sciences/kurtosis (accessed on 28 February 2021).
- García-Pérez, A. Estadística Básica con R, 1st ed.; UNED: Madrid, Spain, 2011. [Google Scholar]
- Open Charge API. Available online: https://openchargemap.org/site (accessed on 28 February 2021).
- Wu, F.; Sioshansi, R. A two-stage stochastic optimization model for scheduling electric vehicle charging loads to relieve distribution-system constraints. Transp. Res. Part B Methodol. 2017, 102, 55–82. [Google Scholar] [CrossRef]
- Shia, Y.; Zhanga, Q.; Heb, A.; Panc, A.; Zhanga, M.; Lid, C.; Liaoa, Q.; Yanga, X.; Wanga, Z. A real-world investigation into usage patterns of electric vehicles in Shanghai. J. Energy Storage 2020, 32, 101805. [Google Scholar] [CrossRef]
- Schey, S.; Scoffield, D.; Smart, J. A First Look at the Impact of Electric Vehicle Charging on the Electric Grid in The EV Project. World Electr. Veh. J. 2012, 5, 667–678. [Google Scholar] [CrossRef] [Green Version]
- Verichev, K.; Zamorano, M.; Carpio, M. Effects of climate change on variations in climatic zones and heating energy consumption of residential buildings in the southern Chile. Energy Build. 2020, 215, 109874. [Google Scholar] [CrossRef]
- Li, M.; Cao, J.; Xiong, M.; Li, J.; Feng, X.; Meng, F. Different responses of cooling energy consumption in office buildings to climatic change in major climate zones of China. Energy Build. 2018, 173, 38–44. [Google Scholar] [CrossRef]
- Li, J.; Yang, L.; Long, H. Climatic impacts on energy consumption: Intensive and extensive margins. Energy Econ. 2018, 71, 332–343. [Google Scholar] [CrossRef]
- Sheng, W.; Wen, B.; Zhang, L. Envelope performance of residential building in cool, warm and hot climatic zones: Results from self-designed in-situ monitoring campaigns. Energy Build. 2021, 232, 110655. [Google Scholar] [CrossRef]
- Csoknyai, T.; Legardeur, J.; Abi Aklec, A.; Horvátha, M. Analysis of energy consumption profiles in residential buildings and impact assessment of a serious game on occupants’ behavior. Energy Build. 2019, 196, 1–20. [Google Scholar] [CrossRef]
- Kavousian, A.; Rajagopal, R.; Fischer, M. Determinants of residential electricity consumption: Using smart meter data to examine the effect of climate, building characteristics, appliance stock, and occupants’ behavior. Energy 2013, 55, 184–194. [Google Scholar] [CrossRef]
- Laaroussi, Y.; Bahrar, M.; El Mankibi, M.; Draoui, A.; Si-Larbi, A. Occupant presence and behavior: A major issue for building energy performance simulation and assessment. Sustain. Cities Soc. 2020, 63, 102420. [Google Scholar] [CrossRef]
- Sagaria, S.; Neto, R.C.; Baptista, P. Modelling approach for assessing influential factors for EV energy performance. Sustain. Energy Technol. Assess. 2021, 44, 100984. [Google Scholar] [CrossRef]
- Yan, J.; Zhang, J.; Liu, Y.; Lv, G.; Han, S.; Alfonzo, I.E.G. EV charging load simulation and forecasting considering traffic jam and weather to support the integration of renewables and EVs. Renew. Energy 2020, 159, 623–641. [Google Scholar] [CrossRef]
- Atia, R.; Yamada, N. More accurate sizing of renewable energy sources under high levels of electric vehicle integration. Renew. Energy 2015, 81, 918–925. [Google Scholar] [CrossRef]
- Pearre, N.S.; Swan, L.G. Electric vehicle charging to support renewable energy integration in a capacity constrained electricity grid. Energy Convers. Manag. 2016, 109, 130–139. [Google Scholar] [CrossRef] [Green Version]
- Colmenar-Santos, A.; Muñoz-Gómez, A.-M.; Rosales-Asensio, E.; López-Rey, Á. Electric vehicle charging strategy to support renewable energy sources in Europe 2050 low-carbon scenario. Energy 2019, 183, 61–74. [Google Scholar] [CrossRef]
Figure 1.
Methodology used in this research.

Figure 2.
Spanish climate.

Figure 3.
ETAS® input/output modules connection.

Figure 4.
How to configure the consumption model.

Figure 5.
GRU network code.

Figure 6.
Inaccuracy in predictions when using different d values.

Figure 7.
NAR network code in MATLAB®.

Figure 8.
Winter consumption curves for the buildings located in Alcalá.

Figure 9.
Summer consumption curves for the buildings located in Alcalá.

Figure 10.
Contribution to V2B based on social groups.

Figure 11.
V2B improvement owing to ER and EDR.

Figure 12.
Electric energy consumption considering social groups.

Figure 13.
RE contribution, electricity price and EV charging price. June 2020.

Figure 14.
RE contribution, electricity price and EV charging price. December 2020.

Figure 15.
EV charging price proposal.

Figure 16.
V2B contribution.


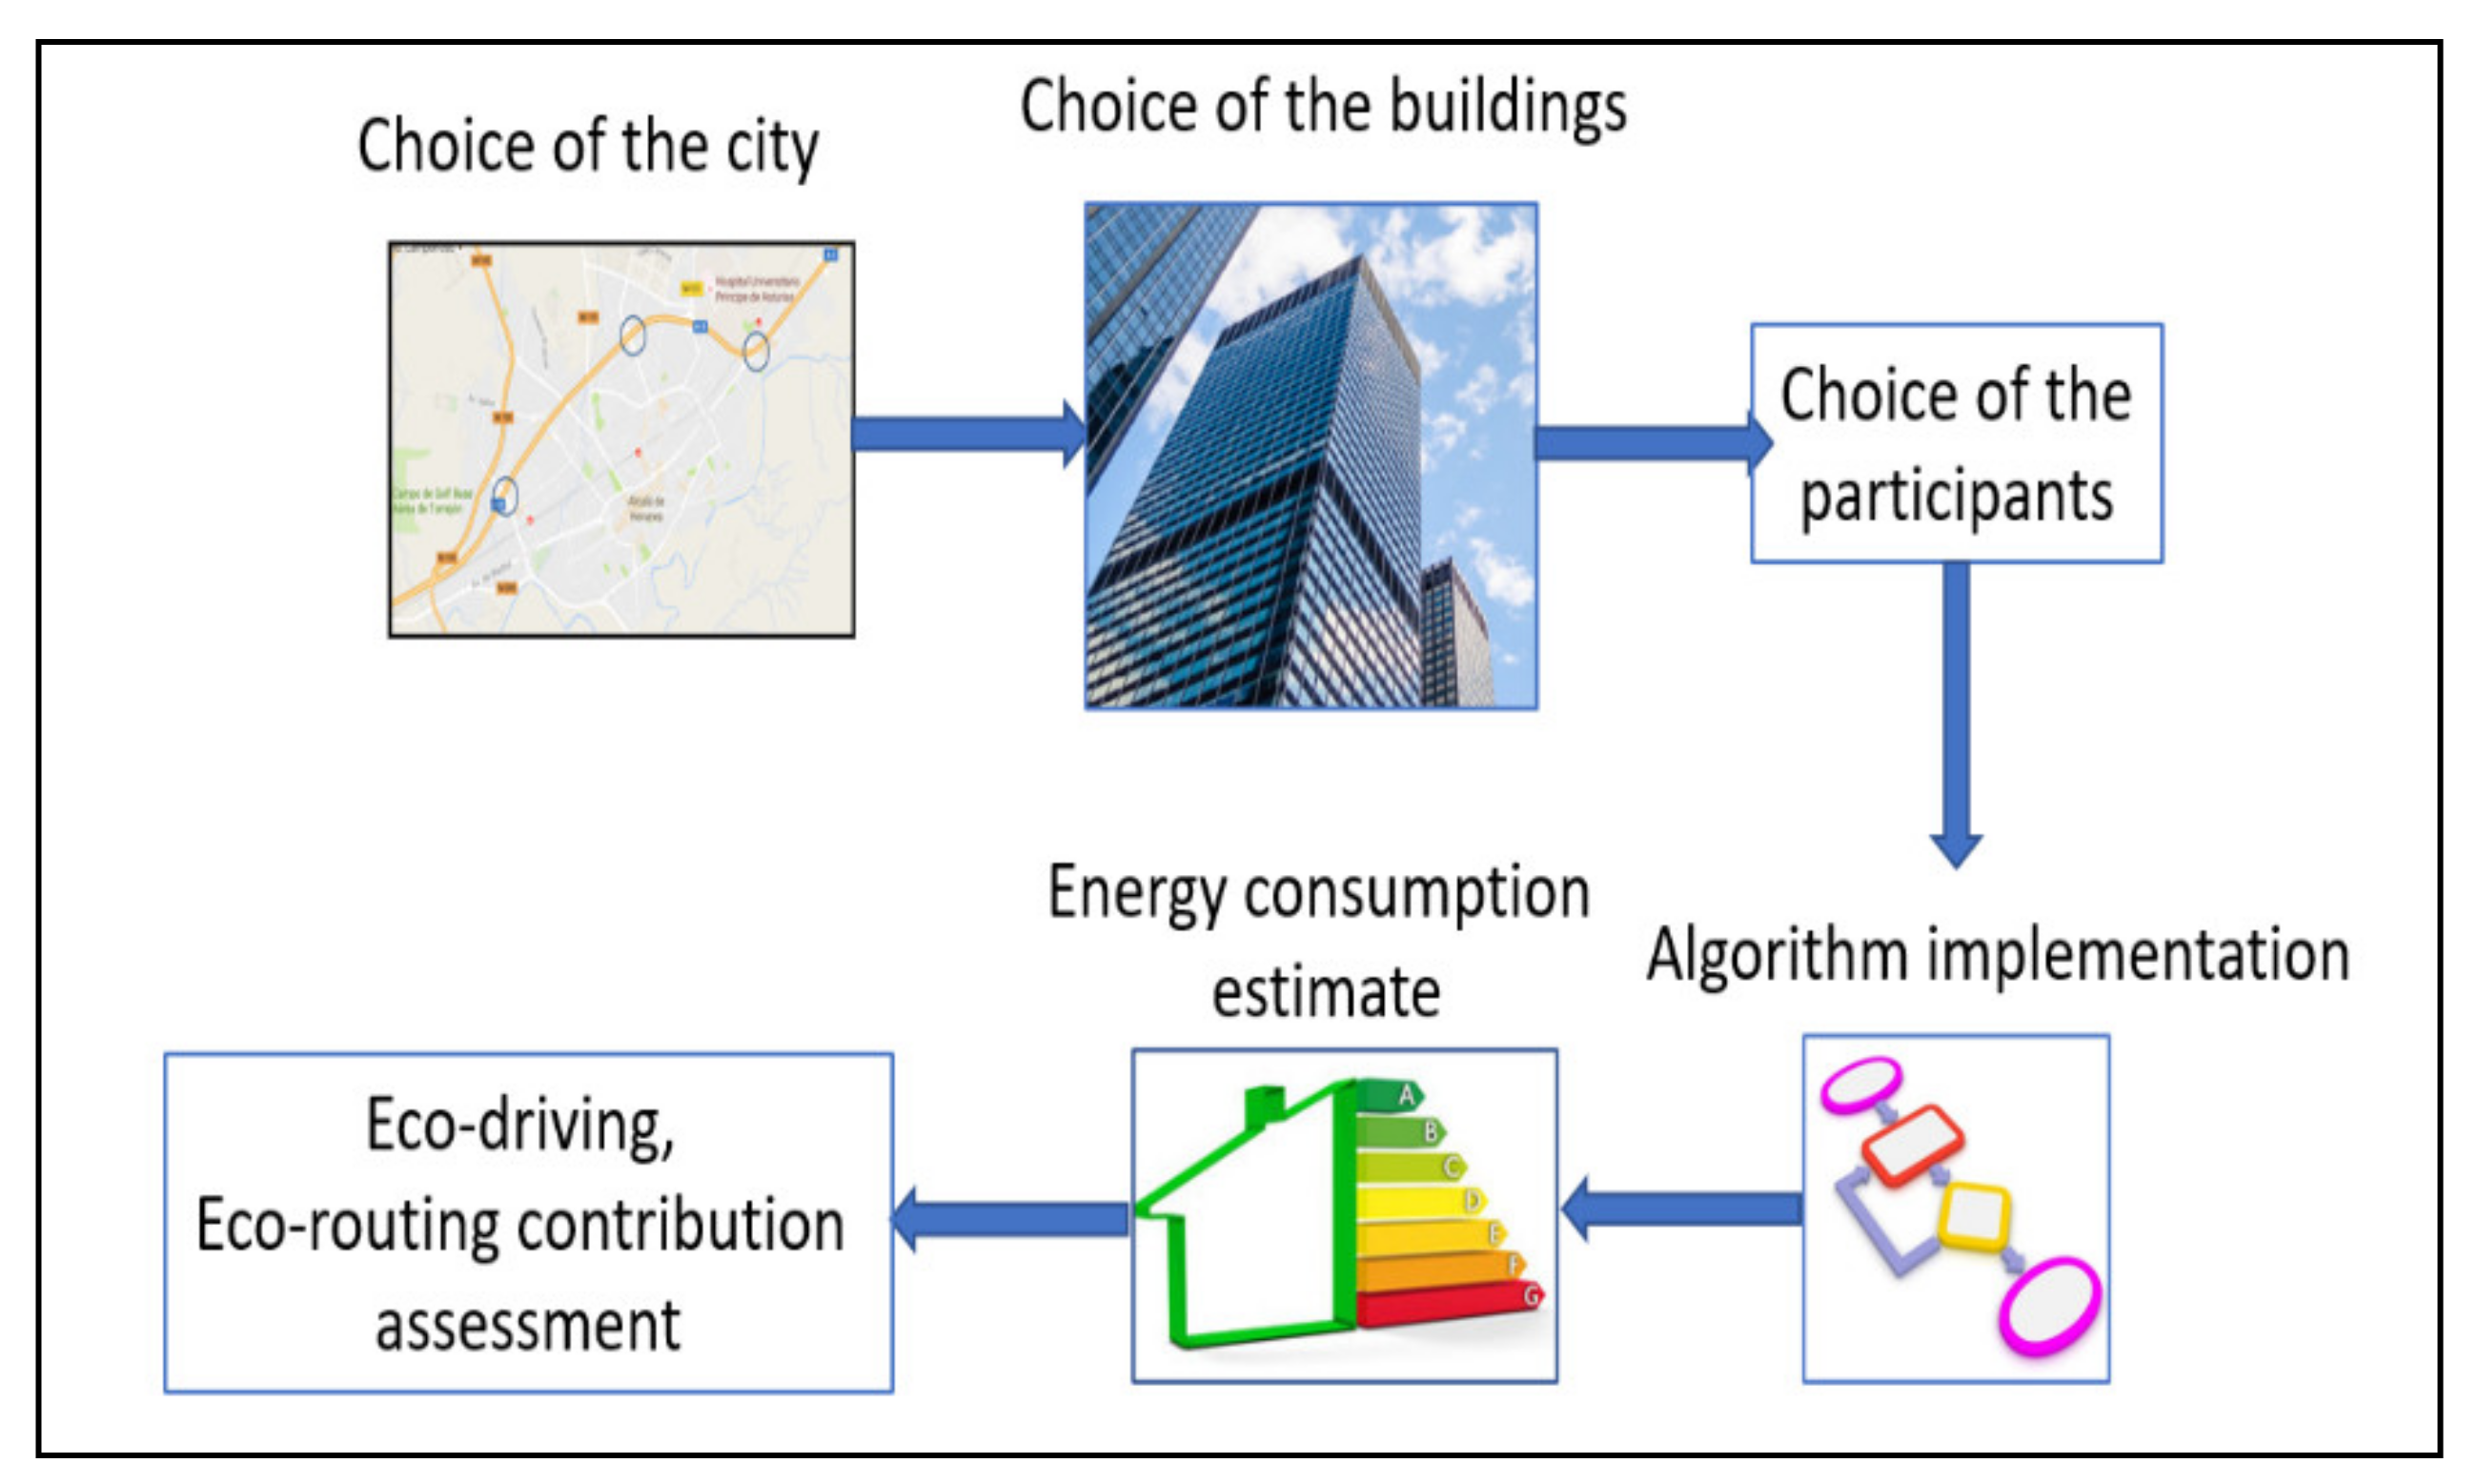
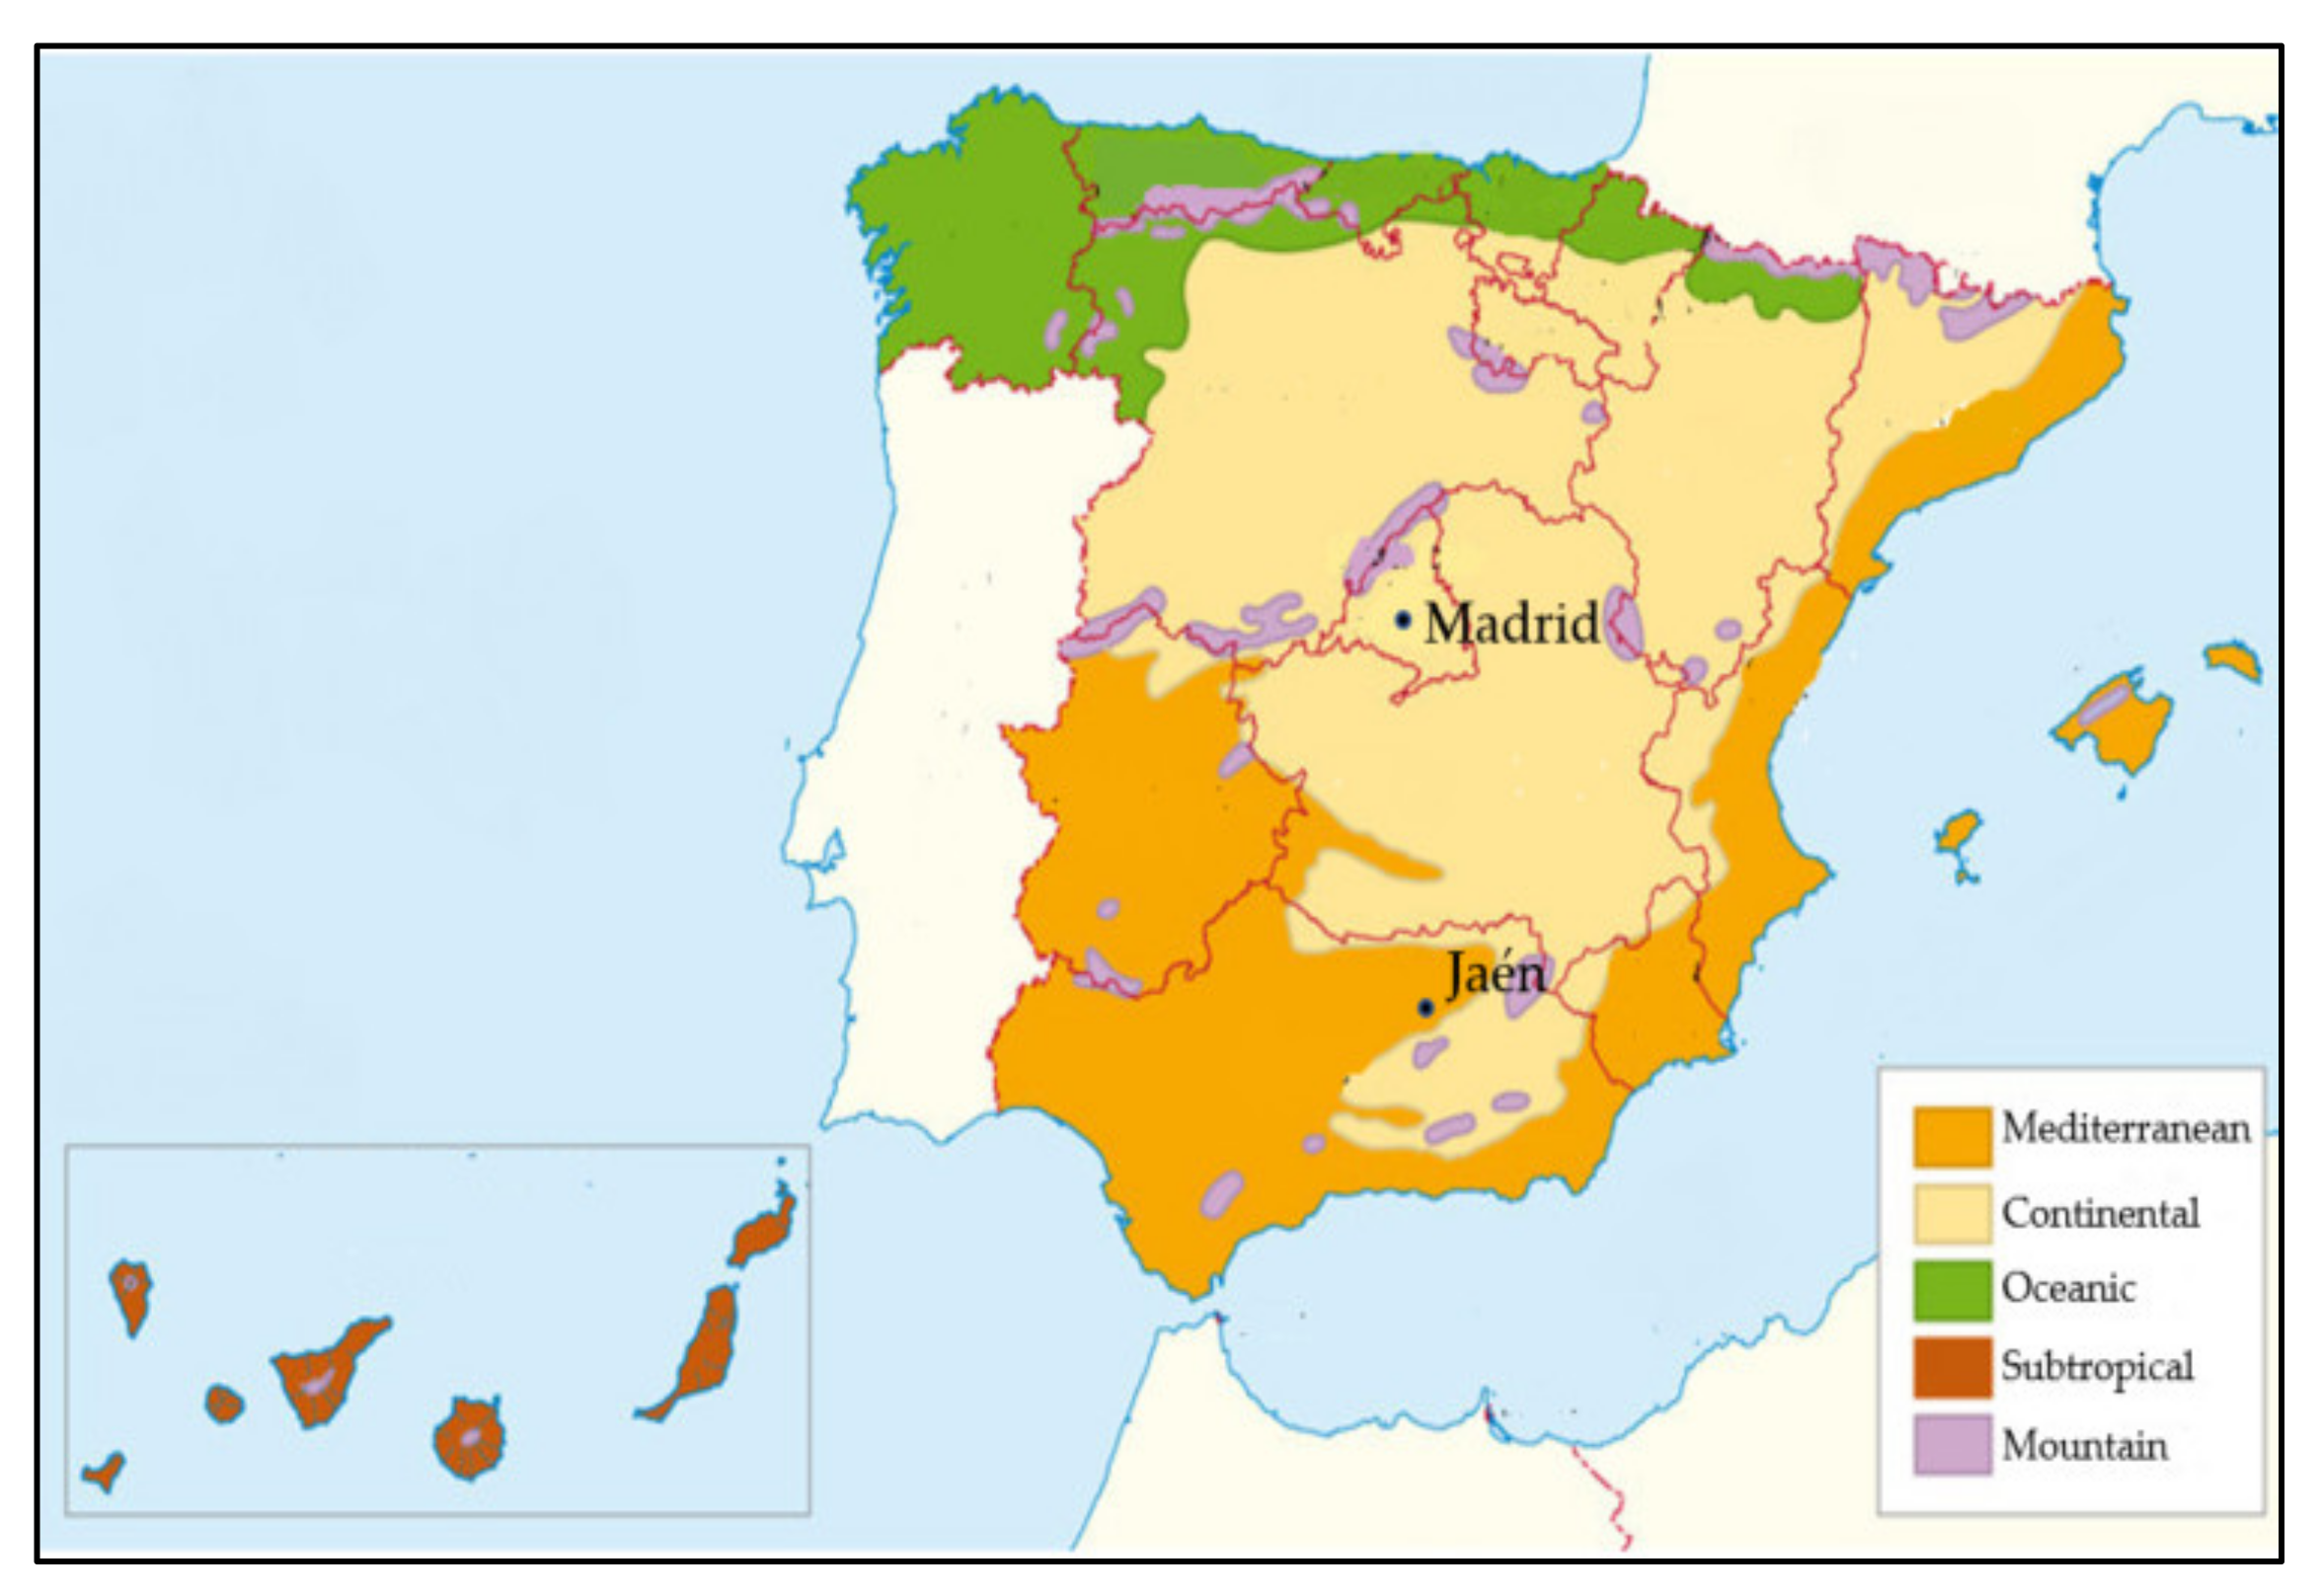
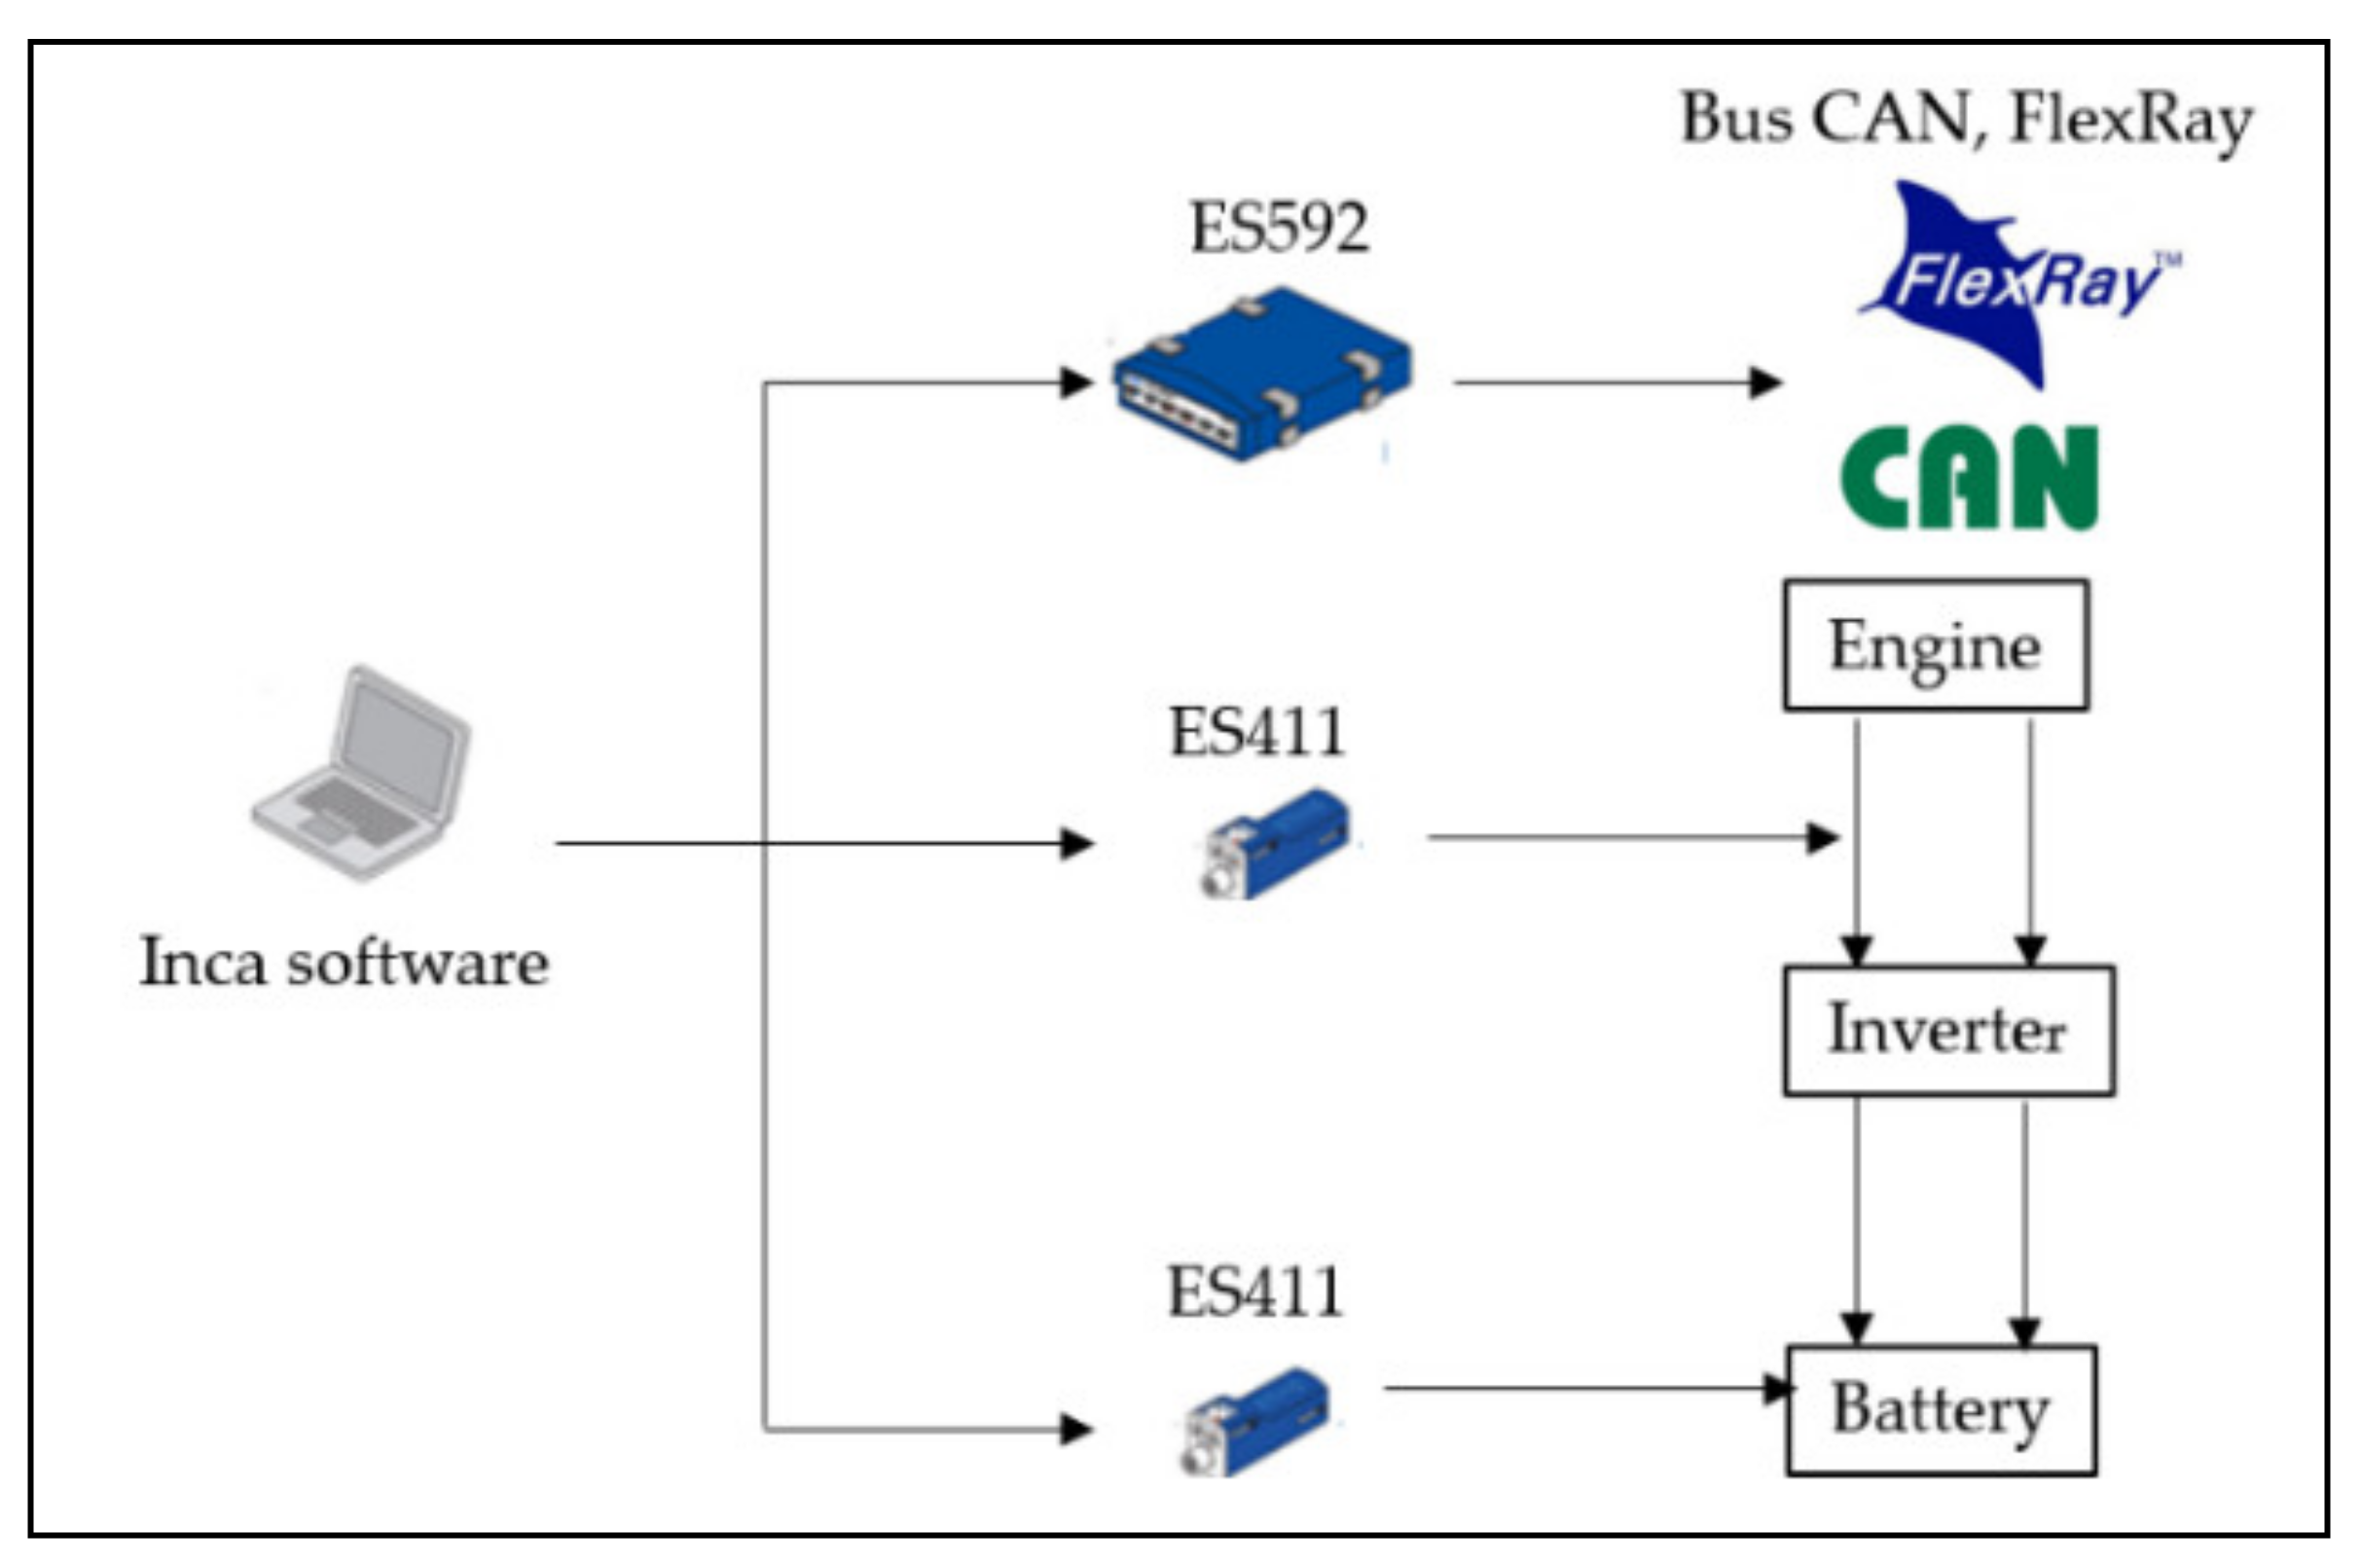
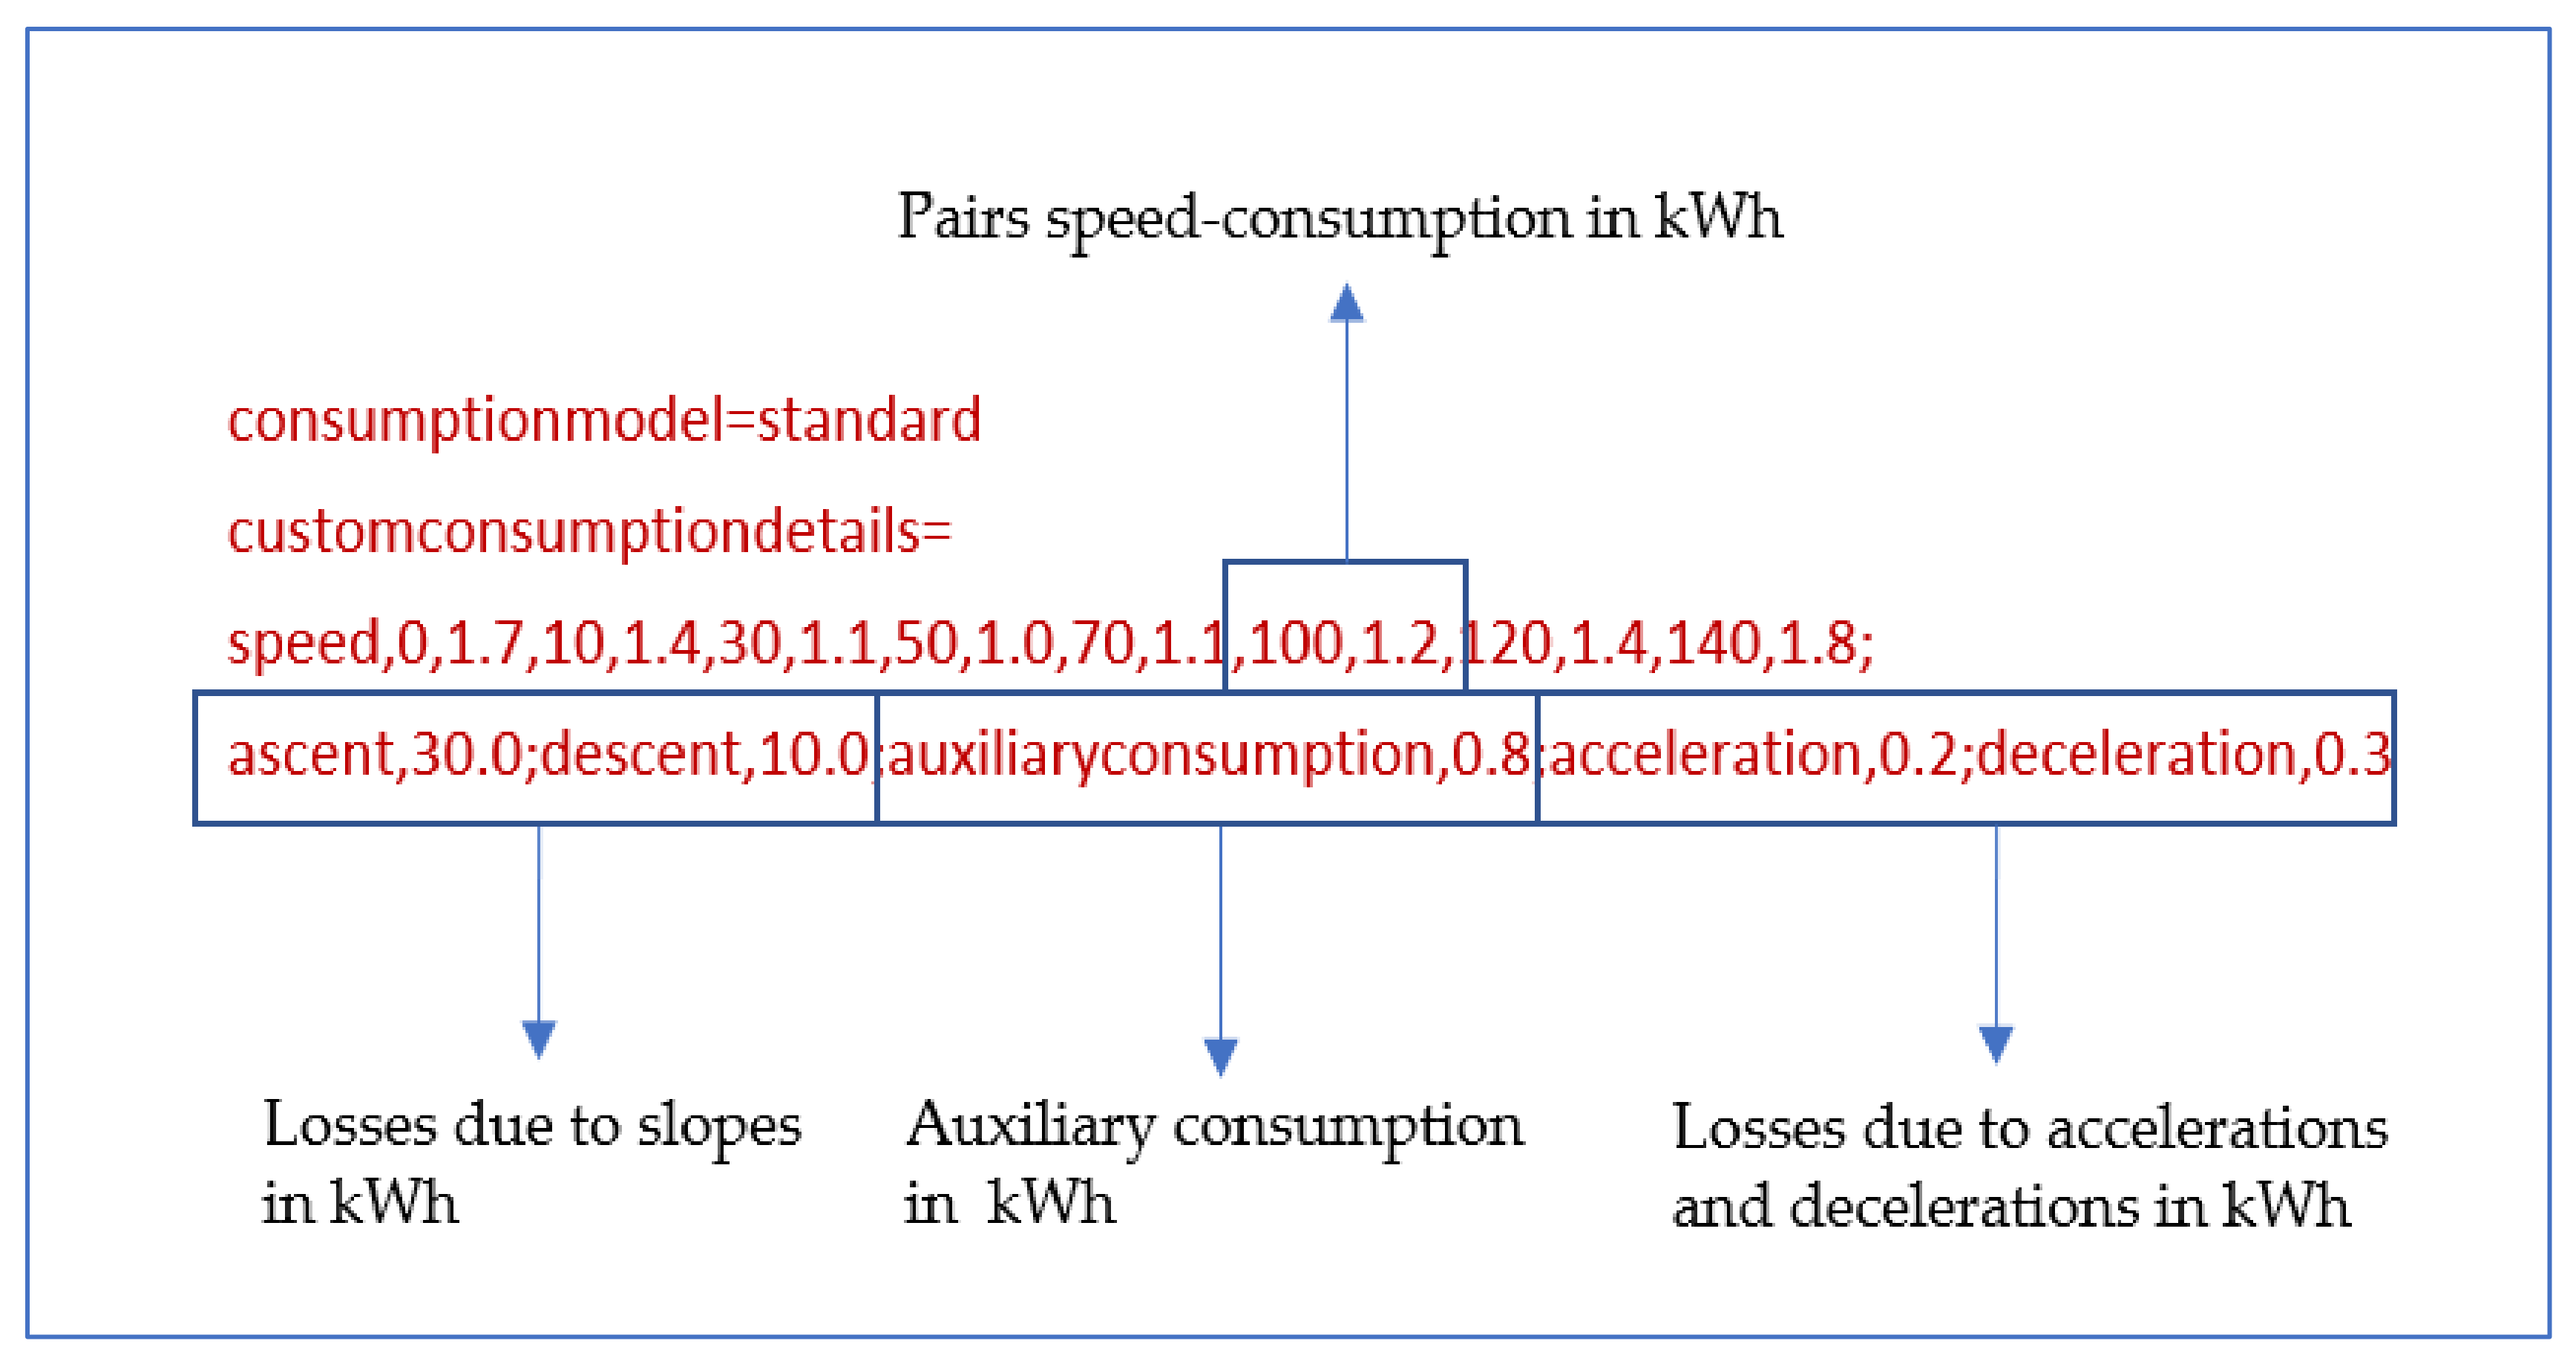
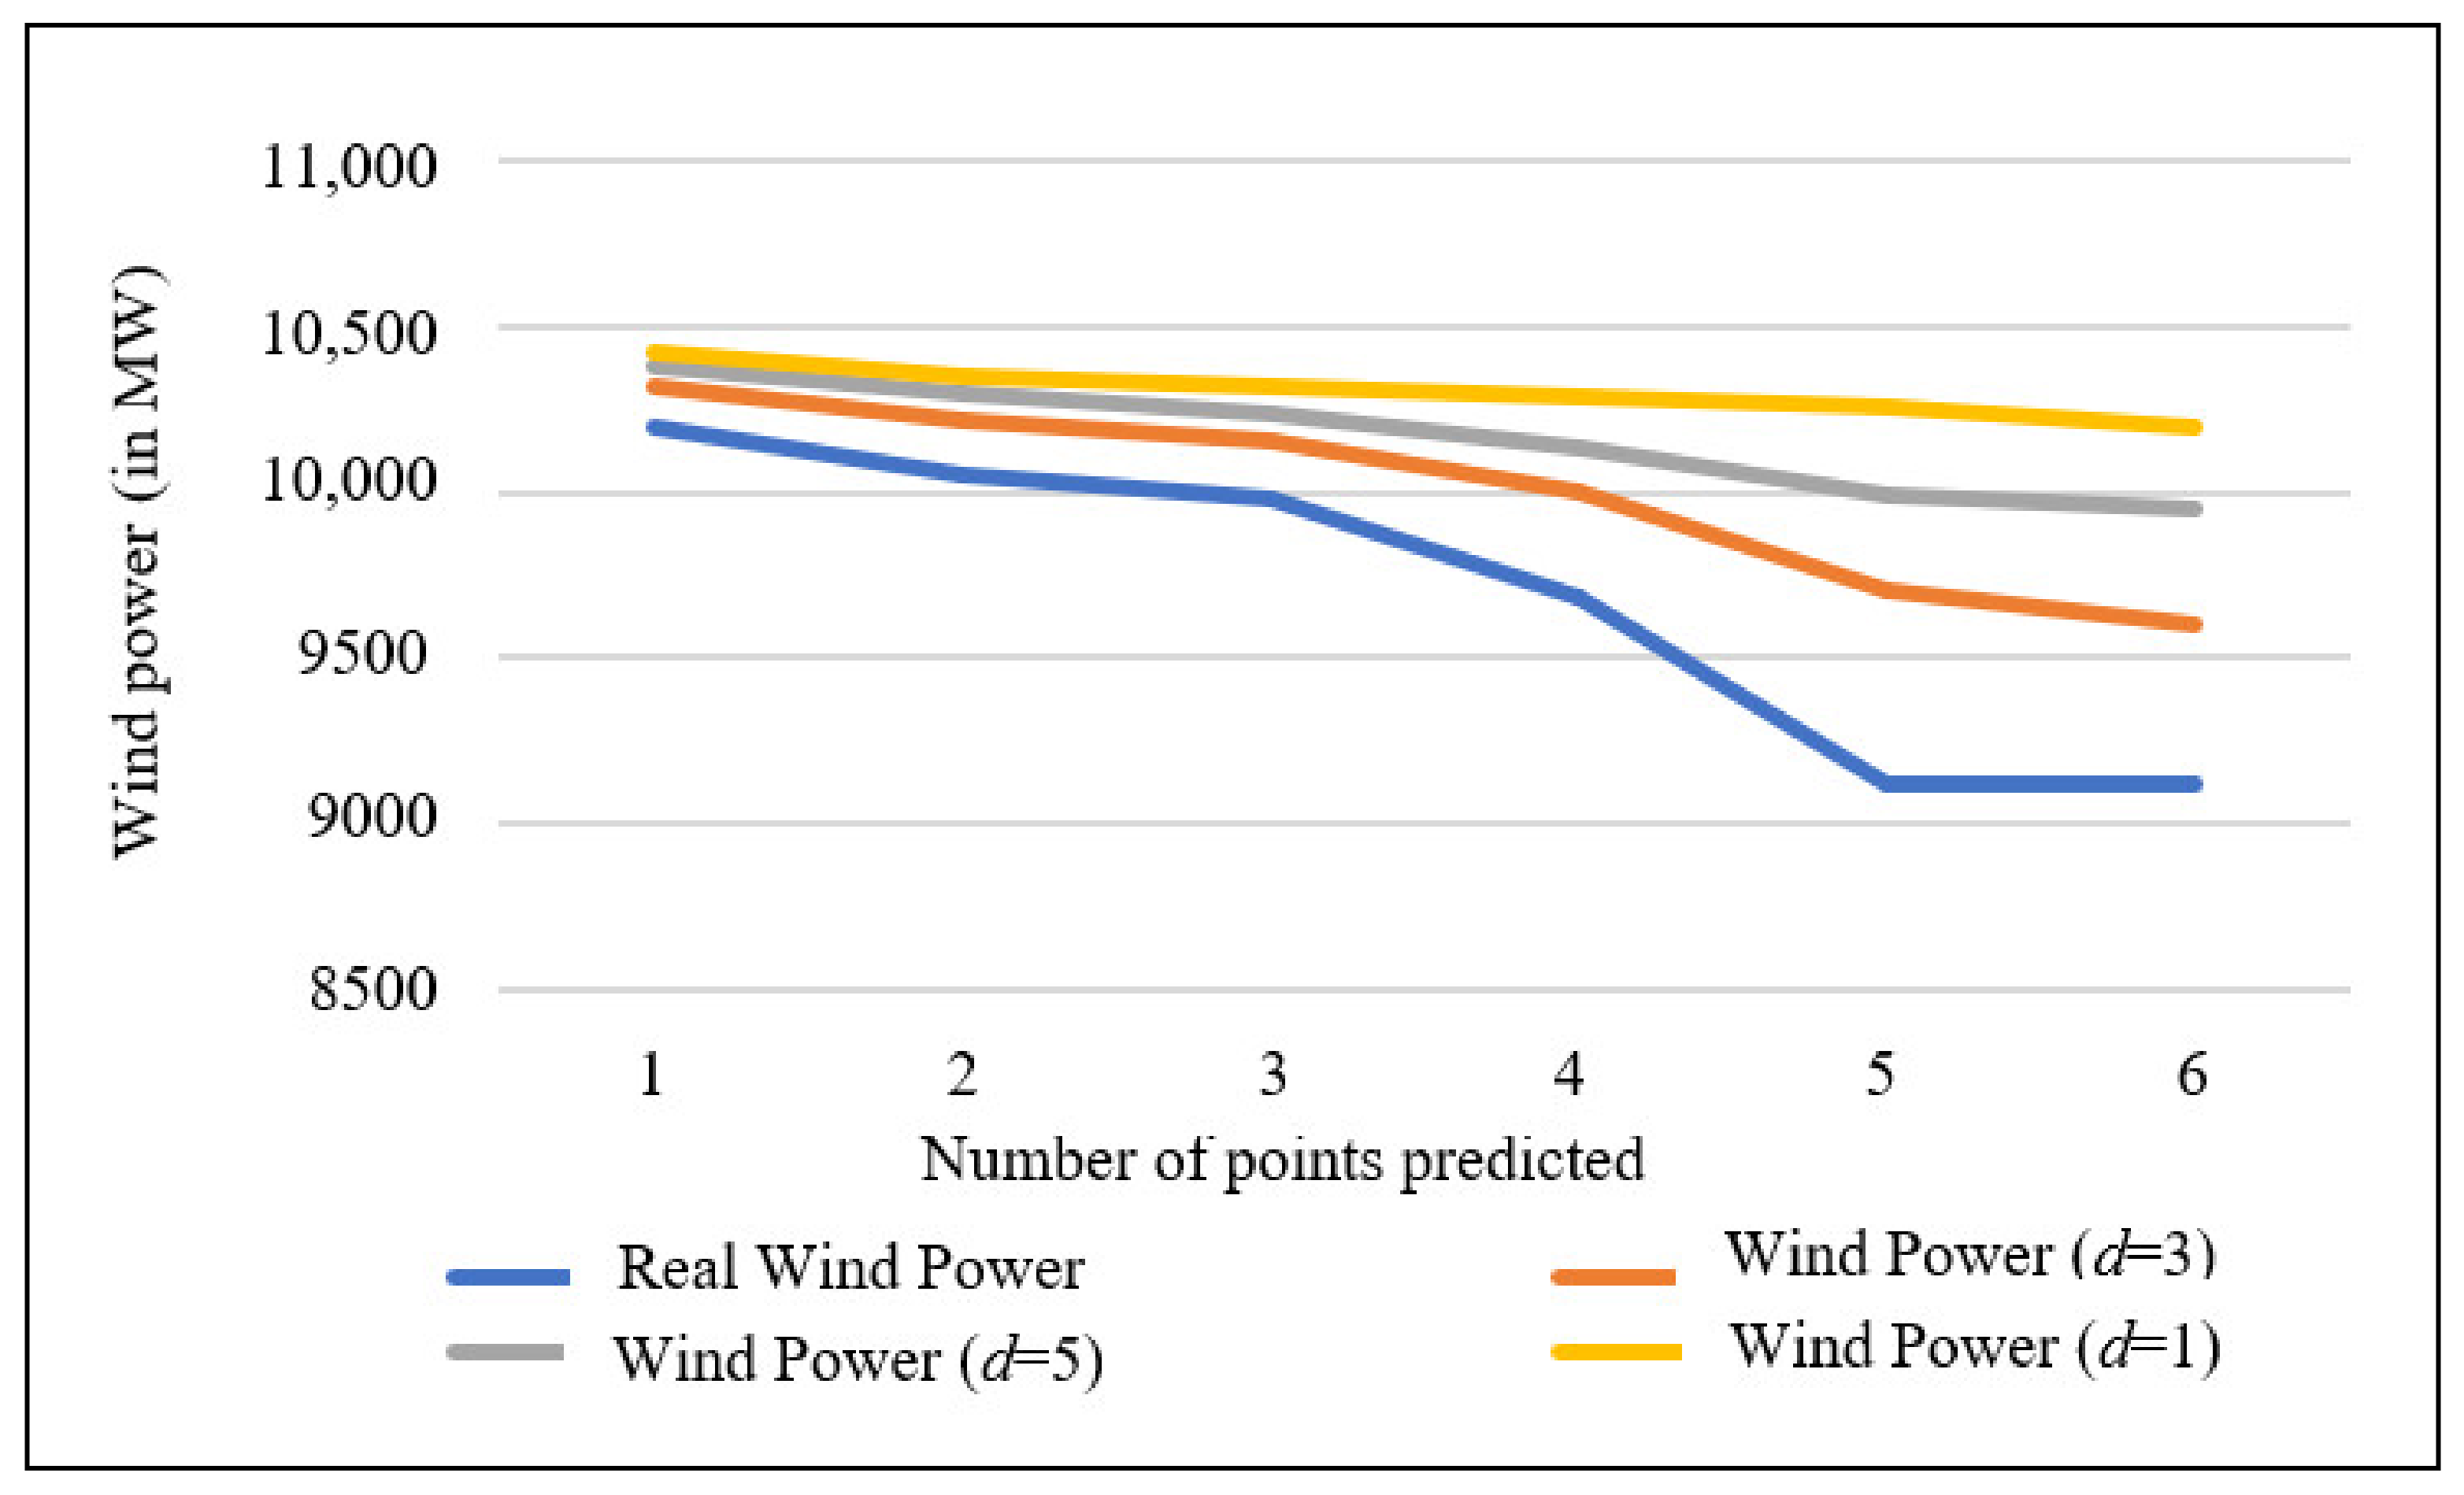
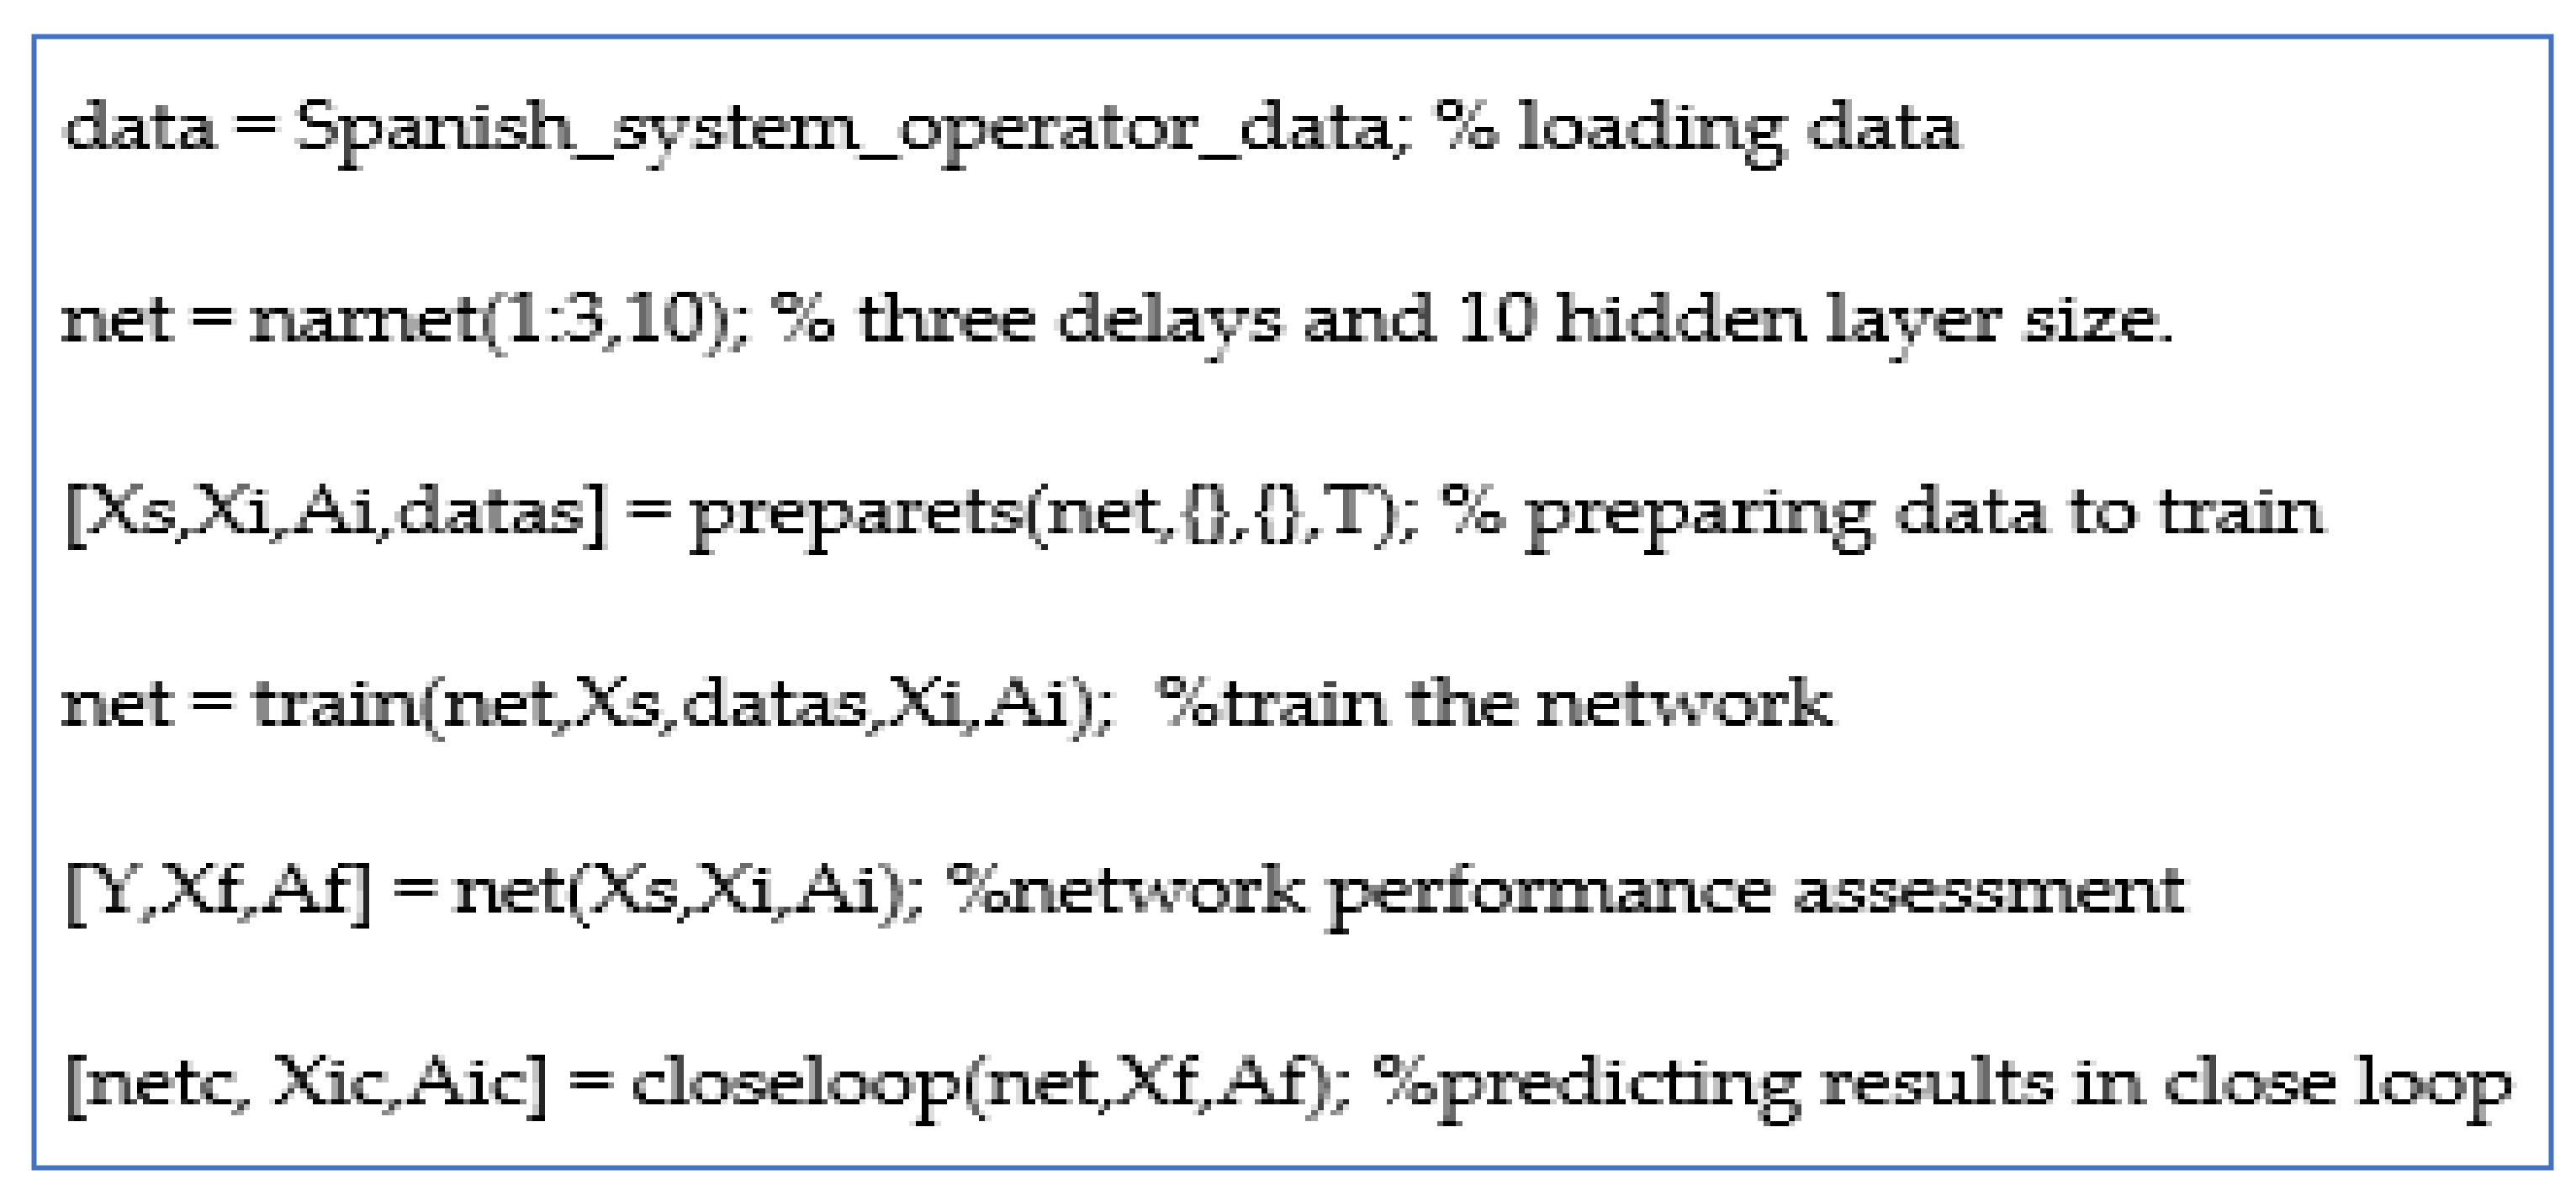
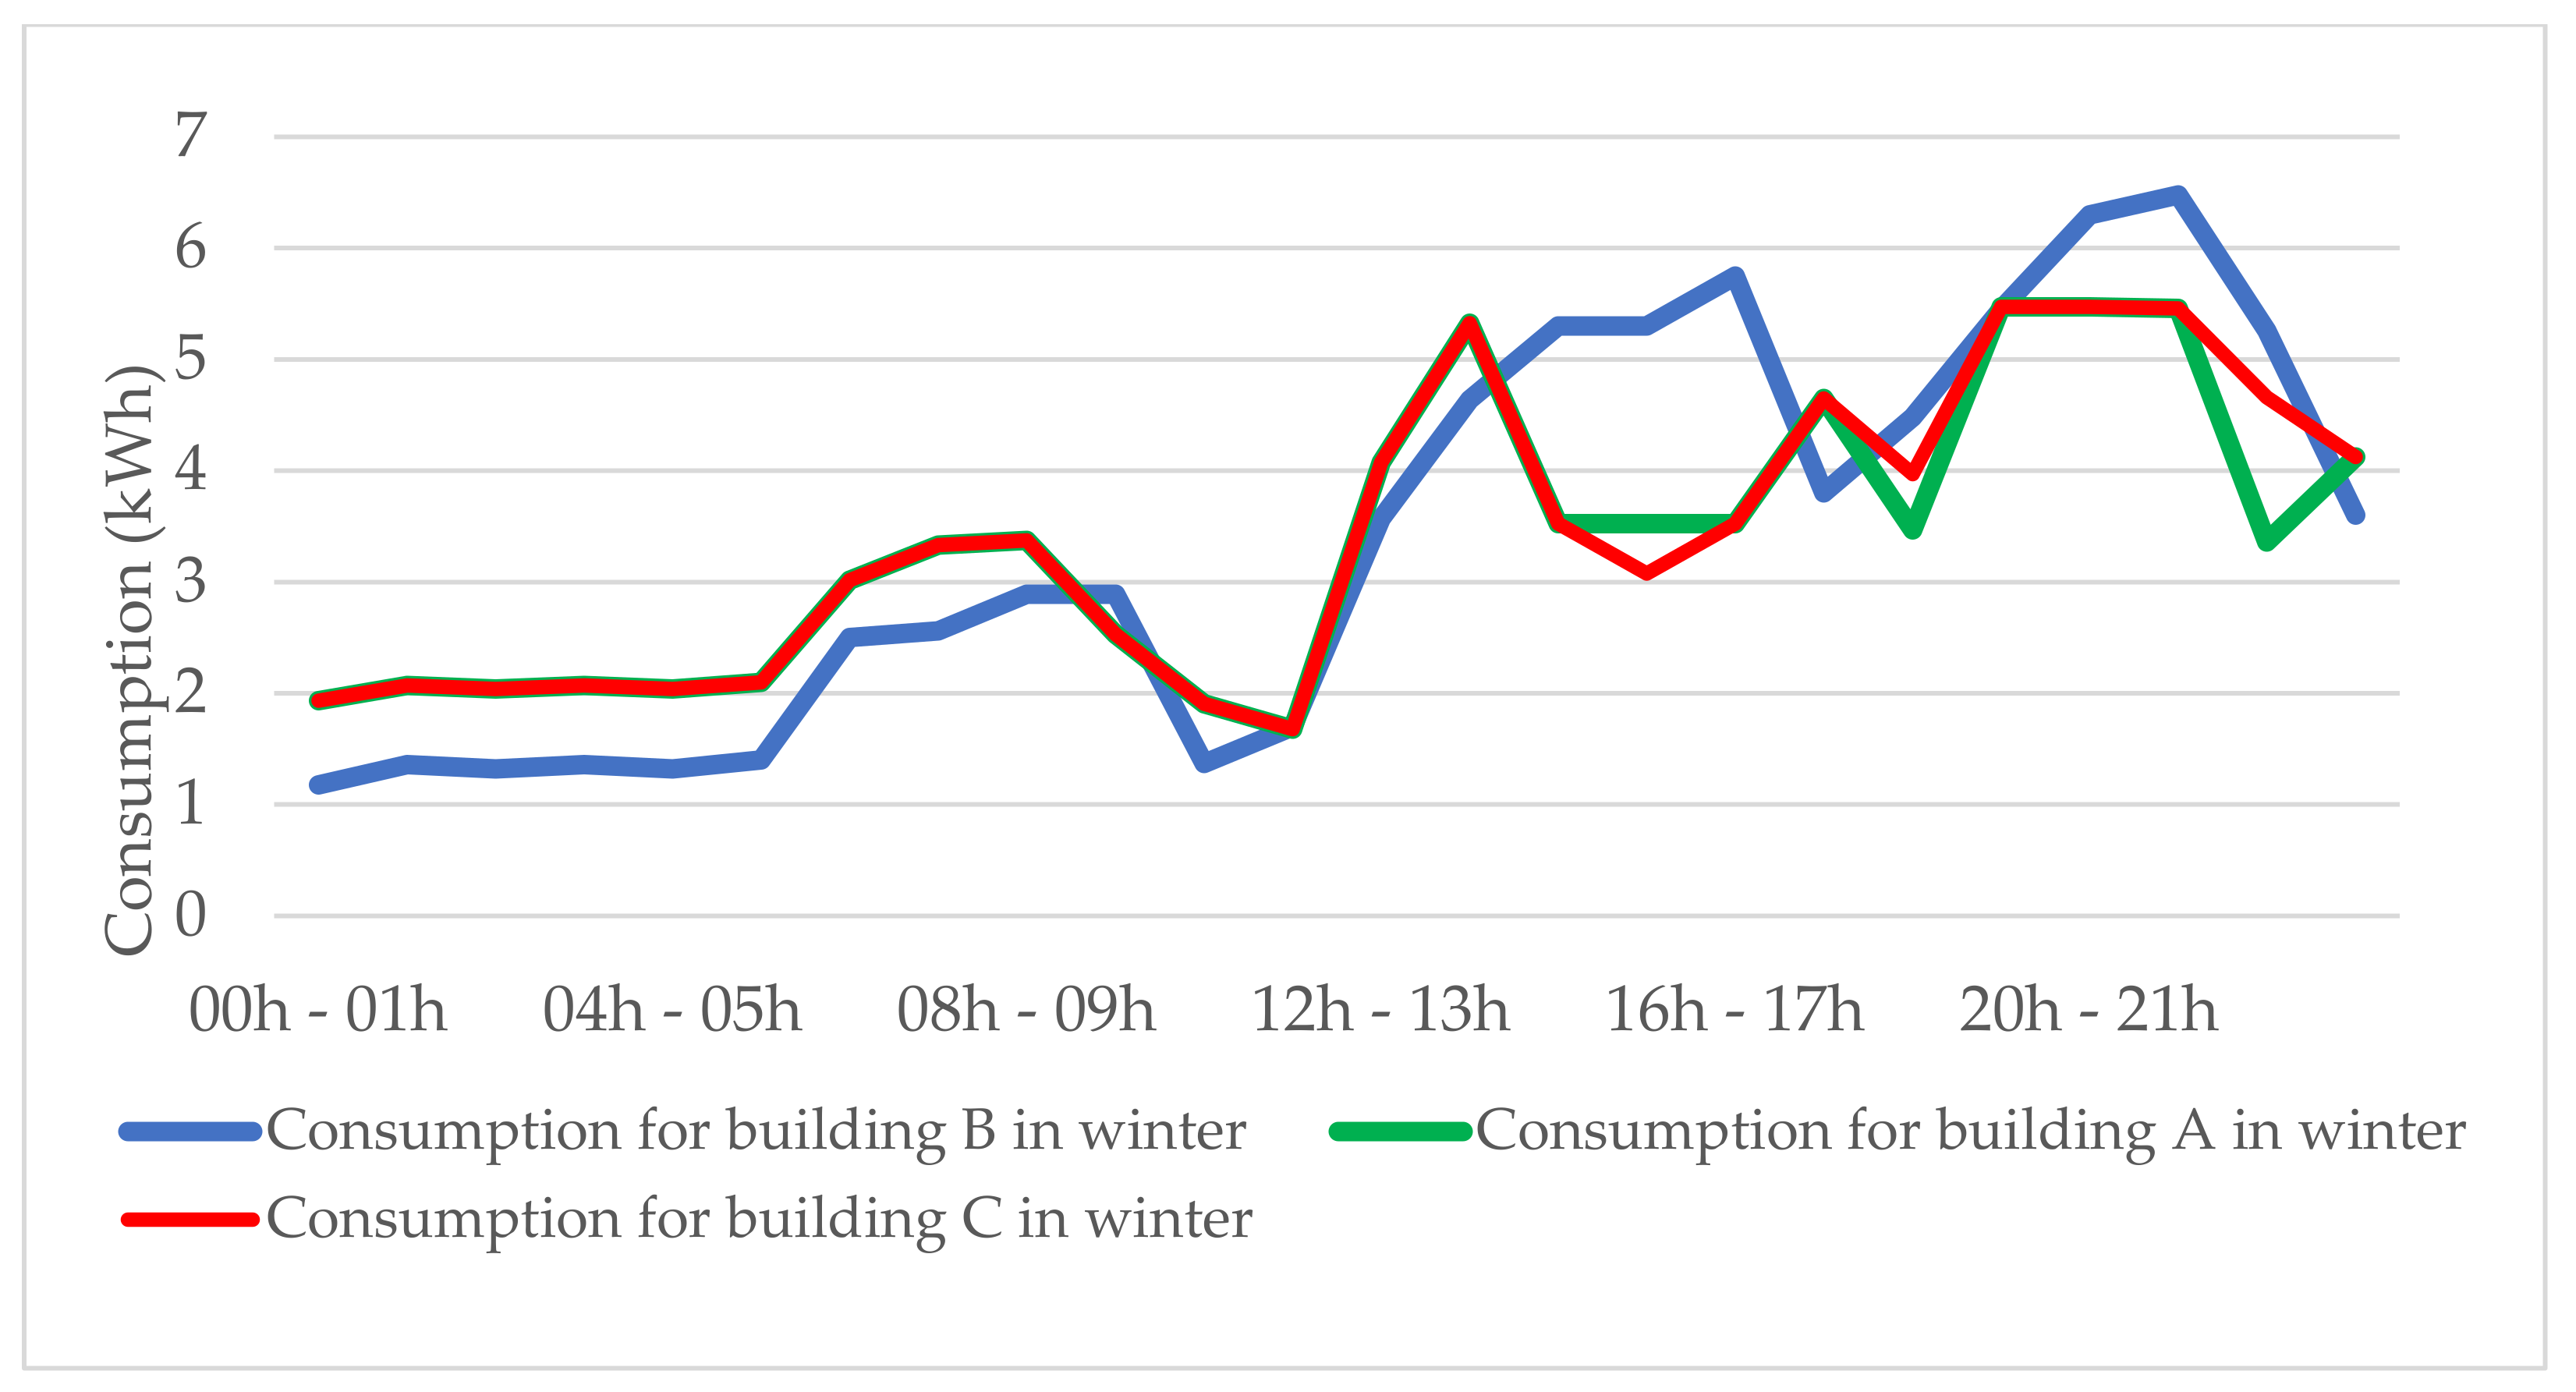
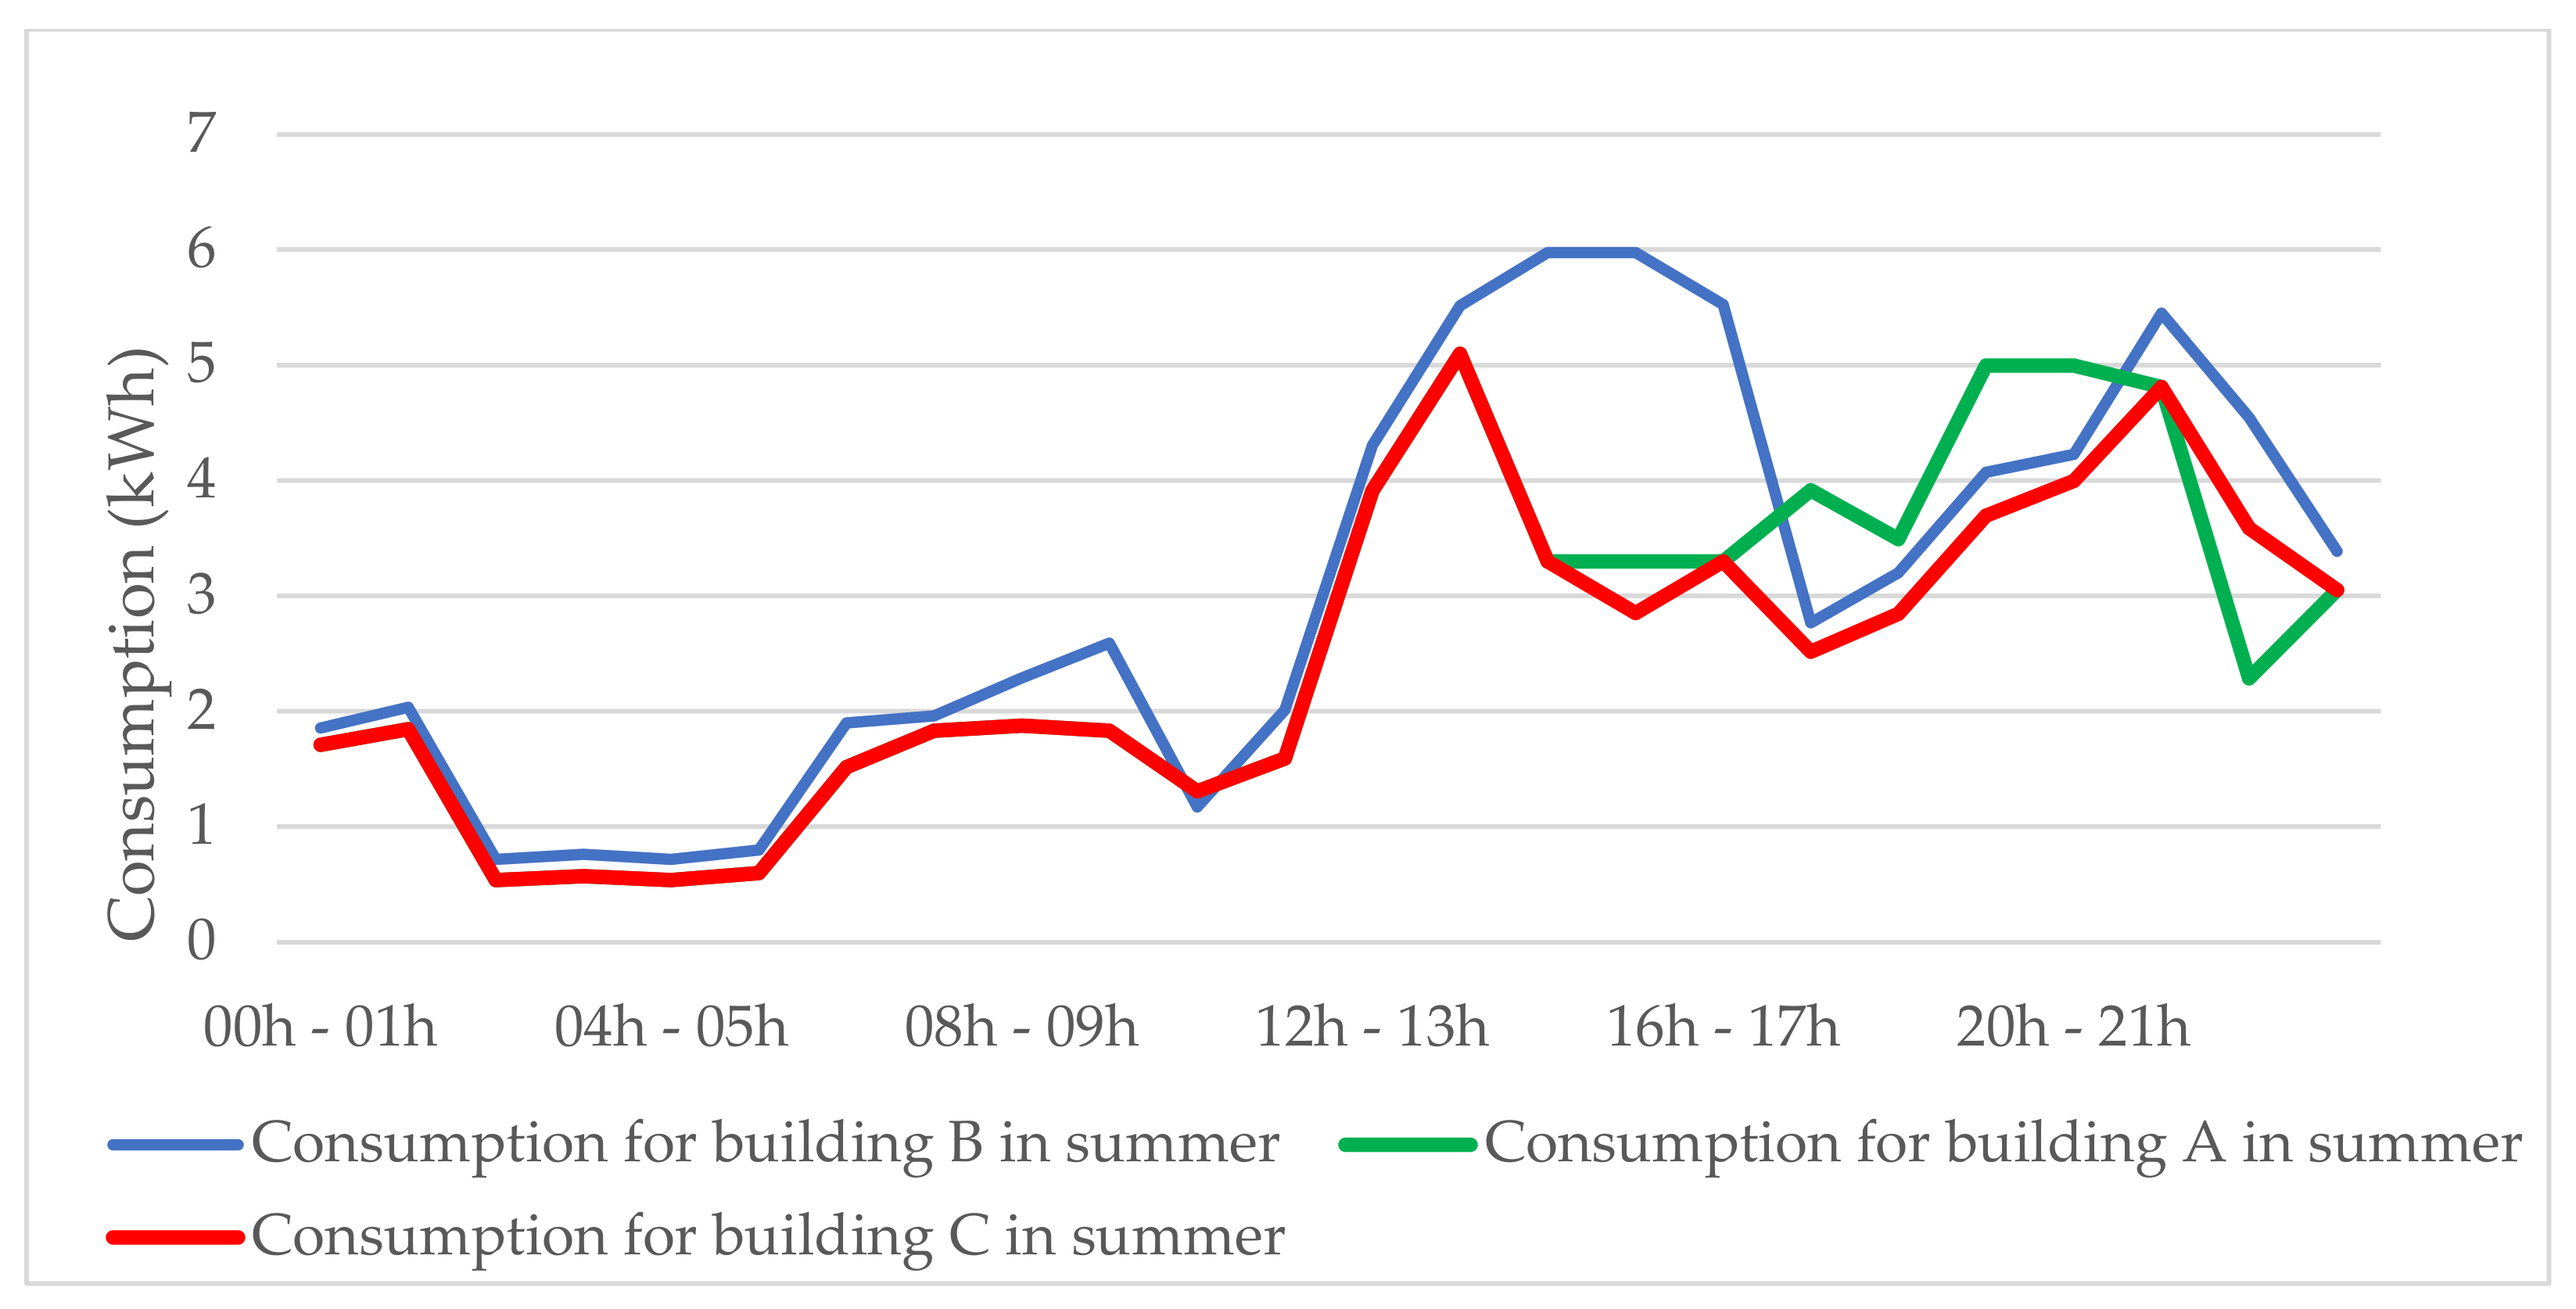
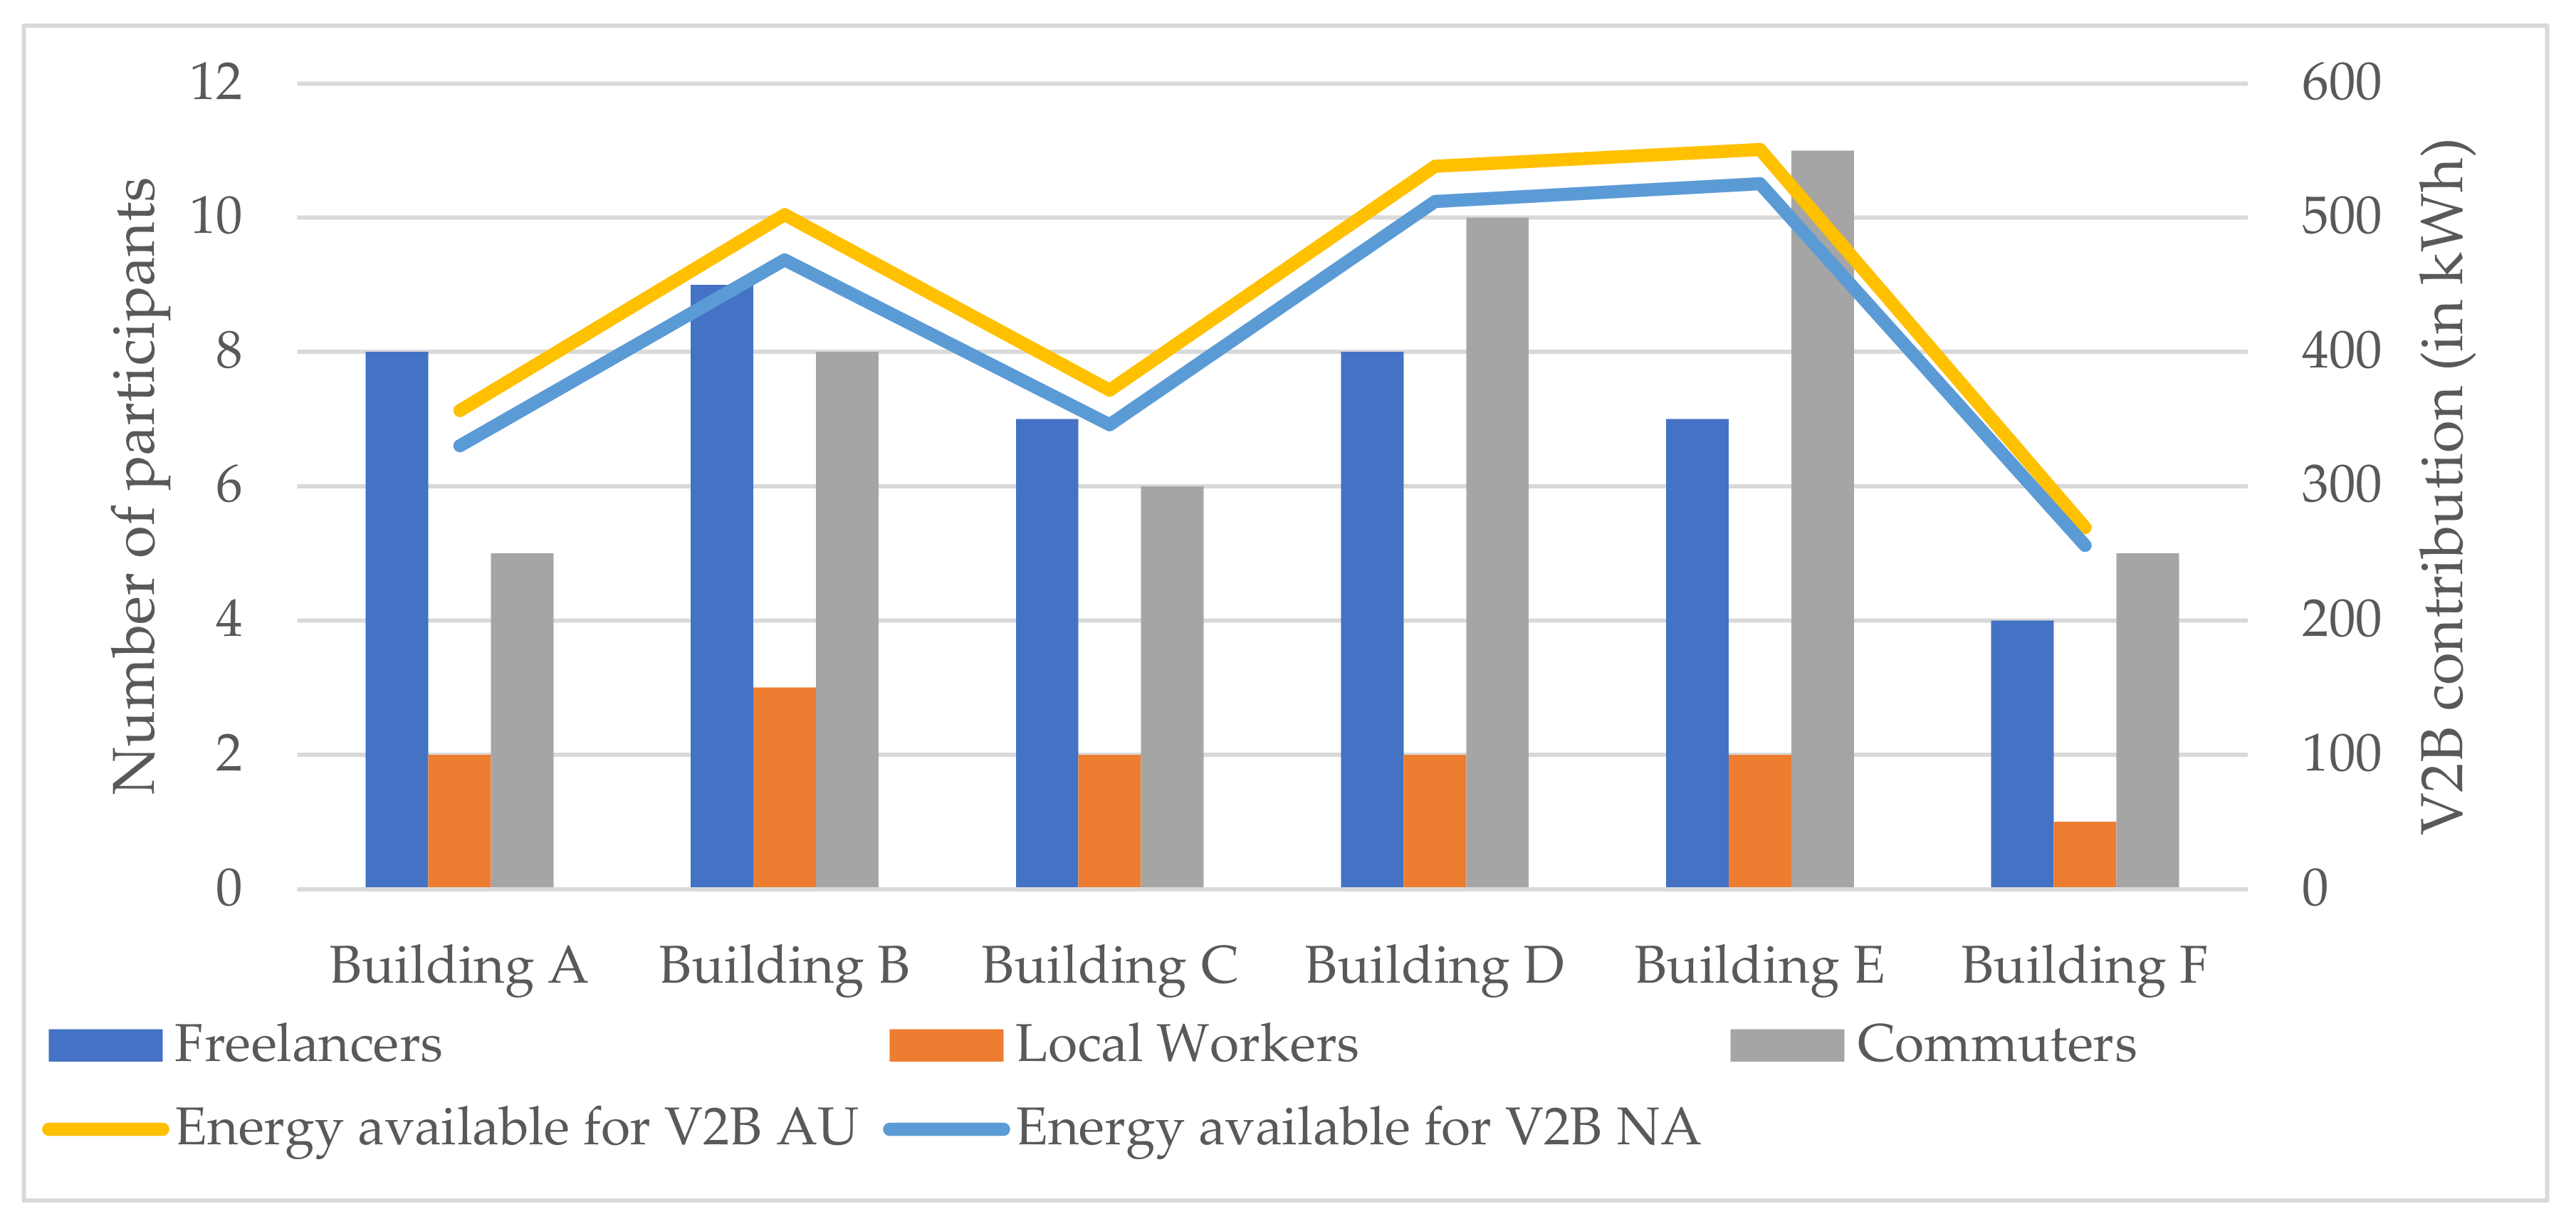
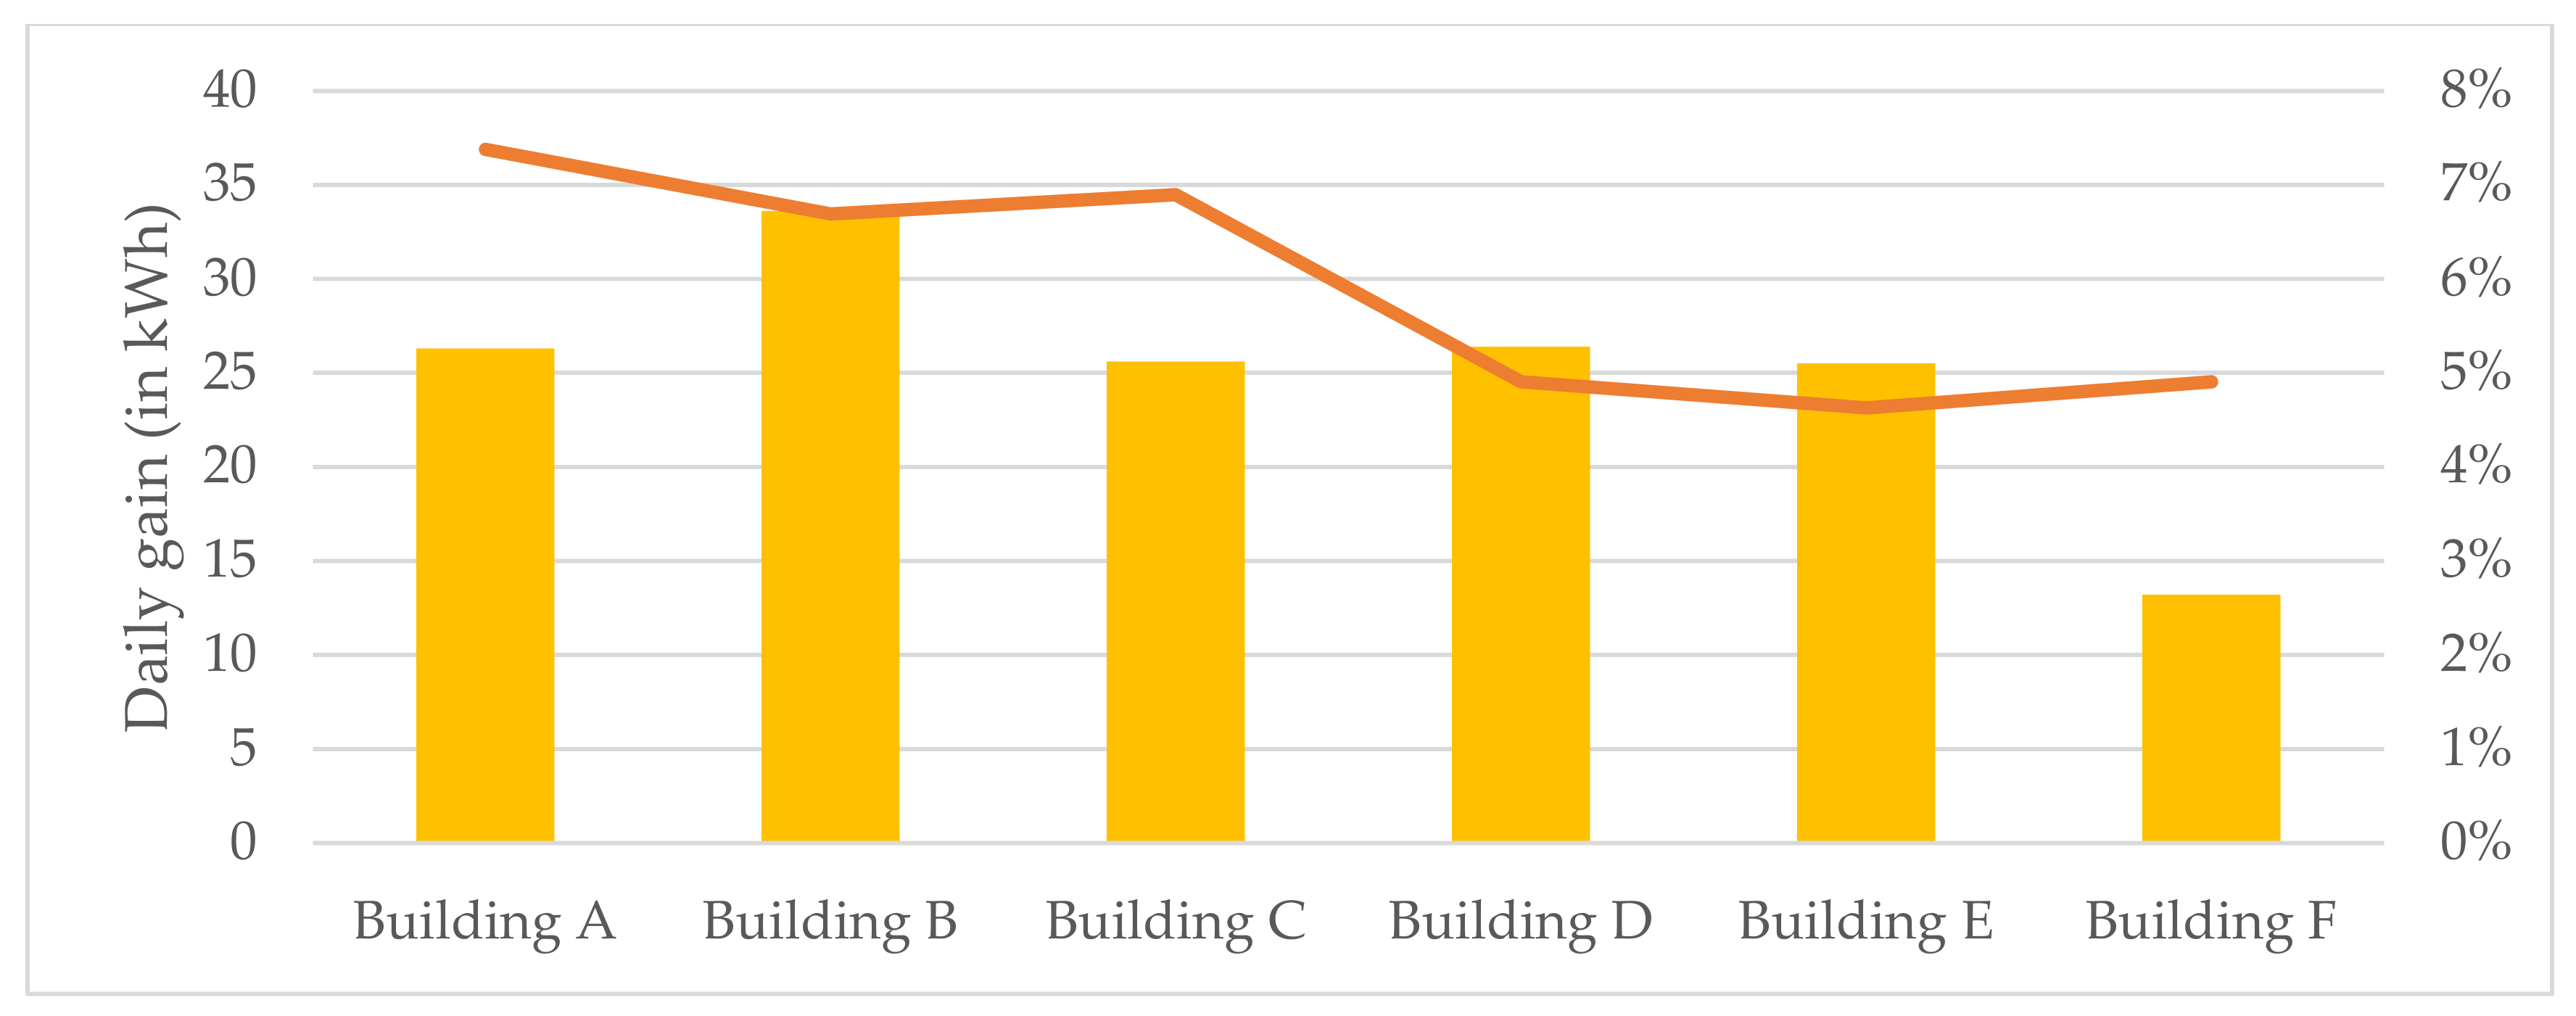
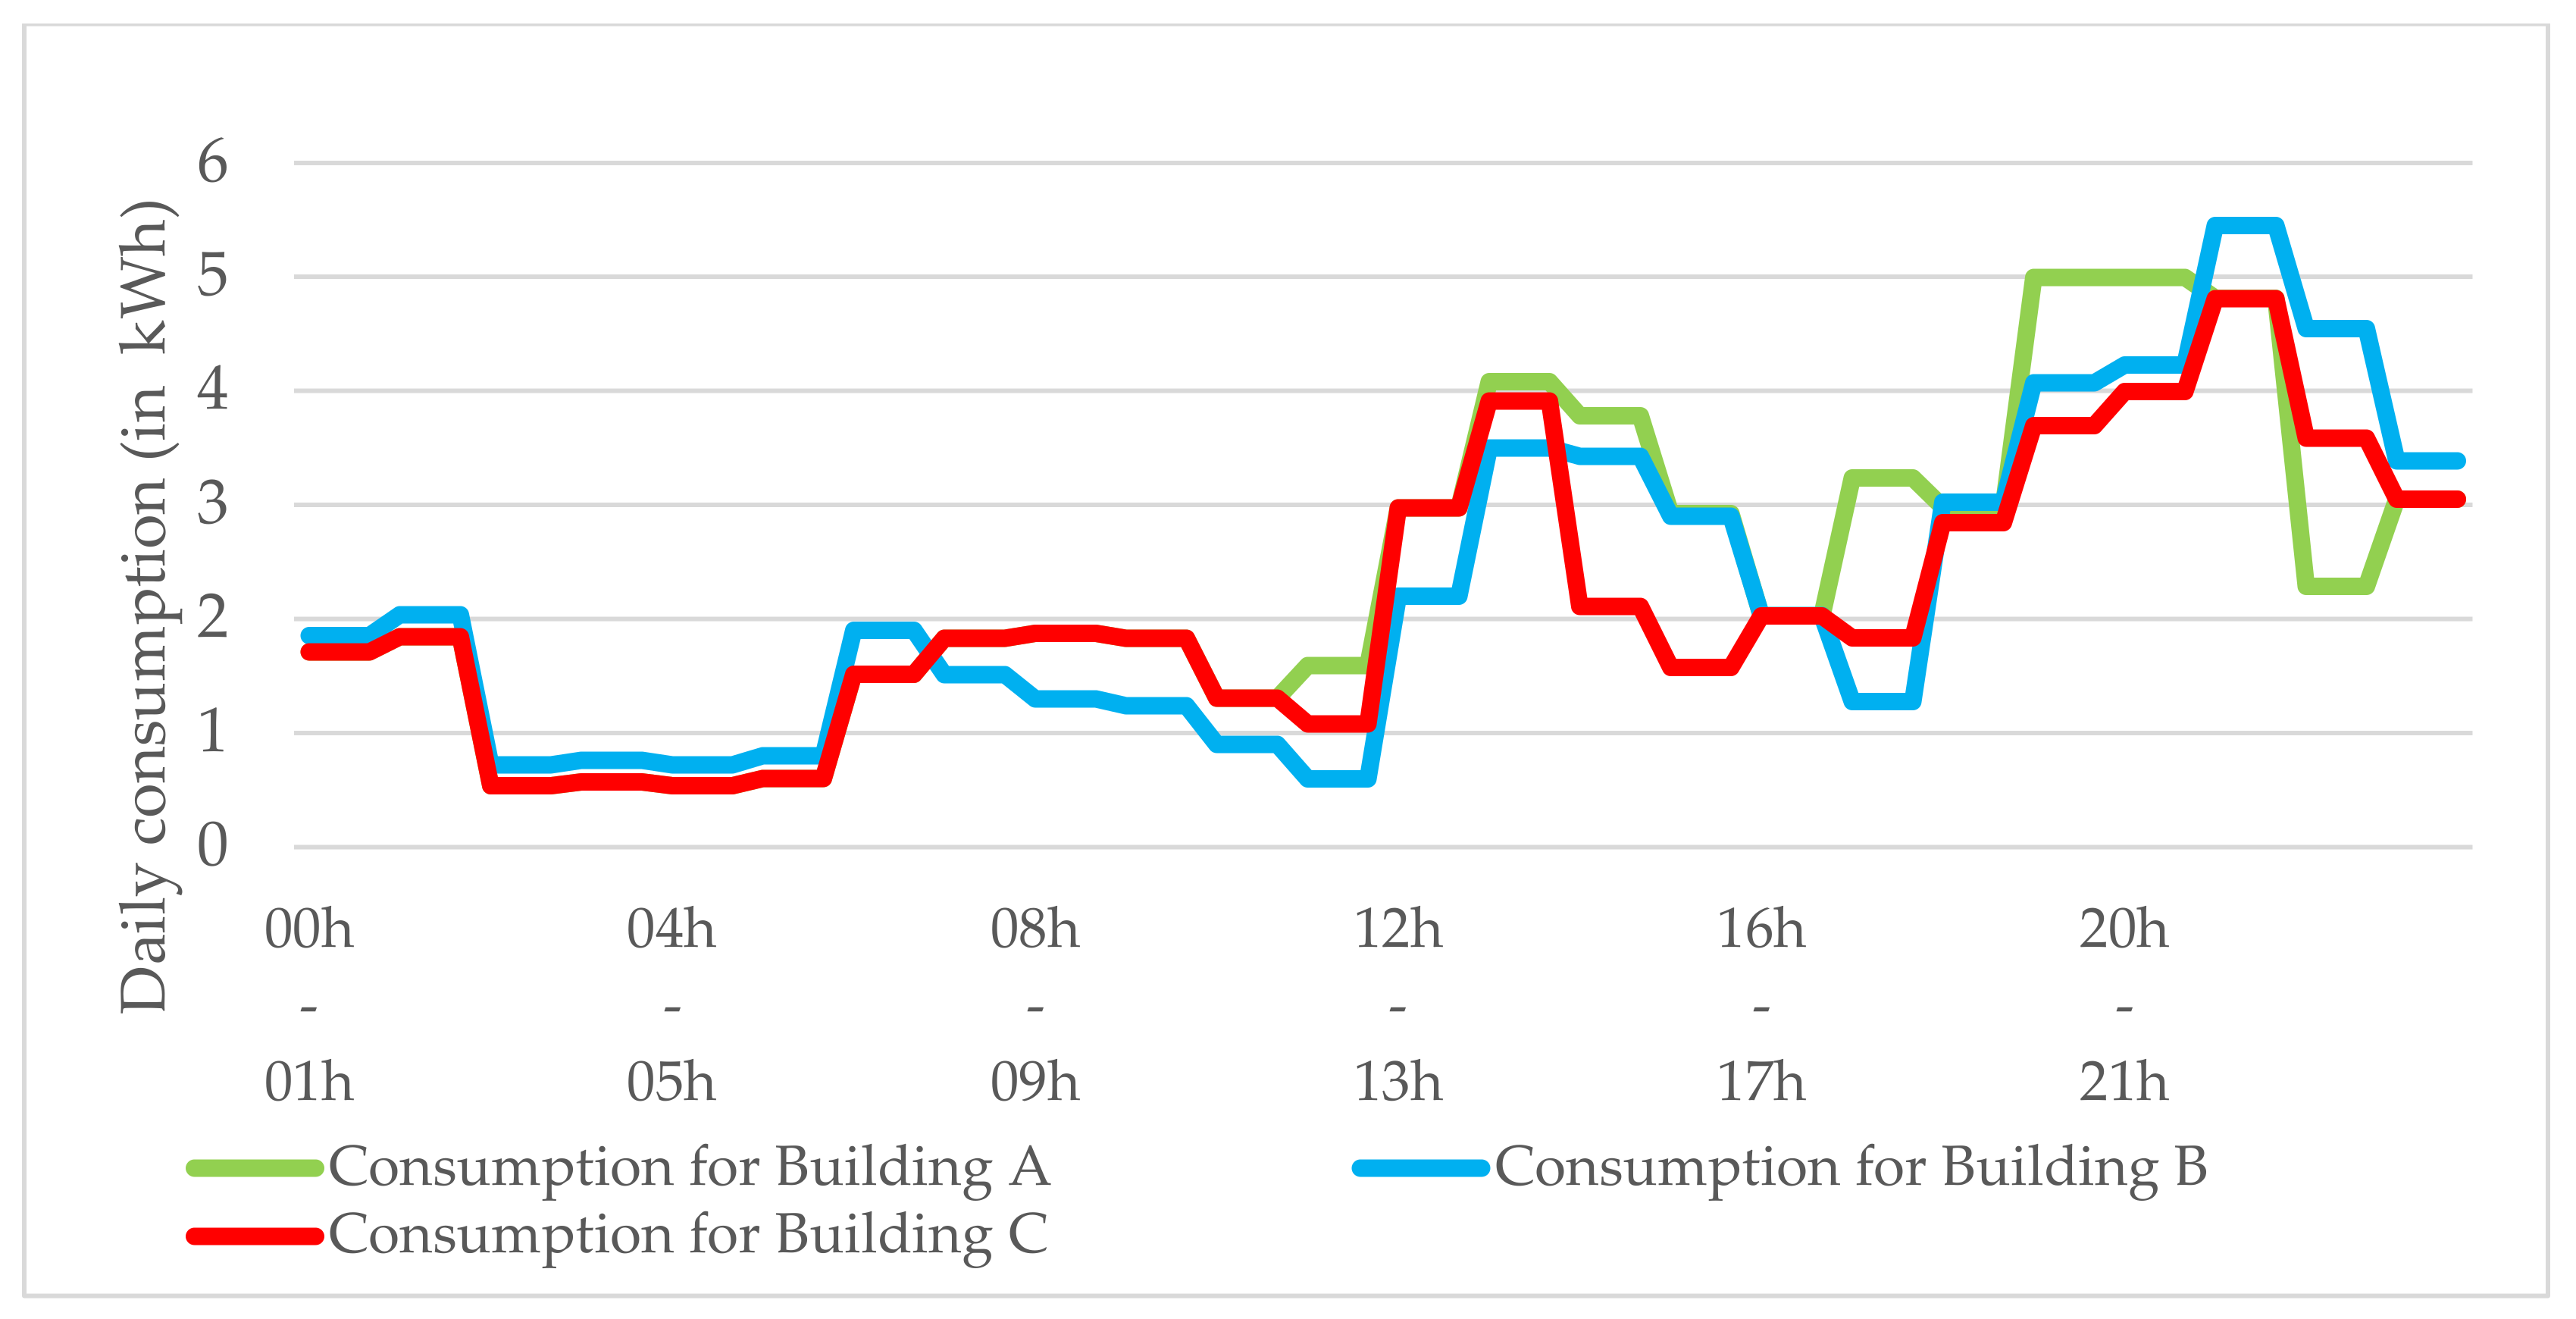
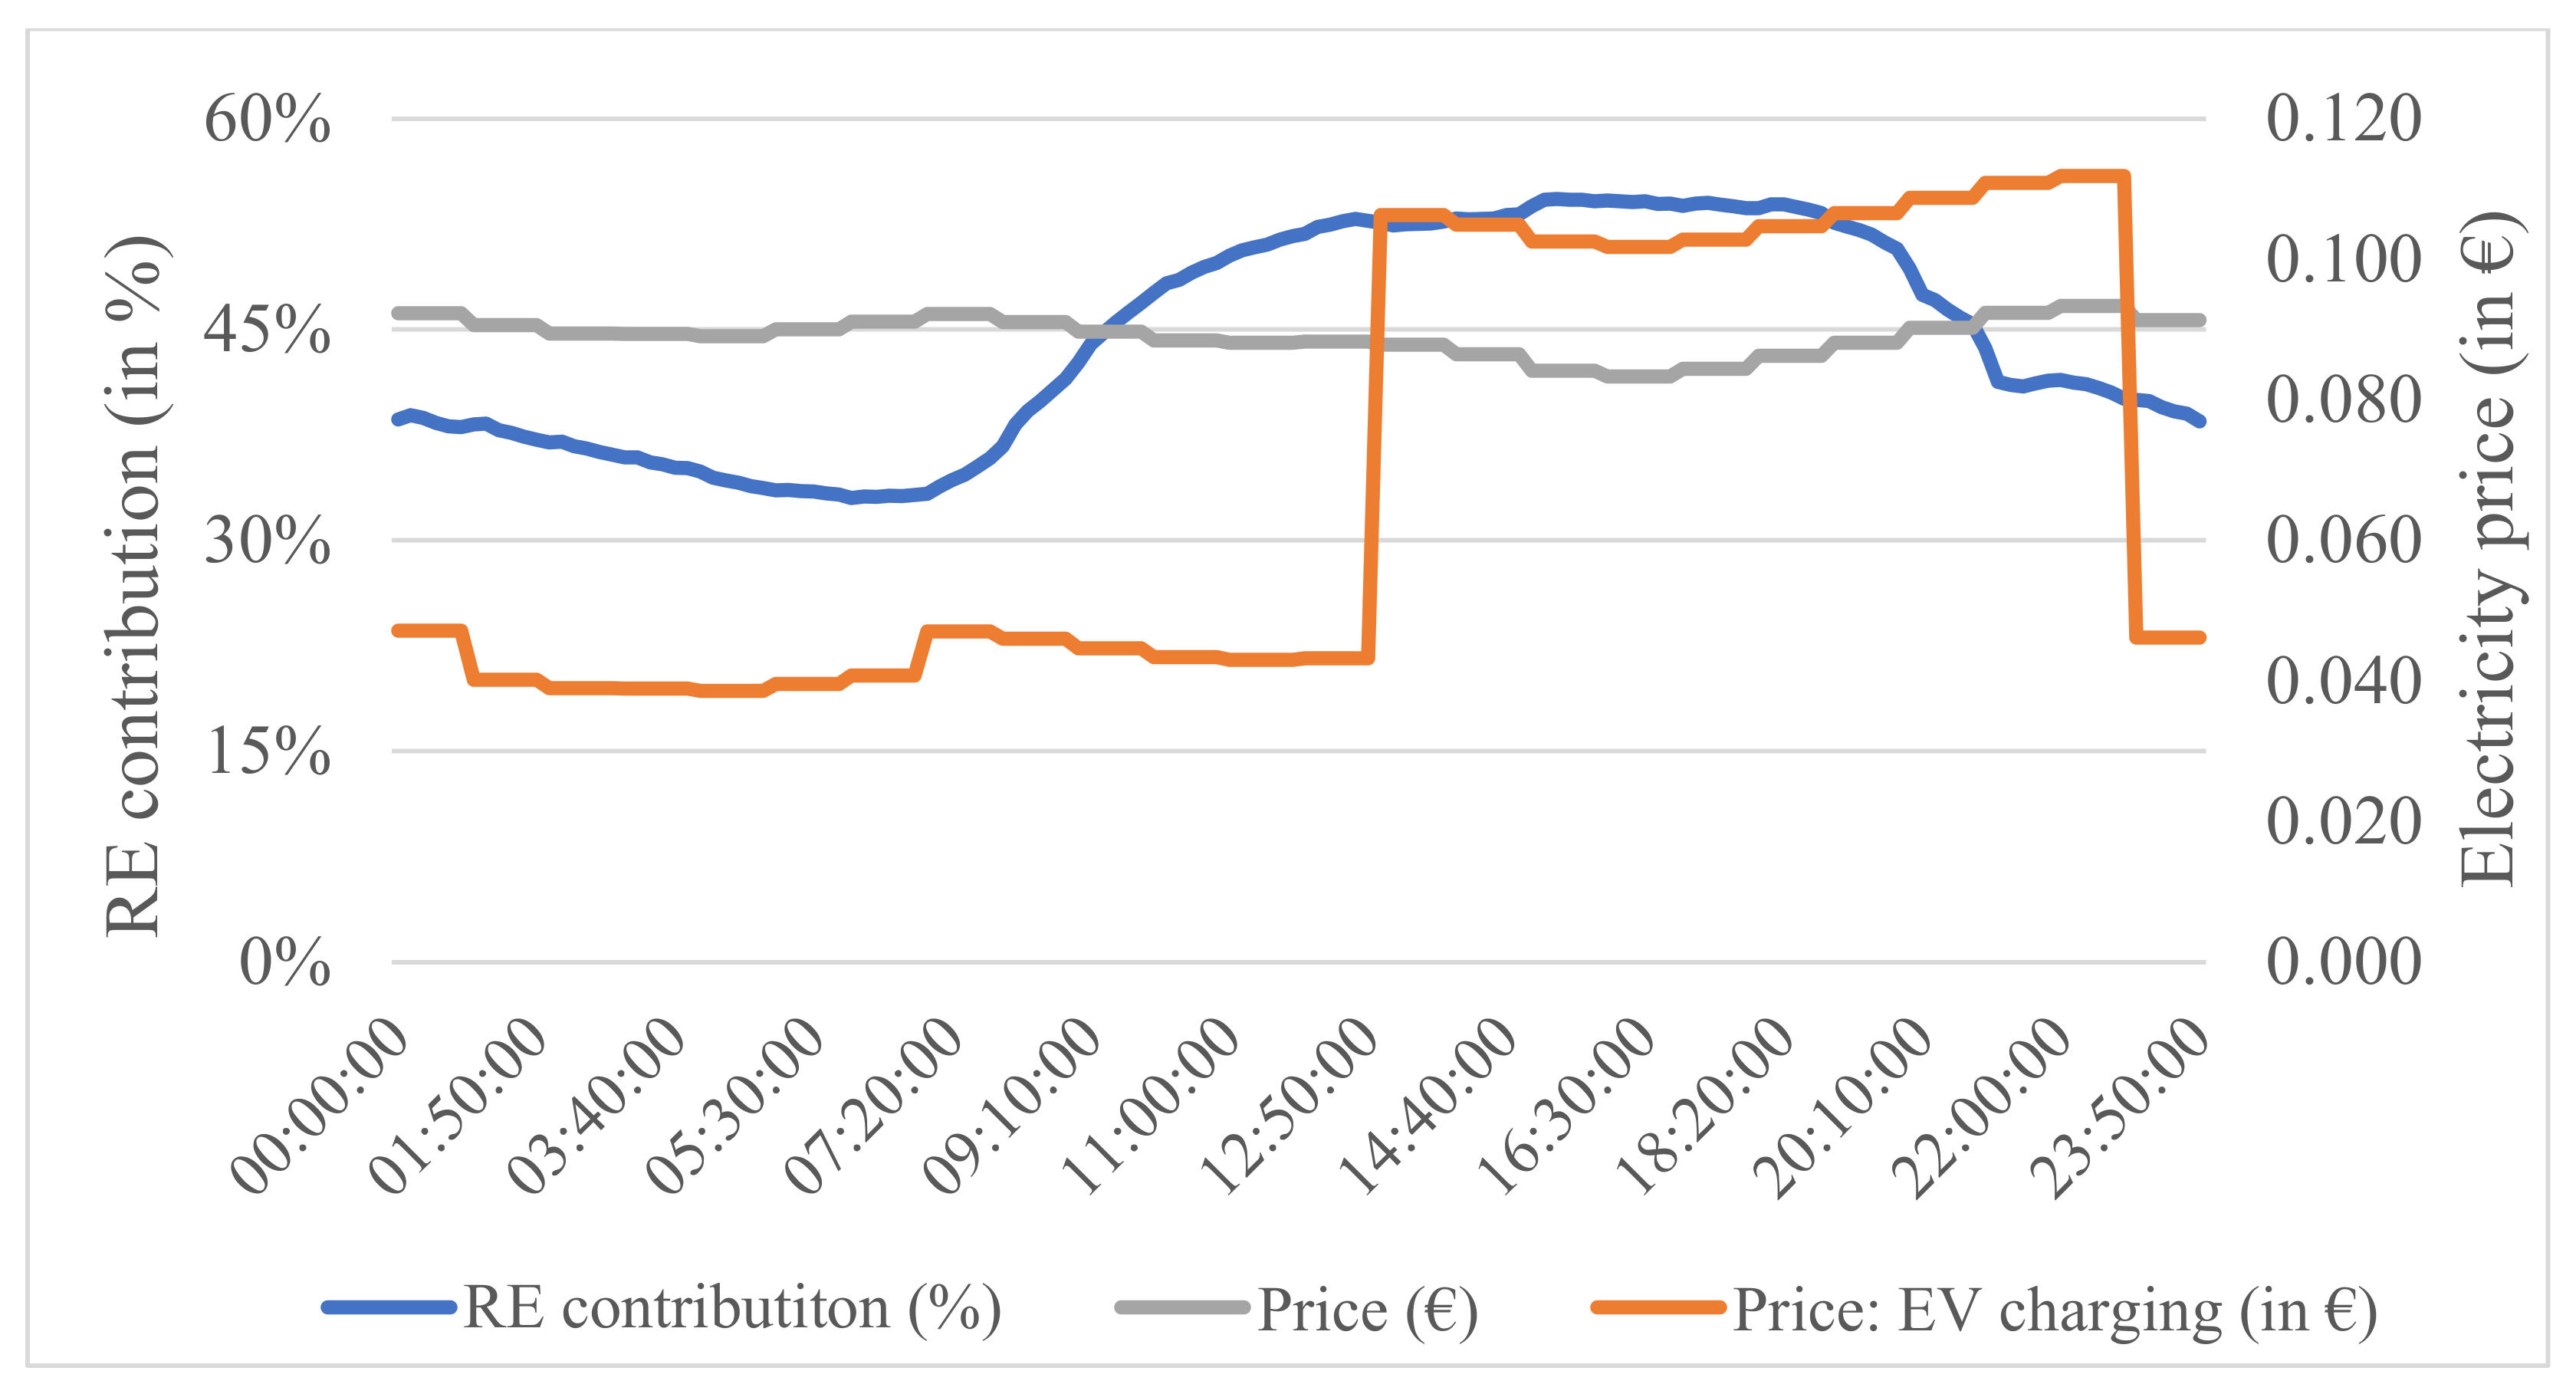
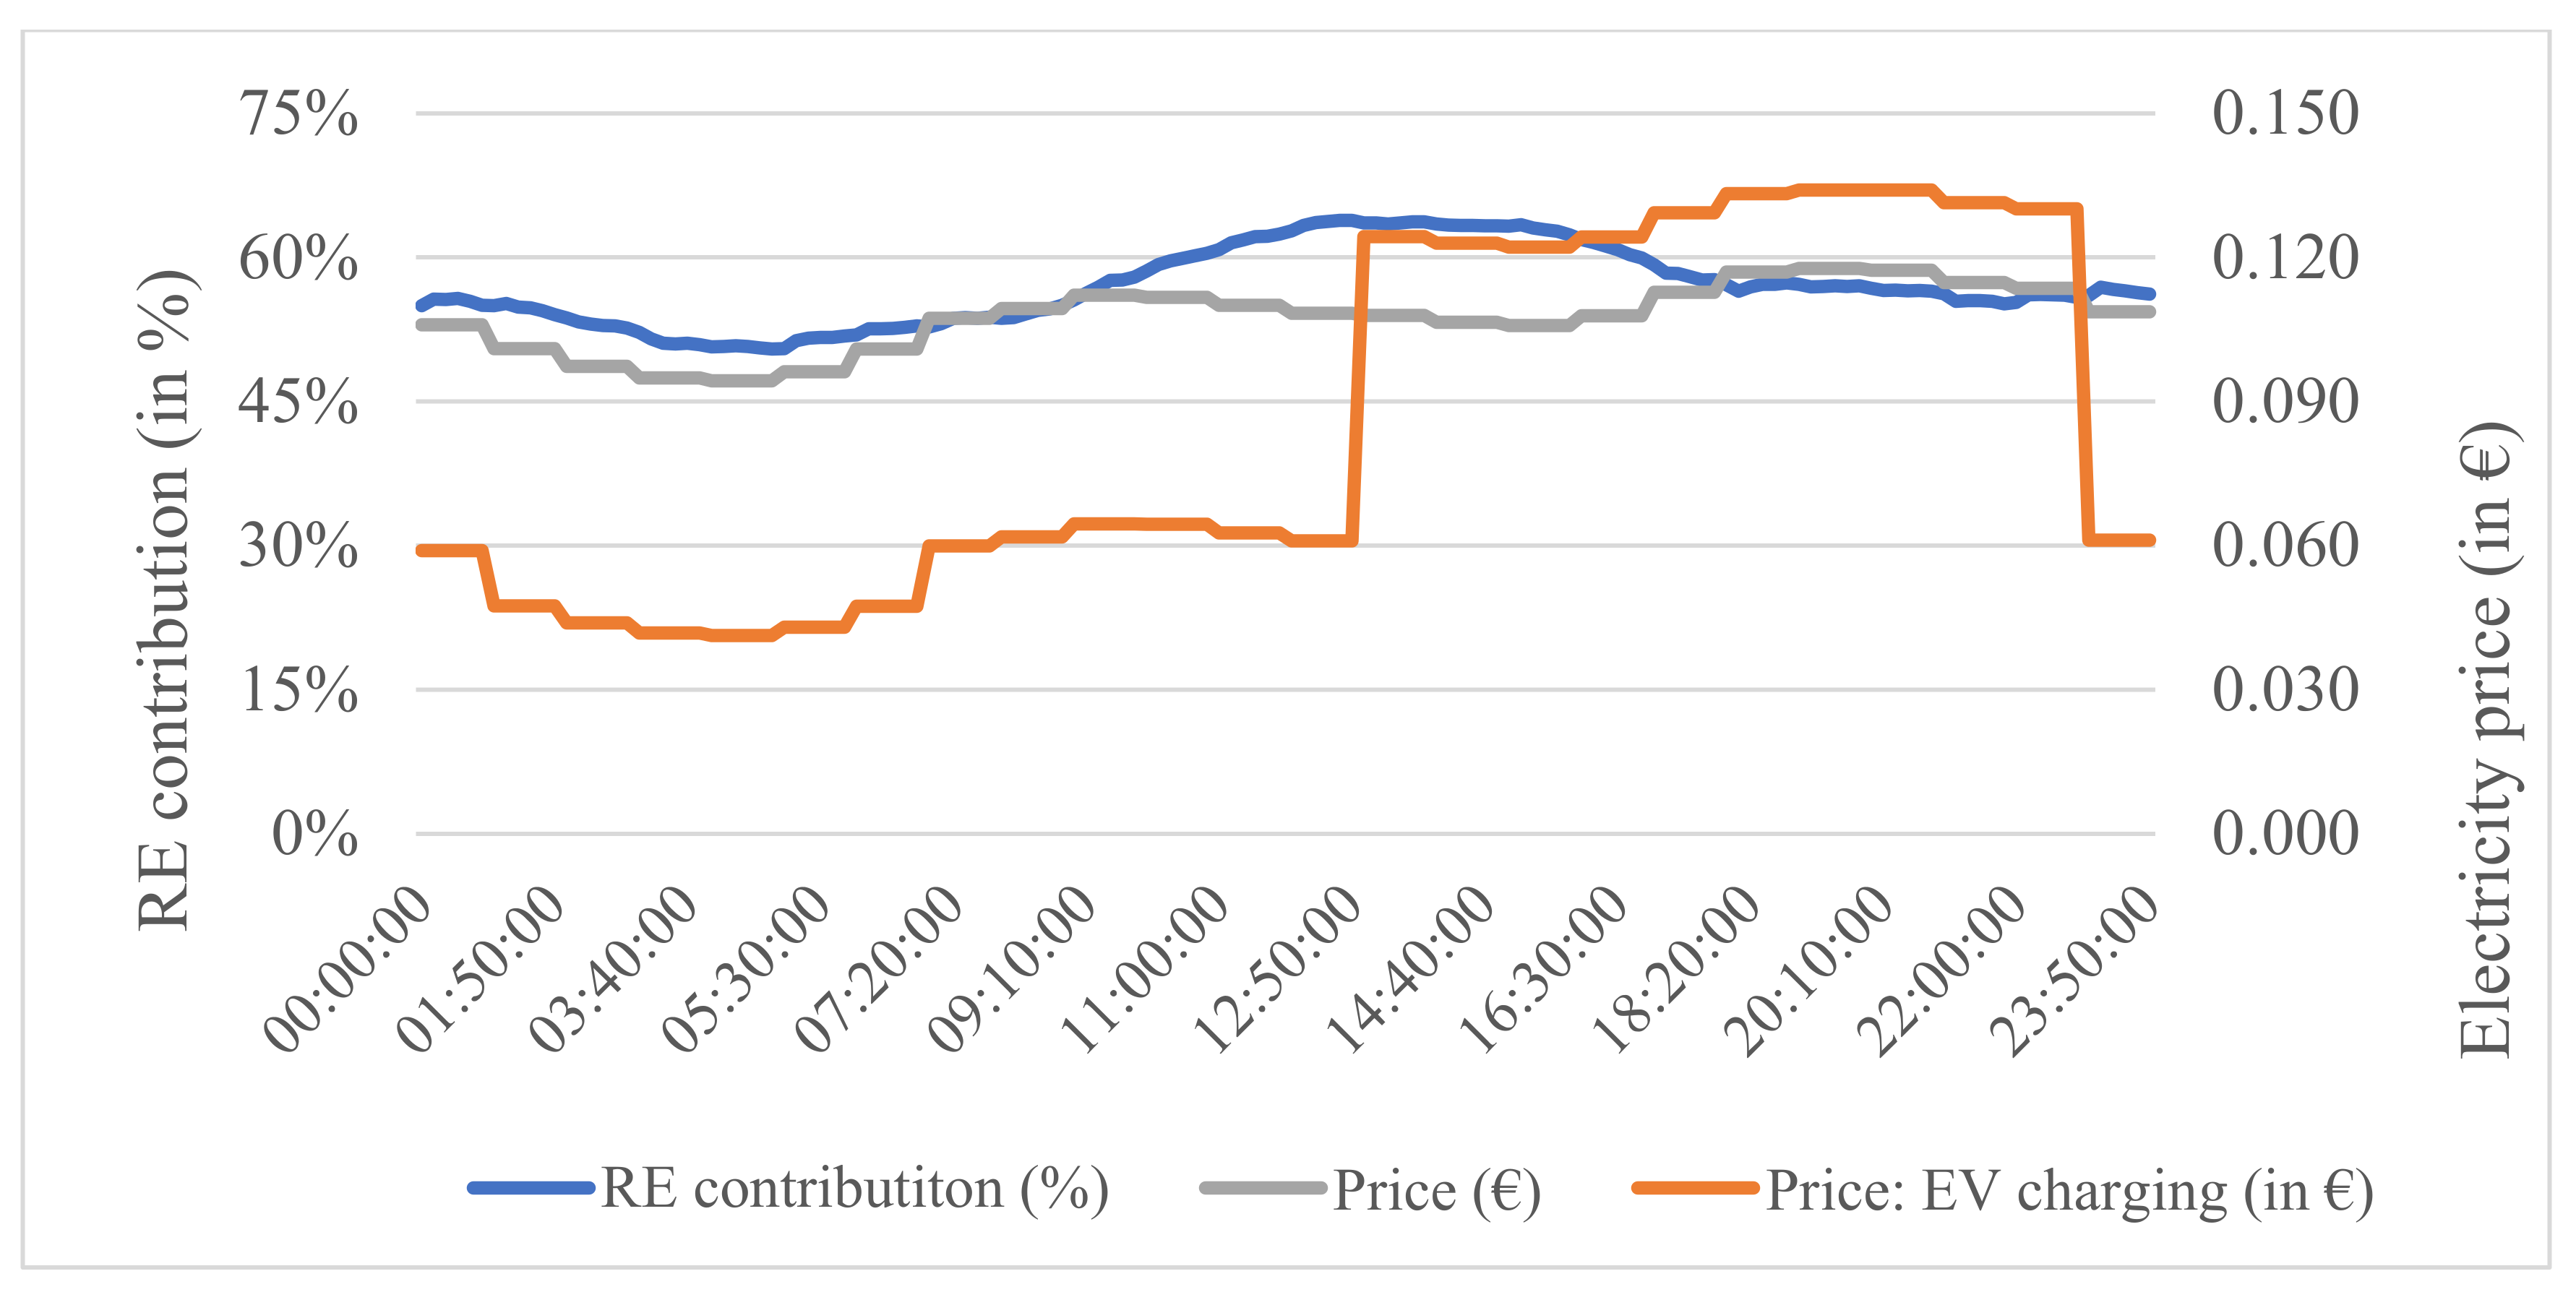
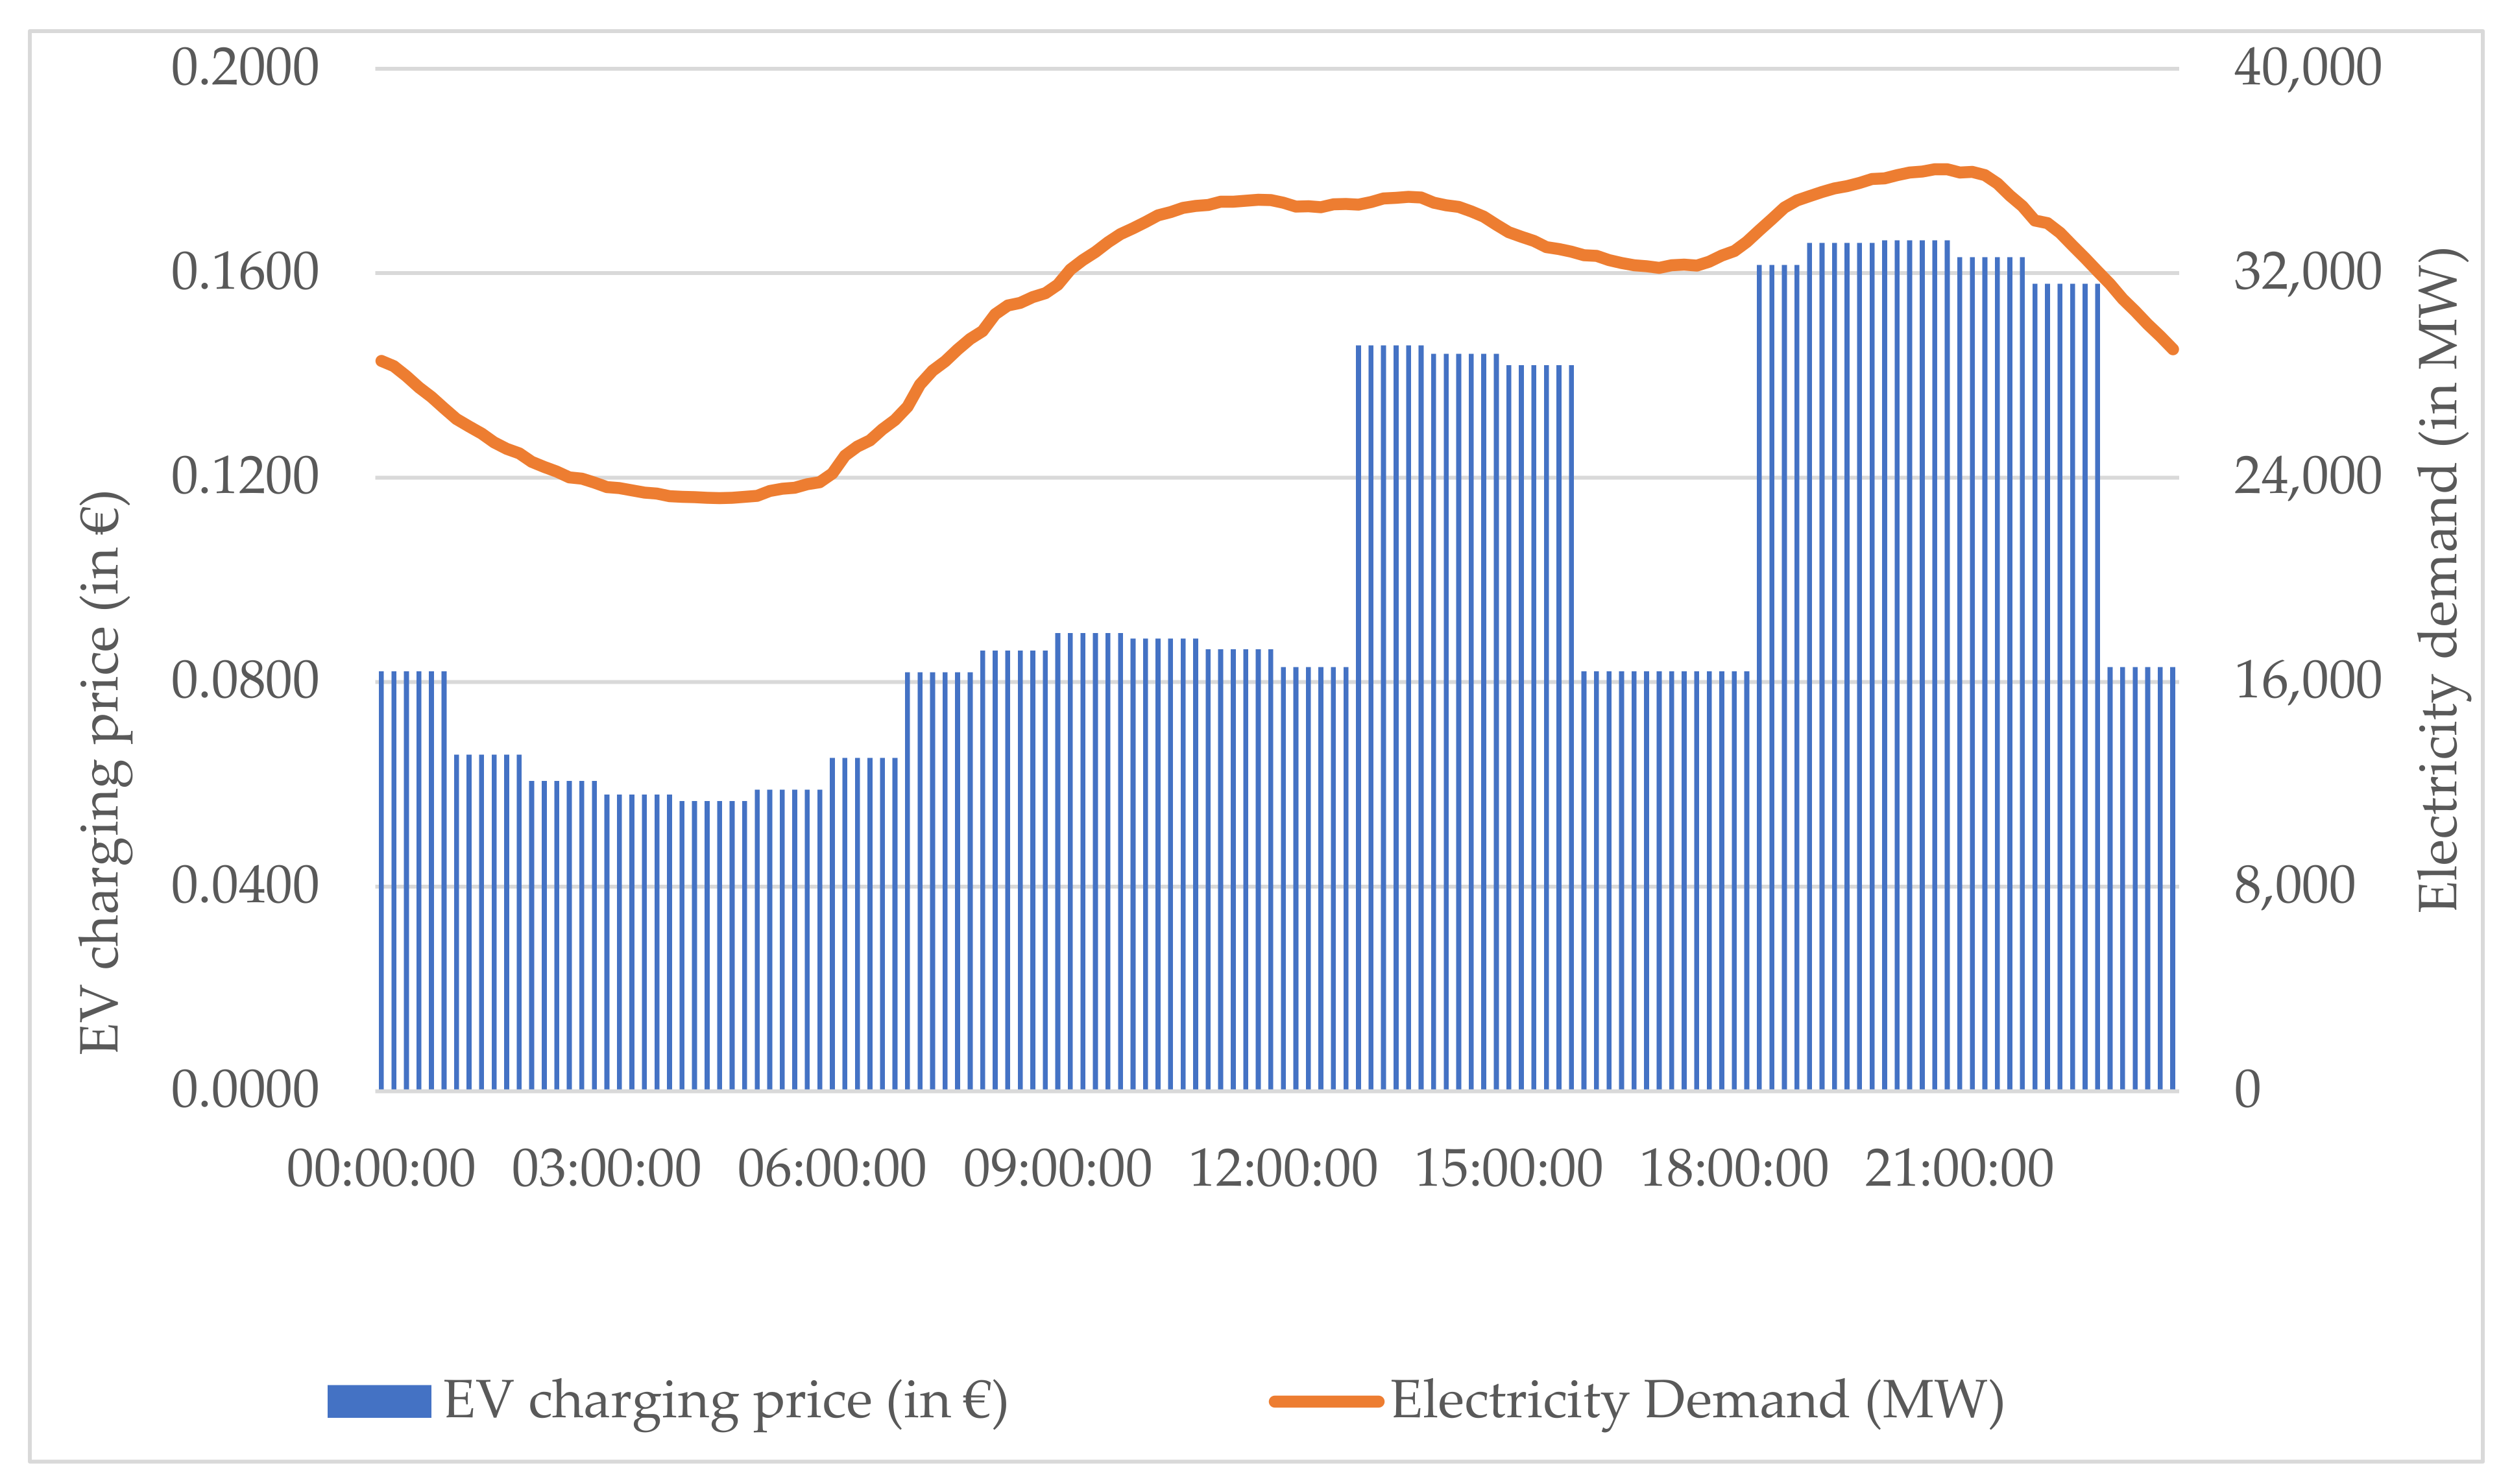
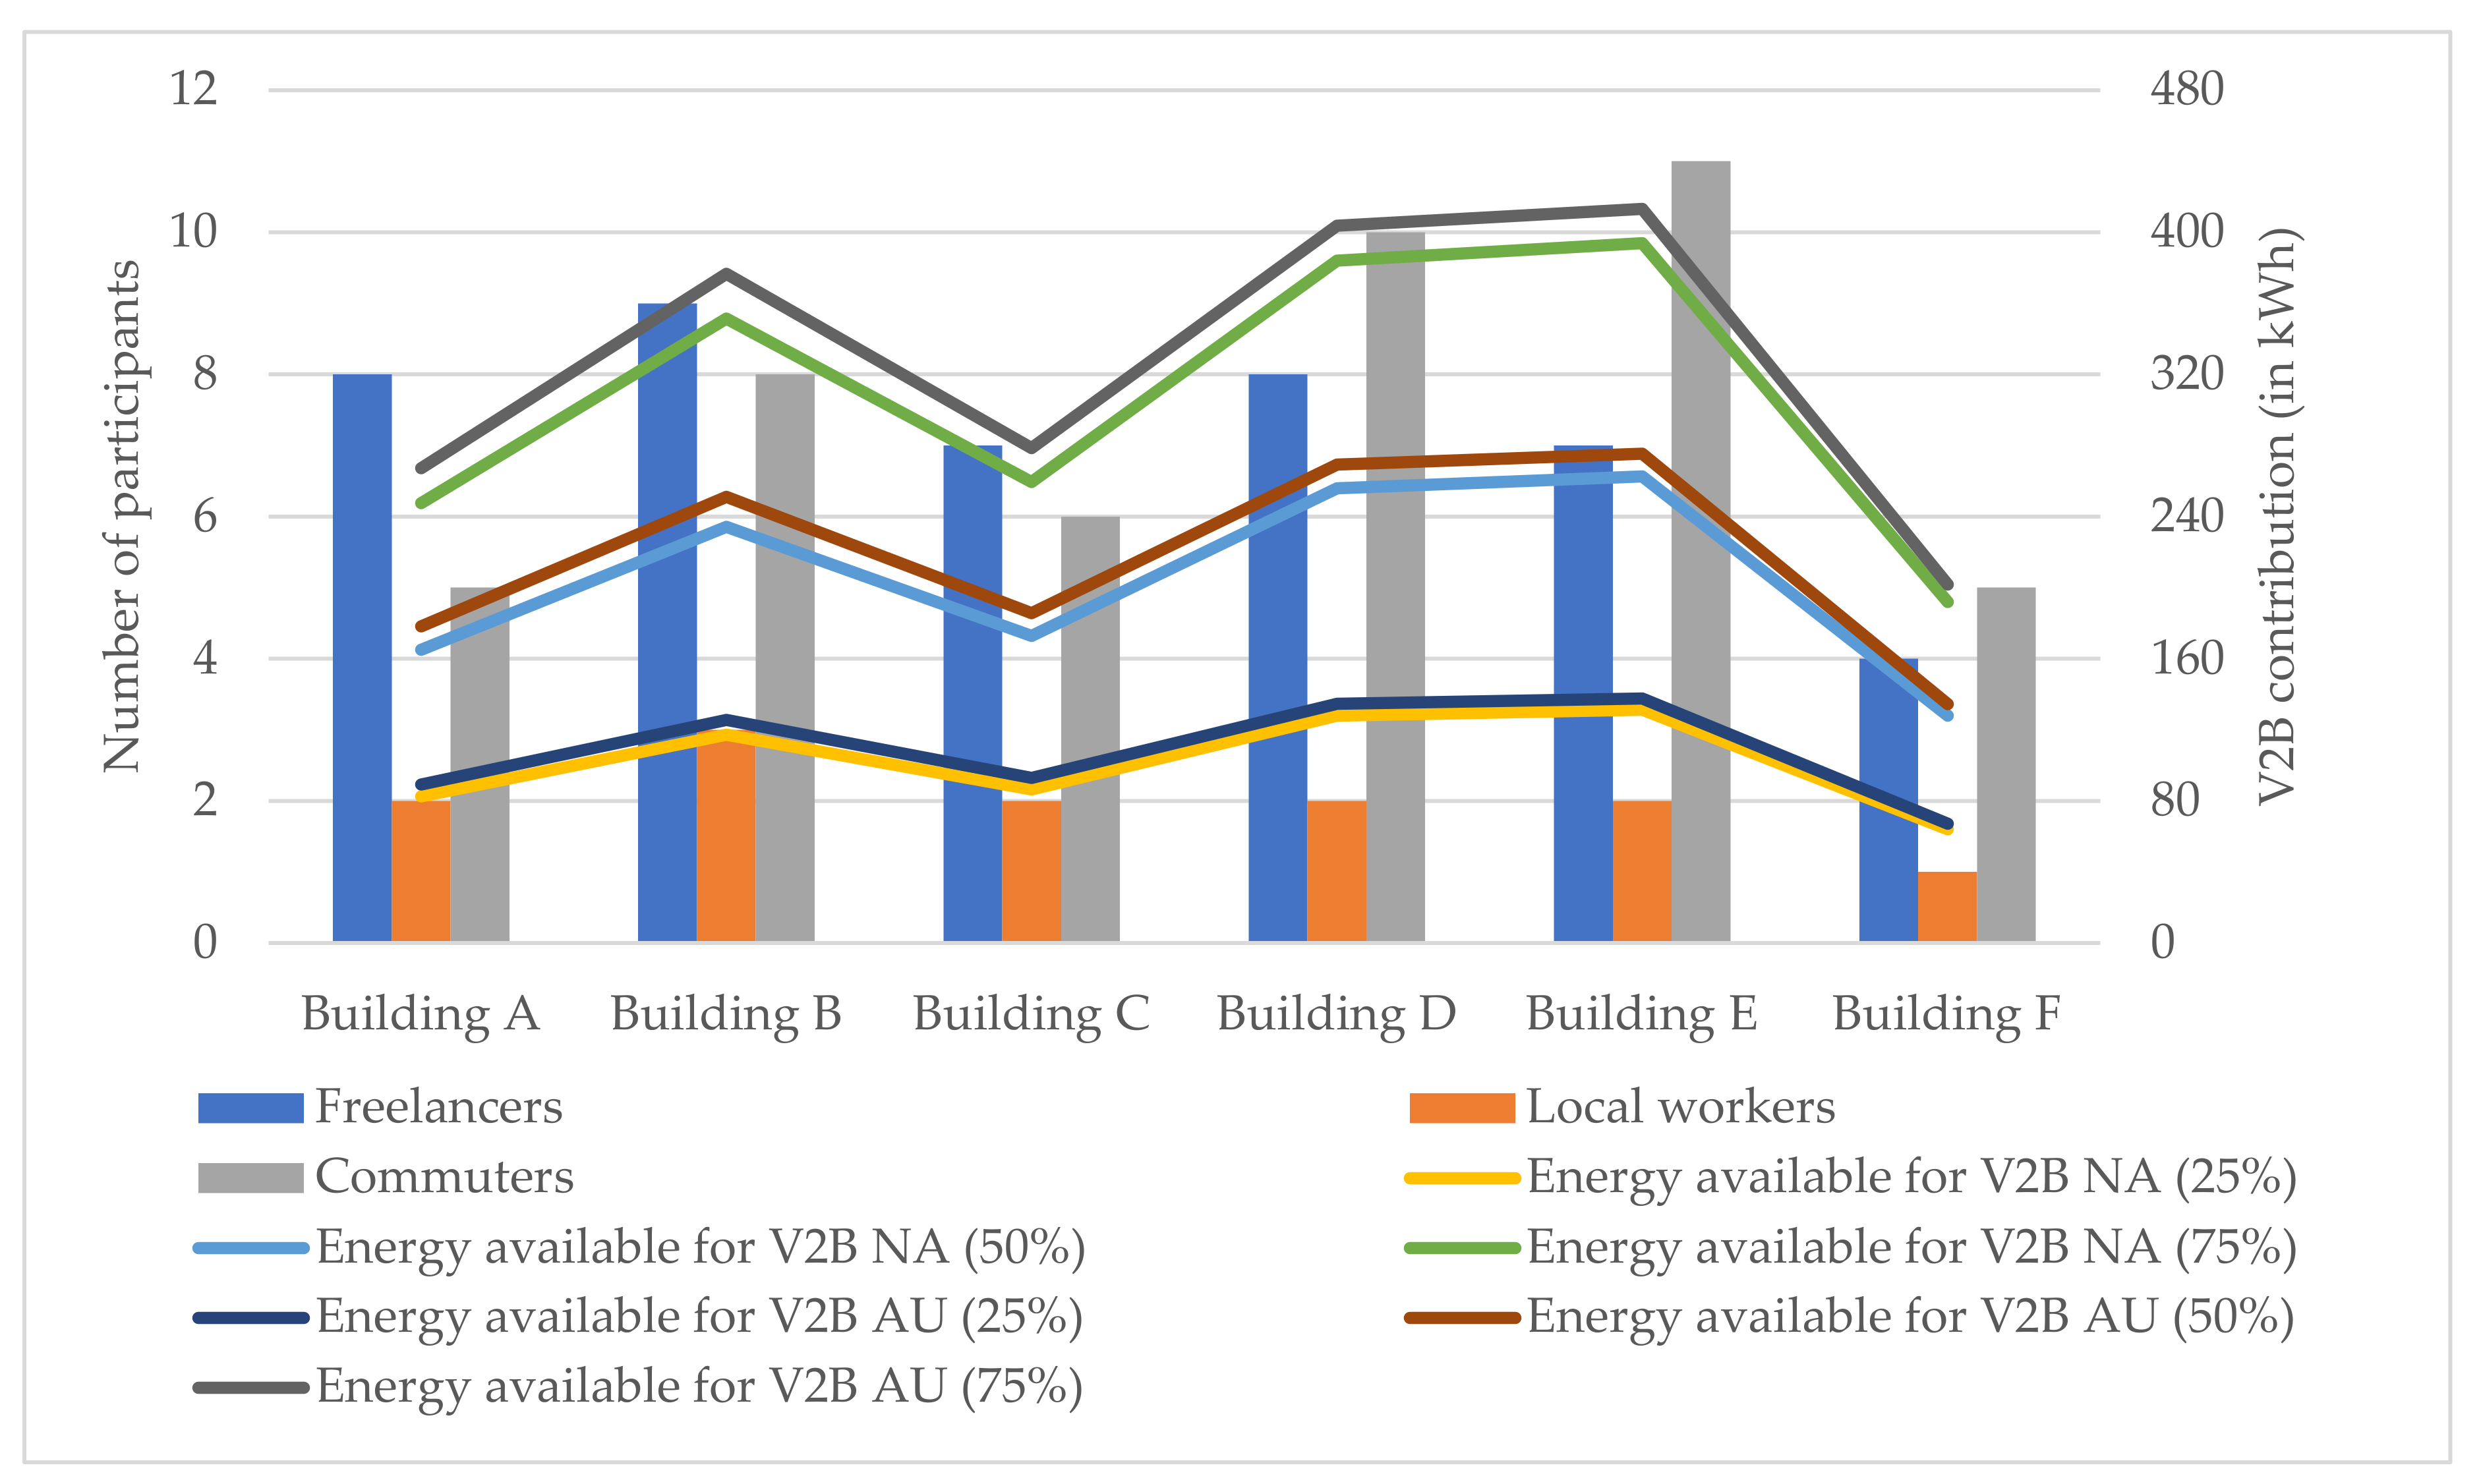
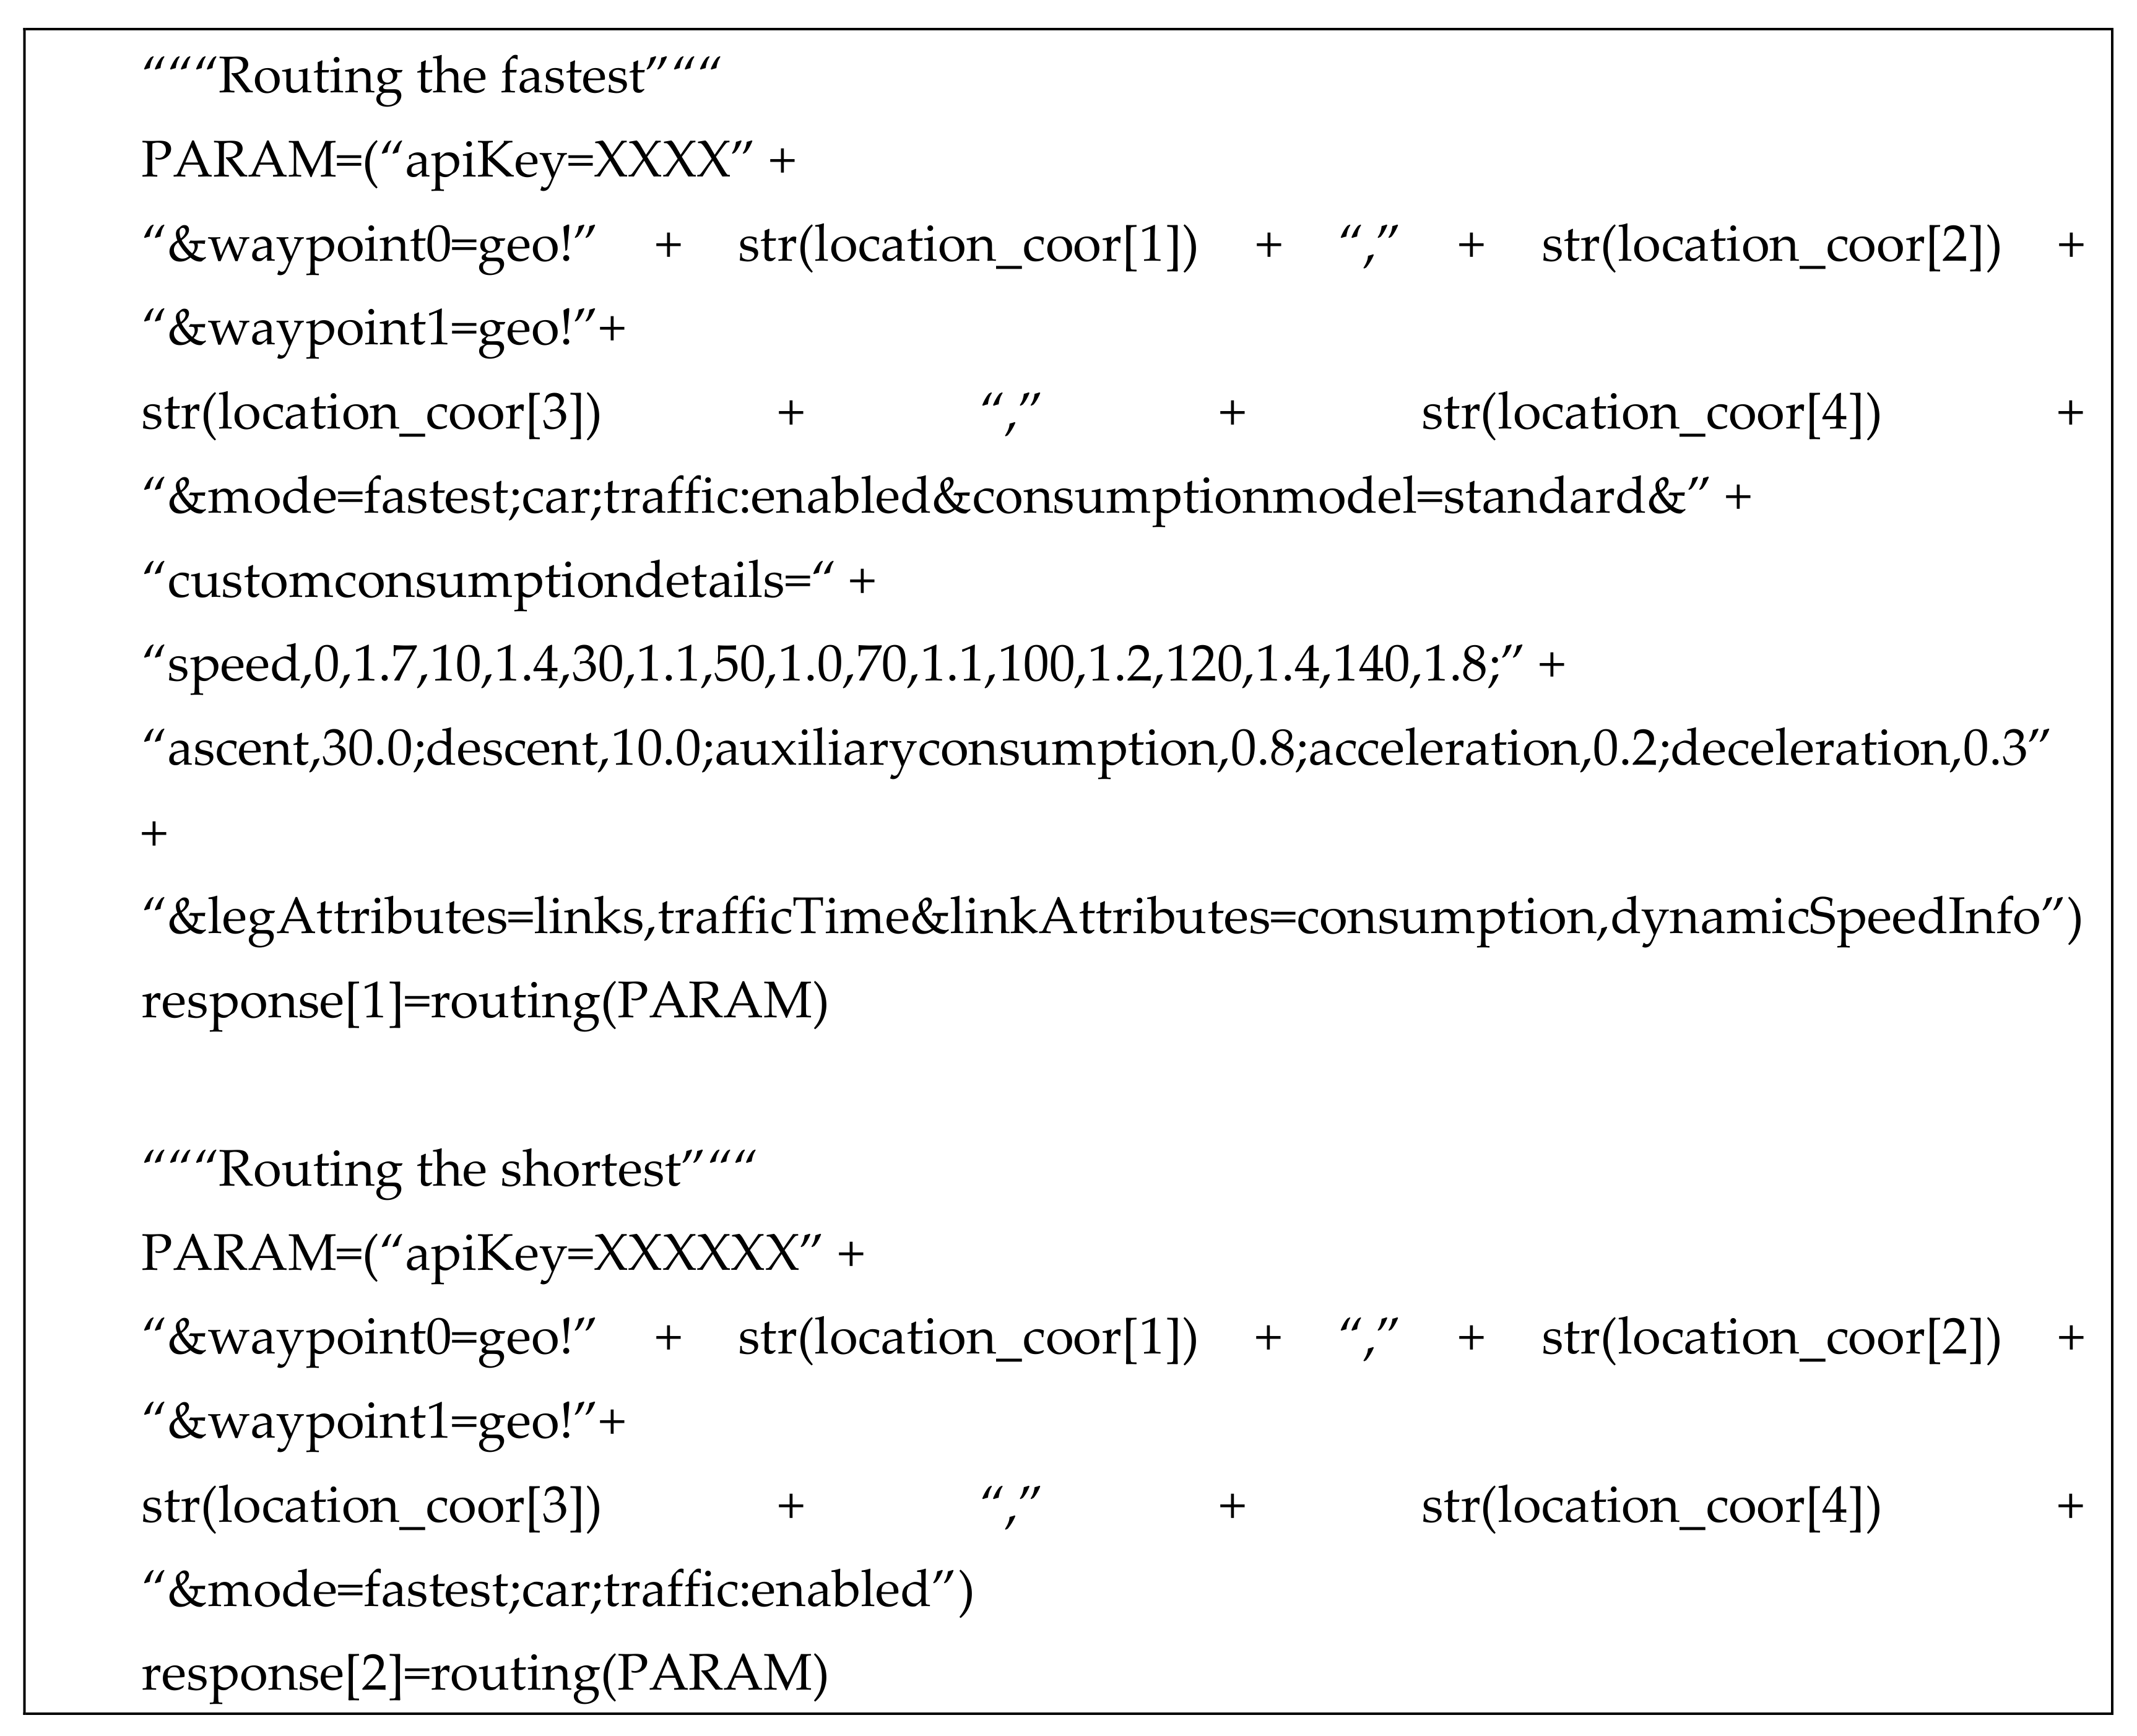
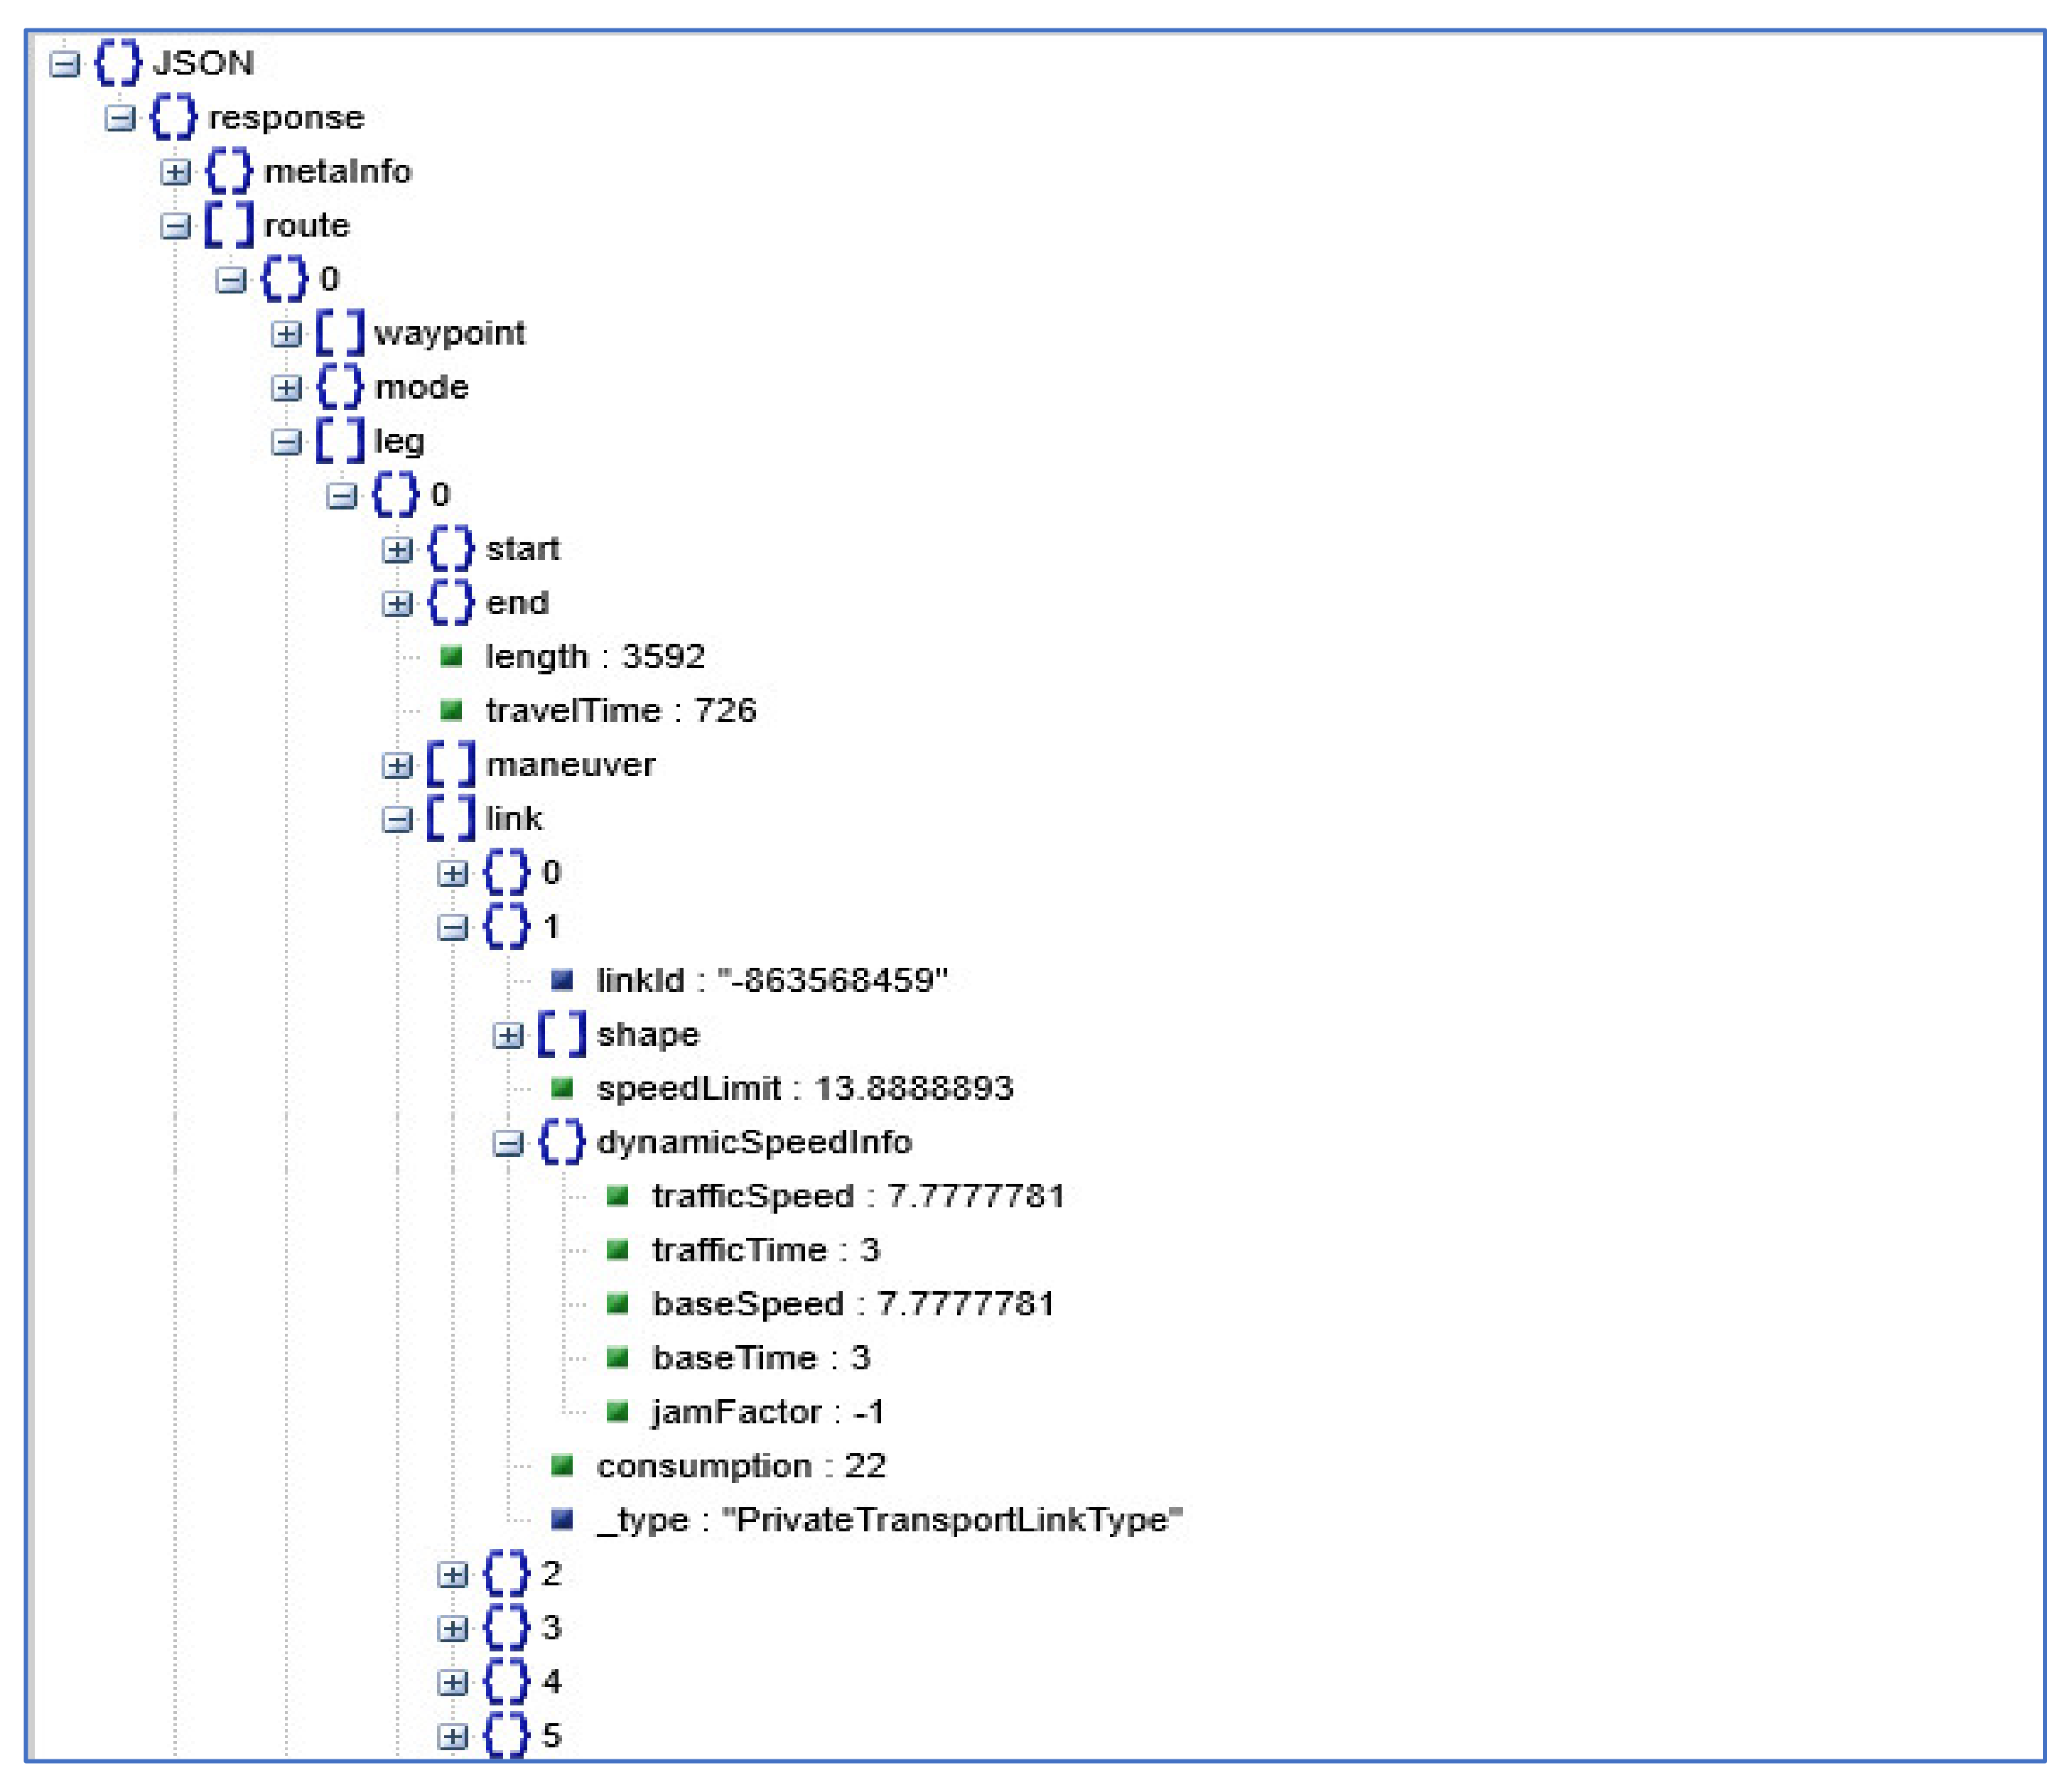
Table 1.
Number of participants in this research.
| Building | Location | Orientation | Average Surface (m2) | Occupants | Total Participants | Commuters | Local Workers | Freelancers | Rest of Occupants |
|---|---|---|---|---|---|---|---|---|---|
| A | Alcalá | South | 90 | 35 | 15 | 5 | 2 | 8 | 20 |
| B | Alcalá | North | 85 | 45 | 20 | 8 | 3 | 9 | 25 |
| C | Alcalá | West | 100 | 32 | 15 | 6 | 2 | 7 | 17 |
| D | Jaén | South | 75 | 42 | 20 | 10 | 2 | 8 | 22 |
| E | Jaén | North | 80 | 45 | 20 | 11 | 2 | 7 | 25 |
| F | Jaén | West | 90 | 12 | 10 | 5 | 1 | 4 | 2 |
Table 2.
EV consumption in kWh in Alcalá de Henares.
| Factor | Freelancers | Commuters | Local Workers | |||
|---|---|---|---|---|---|---|
| A.U. (1) | N.A. (2) | A.U. (1) | N.A. (2) | A.U. (1) | N.A. (2) | |
| Mean | 24 | 26.2 | 9 | 10.5 | 3.3 | 3.9 |
| Std deviation | 0.6 | 0.4 | 0.3 | 0.32 | 0.32 | 0.29 |
| Kurtosis | 3.7 | 4.0 | 3.7 | 4.5 | 4.1 | 4.2 |
| Skewness | −0.135 | −0.121 | −0.041 | −0.032 | −0.025 | −0.015 |
| p-value | 0.395 | 0.401 | 0.401 | 0.415 | 0.396 | 0.399 |
(1) N.A. means no algorithm is used; (2) A.U. means the algorithm is used.
Table 3.
EV consumption i kWh in Jaén.
| Factor | Freelancers | Commuters | Local Workers | |||
|---|---|---|---|---|---|---|
| A.U. (1) | N.A. (2) | A.U. (1) | N.A. (2) | A.U. (1) | N.A. (2) | |
| Mean | 21 | 22.9 | 8.5 | 9.5 | 4.3 | 4.9 |
| Std deviation | 0.7 | 0.3 | 0.4 | 0.36 | 0.36 | 0.31 |
| Kurtosis | 3.6 | 4.1 | 3.5 | 4.3 | 4.0 | 4.1 |
| Skewness | −0.145 | −0.111 | −0.045 | −0.03 | −0.02 | −0.013 |
| p-value | 0.385 | 0.301 | 0.411 | 0.405 | 0.356 | 0.349 |
(1) N.A. means no algorithm is used; (2) A.U. means the algorithm is used.
Table 4.
Energy available for each building in Alcalá de Henares and Jaén on a daily basis.
| Freelancers | Local Workers | Commuters | Energy Available for V2B A.U. | Energy Available for V2B NA | |||||||
|---|---|---|---|---|---|---|---|---|---|---|---|
| Number | kWh Available A.U. | kWh Available N.A. | Number | kWh Available A.U. | kWh Available N.A. | Number | kWh Available A.U. | kWh Available N.A. | |||
| Building A | 8 | 128 | 110.4 | 2 | 73.4 | 72.2 | 5 | 155 | 147.5 | 356.4 | 330.1 |
| Building B | 9 | 144 | 124.2 | 3 | 110.1 | 108.3 | 8 | 248 | 236 | 502.1 | 468.5 |
| Building C | 7 | 112 | 96.6 | 2 | 73.4 | 72.2 | 6 | 186 | 177 | 371.4 | 345.8 |
| Building D | 8 | 152 | 136.8 | 2 | 71.4 | 70.2 | 10 | 315 | 305 | 538.4 | 512 |
| Building E | 7 | 133 | 119.7 | 2 | 71.4 | 70.2 | 11 | 346.5 | 335.5 | 550.9 | 525.4 |
| Building F | 4 | 76 | 68.4 | 1 | 35.7 | 35.1 | 5 | 157.5 | 152.5 | 269.2 | 256 |
N.A. means no algorithm is used; A.U. means the algorithm is used.
Table 5.
Percentage of occupants belonging to each social group in Alcalá de Henares.
| Social Group | Sample size (Number of Households) | Probability of Success Assessed by Using the First Sample | Probability of Failure Obtained When Using the First Sample | Sample Size (Number of Households) | Probability of Success When Using the Second Sample | Ho Meaning | Ho Value (α = 0.01) |
|---|---|---|---|---|---|---|---|
| Freelancers | 150 | 0.15 | 0.85 | 100 | 0.16 | The percentage of freelancers is close to 15% | Accepted |
| Commuters who used their vehicles | 0.72 | 0.28 | 0.74 | The percentage of commuters and local workers are close to 72% and 13%, respectively | Accepted | ||
| Local workers | 0.13 | 0.87 | 0.14 | Accepted |
Table 6.
Percentage of occupants belonging to each social group in Jaén.
| Social Group | Sample Size (Number of Households) | Probability of Success Assessed by Using the First Sample | Probability of Failure Obtained When Using the First Sample | Sample Size (Number of Households) | Probability of Success When Using the Second Sample | Ho Meaning | Ho Value (α = 0.01) |
|---|---|---|---|---|---|---|---|
| Freelancers | 150 | 0.33 | 0.77 | 100 | 0.35 | The percentage of freelancers is close to 33% | Accepted |
| Commuters who used their vehicles | 0.45 | 0.55 | 0.49 | The percentage of commuters and local workers are close to 45% and 22%, respectively | Accepted | ||
| Local workers | 0.22 | 0.78 | 0.23 | Accepted |
Table 7.
Factors chosen for validity of this research assessment.
| Id Factor | Factor | Description |
|---|---|---|
| 1 | Choice of the city | When choosing the cities for this study, several factors were taken into account such as the size of the city, population, traffic analysis, distribution cameras controlling the traffic, the car park trend, etc. In addition, climactic zones were also considered to check as the battery performance may change. Taking into consideration these factors, the authors concluded that Jaén and Alcalá de Henares met the requirements for this research. |
| 2 | Choice of the social groups | Not all users have the same driving profile. It would not be accurate to estimate energy without considering this factor. The authors have considered it to be of paramount importance to give a breakdown of the population of these two cities. Firstly, freelancers as they use Evs frequently, and they are supposed not to have important amount of energy to contribute to V2B. Secondly, people who usually use public transport to commute. Therefore, their contribution to V2B will be important. Finally, other workers who work outside Alcala and Jaén or work in Alcala and Jaén. |
| 3 | Choice of the buildings | An analysis was done based on an in-depth literature review (Section 2.3) in order to determine the optimal criteria for choosing the buildings considered in this research. |
Publisher’s Note: MDPI stays neutral with regard to jurisdictional claims in published maps and institutional affiliations. |
© 2021 by the authors. Licensee MDPI, Basel, Switzerland. This article is an open access article distributed under the terms and conditions of the Creative Commons Attribution (CC BY) license (https://creativecommons.org/licenses/by/4.0/).
Share and Cite
MDPI and ACS Style
Borge-Diez, D.; Ortega-Cabezas, P.M.; Colmenar-Santos, A.; Blanes-Peiró, J.J. Contribution of Driving Efficiency to Vehicle-to-Building. Energies 2021, 14, 3483. https://doi.org/10.3390/en14123483
AMA Style
Borge-Diez D, Ortega-Cabezas PM, Colmenar-Santos A, Blanes-Peiró JJ. Contribution of Driving Efficiency to Vehicle-to-Building. Energies. 2021; 14(12):3483. https://doi.org/10.3390/en14123483
Chicago/Turabian StyleBorge-Diez, David, Pedro Miguel Ortega-Cabezas, Antonio Colmenar-Santos, and Jorge Juan Blanes-Peiró. 2021. "Contribution of Driving Efficiency to Vehicle-to-Building" Energies 14, no. 12: 3483. https://doi.org/10.3390/en14123483
Note that from the first issue of 2016, this journal uses article numbers instead of page numbers. See further details here.