Anther Extrusion and Its Association with Fusarium Head Blight in CIMMYT Wheat Germplasm


1
International Maize and Wheat Improvement Center (CIMMYT), Apdo. Postal 6-641, 06600 Mexico DF, Mexico
2
Institute of Cotton Research, Chinese Academy of Agricultural Sciences, Anyang 455000, China
3
International Maize and Wheat Improvement Center (CIMMYT) China Office, c/o CAAS, 12 Zhongguancun South Street, Beijing 100081, China
*
Authors to whom correspondence should be addressed.
Agronomy 2020, 10(1), 47; https://doi.org/10.3390/agronomy10010047
Submission received: 2 November 2019
/
Revised: 21 December 2019
/
Accepted: 25 December 2019
/
Published: 28 December 2019
(This article belongs to the Special Issue Breeding Healthy Cereals: Genetic Improvement of Fusarium Resistance)
Abstract
:Pronounced anther extrusion (AE) is associated with field resistance to Fusarium head blight (FHB), one of the most devastating diseases of wheat globally. In this study, two recombinant inbred line (RIL) populations were used to map quantitative trait loci (QTL) for AE and field FHB resistance and to investigate the association of both traits at the genetic level. Furthermore, two panels of International Maize and Wheat Improvement Center (CIMMYT) wheat breeding lines were evaluated to describe the phenotypic association between the two traits in detail. Highly significant negative correlation was identified between AE and FHB severity in the two populations and the two panels, with r-values ranging from 0.55 to 0.74. QTL analysis in the two RIL populations identified 12 QTL for AE and nine for FHB resistance, of which five QTL located on chromosomes 3BL, 4BS, 4DS, 5AL, and 5BL were associated with both AE and FHB, collectively explaining over 50% of phenotypic variation for FHB. The QTL on chromosomes 4BS, 4DS, 5AL, and 5BL were closely linked to Rht-B1, Rht-D1, Vrn-A1, and Vrn-B1 genes, respectively. In conclusion, AE is closely related to field FHB resistance and could be used as a morphological marker in wheat breeding for field FHB resistance.
1. Introduction
Bread wheat (Triticum aestivum L.) is a staple food crop and one of the most widely grown around the world [1]. To meet future food demands, wheat yield and quality must be enhanced. Fusarium head blight (FHB) is one of the most devastating diseases of wheat globally, which leads to yield losses, quality degradation, and mycotoxin contamination, greatly threatening food and feed safety [2].
Host resistance to FHB is quantitatively inherited and influenced significantly by the environment, making breeding for this trait a difficult task. Multiple mechanisms of host resistance to FHB have been recognized, including Type I for initial infection, Type II for spread of pathogen in spike tissues, Type III for deoxynivalenol (DON) accumulation, Type IV for kernel infection, and Type V for yield reduction [3]. For the wheat plant, Type I resistance exhibits frequent association with phenological, morphological, and flower biology traits, such as plant height (PH), days to heading (DH), and anther extrusion (AE) [4,5,6].
Similar to FHB, AE is characterized as a quantitative trait controlled by many genes and is currently widely studied to promote the cross-pollination ability in hybrid wheat [7,8]. It is also suggested as one of the resistance mechanisms to FHB [4,5,9]. Selection of wheat lines with high AE could be a good strategy for breeders to adopt when breeding against FHB [10]. AE usually shows a negative correlation with FHB severity in the field, where partially extruded anthers are associated with increased FHB infection and fully extruded anthers are associated with reduced FHB infection [5,9,11]. Anthers are a nutrition-rich organ and have high concentrations of growth stimulants such as betaine and choline, facilitating the initial infection by the FHB pathogen [12,13,14]. If the anthers are only partially extruded, or stuck between palea and lemma, they serve as a bridge to facilitate the infection of FHB into the floret cavity; however, if the anthers are fully extruded, it becomes more difficult for the FHB pathogen colonized on the anthers to infect other floret tissue [4].
In the last decade, quantitative trait loci (QTL) for AE were detected on numerous wheat chromosomes, including 1A, 1B, 1D, 2A, 2B, 2D, 3B, 4A, 4B, 4D, 5A, 5B, 5D, 6A, 6B, and 7A [1,4,8,9,15,16,17]. However, most of these QTL were of minor effects except for two on 4BS and 4DS linked to Rht-B1 and Rht-D1, respectively, and one on 5AL [9,15,17]. In addition to genetic factors, environmental factors such as temperature and humidity also contribute to the degree of AE in wheat [18].
PH is another trait closely related to field FHB resistance; it usually shows a negative correlation with FHB severity in barley, oat, and wheat [9,19,20,21]. In the last two decades, researches provided molecular evidence for this relationship, and many QTL responsible for both FHB and PH were identified, including Rht-B1, Rht-D1, and Rht8 [6]. Three possible mechanisms, i.e., disease escape, pleiotropy of reduced height (Rht) genes, and tight linkage, were proposed for the association [16]. DH is another trait that frequently shows association with field FHB resistance, and, depending on weather conditions, the correlation could be both positive and negative [22].
The aim of this study was to characterize the genetics of AE and FHB resistance, as well as their potential association with PH and DH, through phenotypic and genotypic analysis. Such an association was reported in several of our previous publications, in which QTL responsible for multiple of the abovementioned traits were mapped [9,23]. The current study presents results from two recombinant inbred line (RIL) populations, “NASMA” × “IAS20*5/H567.71” and “NASMA” × “RPB709.71/COC”, and two panels of CIMMYT breeding lines, to further investigate the interrelationships among AE, FHB, PH, and DH.
2. Materials and Methods
2.1. Plant Material
Two RIL populations were used in this study for QTL mapping. The first one was developed from a cross between “NASMA” × “IAS20*5/H567.71” with 197 progenies (referred to as the NIH population hereafter), while the second was from “NASMA” × “RPB709.71/COC” with 185 progenies (the NRC population). Both male parents are CIMMYT breeding lines with high AE and FHB resistance, while the female parent “NASMA” is a Moroccan line of low AE and susceptible to FHB. Both resistant parents carried Rht-B1b and Rht-D1a, whereas the susceptible parent had the Rht-B1a/Rht-D1b genotype, resulting in both dwarfing genes segregating in the two populations. It should be noted that QTL mapping for FHB, Fusarium damaged kernels (FDK), and DON in the NIH population was published [23]; however, AE and its association with FHB in this population was not reported. Furthermore, two germplasm panels, the 16th Fusarium head blight screening nursery (FHBSN) and a Panel of Parents (POP), both consisting of 36 lines mostly of CIMMYT origin, were included to verify the relationship between AE and FHB resistance (Table S1).
2.2. Field Trials and Phenotyping
The FHB field experiments were conducted at the CIMMYT El Batán experimental station (altitude of 2240 m above sea level, coordinate 19.5° north (N), 98.8° west (W), with an average annual precipitation of 625 mm), in Mexico during the summer season (May to September) when rainfall is concentrated [9]. The two RIL populations were evaluated from 2013 to 2014, sown in 1-m double rows with randomized complete block design with two replications. Each year, a mixture of five aggressive Fusarium graminearum isolates were collected, characterized, and used for field inoculation, following the protocols described by He et al. [24]. Spray inoculation was targeted to each line’s anthesis stage with an inoculum of 50,000 spores/mL and was repeated two days after the first spray. From anthesis to early dough stages, the nursery was misted from 9:00 a.m. to 8:00 p.m. with 10 min of spraying each hour, to create a humid environment favorable for FHB development. A wheat/maize rotation and conservation agricultural practices were followed in the nursery to enhance natural inoculum.
FHB symptoms were evaluated at 25 days post inoculation (dpi) on the 10 spikes that were tagged at anthesis. Numbers of infected spikes and symptomatic spikelets of each spike were counted for calculating FHB index with the formula FHB index = severity × incidence. Severity was measured as the averaged percentage of diseased spikelets, and incidence as the percentage of symptomatic spikes. In 2013 and 2014, AE, DH, and PH were scored for the two RIL populations. AE was rated with a linear scale from zero (no extrusion) to nine (full extrusion) according to Skinnes et al. [4] with minor modification. Briefly, AE evaluation was performed at approximately seven days after anthesis on a whole-plot basis. Additionally, five randomly selected spikes were manually checked to see if the proportion of AE corresponded to the plot-based score, to prevent possible mistakes when anthers of high AE materials were blown away by wind or washed away by rain. PH was measured before harvest from ground to the average spike tips excluding awns in each plot. DH was scored in all the experiments. Additionally, AE and FHB severity were also evaluated for FHBSN and POP populations using the above protocols in the same screening nursery in 2014.
2.3. Statistical Analyses
The phenotypic data were analyzed using SAS ver. 9.2 (SAS Institute, Cary, NC, USA). Analysis of variance (ANOVA) was carried out with the PROC GLM module, and Pearson correlation coefficients were calculated using the PROC CORR function. The results of ANOVA were used for calculating the heritability estimates, using the formula for single years and for multiple years, where stands for genetic variance, stands for genotype-by-year interaction, stands for error variance, y stands for the number of years, and r stands for the number of replications [5]. The phenotypic data averaged from two replications of each experiment were used for QTL analyses.
2.4. Genotyping
Genomic DNA of the two mapping populations and their parents were extracted from young leaves using the CTAB method, and were genotyped with the Illumina iSelect 15K Beadchip provided by TraitGenetics GmbH, Germany. Additionally, alleles for the plant height and vernalization genes Rht-B1, Rht-D1, and Vrn-A1 were also determined, using Kompetitive allele specific PCR (KASP) assays (LGC Genomics applications note, http://www.kbioscience.co.uk/reagents/KASP_Taqmancomparison.pdf) described in Dreisigacker et al. [25]. Additionally, some simple sequence repeat (SSR) markers were previously mapped in these two populations for studying Septoria tritici blotch resistance [26]. Markers with missing data points greater than 20% and segregation ratio beyond the range 0.5–2.0 were discarded from further analysis.
2.5. Linkage and QTL Mapping
Linkage groups (LGs) were constructed with the program JoinMap v.4.0 (Kyazma B.V., Wageningen, Netherlands), using LOD scores from 5–15 for grouping, and the maximum likelihood algorithm for calculating the order and position of markers within each LG. LGs were then assigned to chromosomes based on the Illumina 90K SNP map in Wang et al. [27]. QTL mapping was carried out with MapQTL v6.0 [28], in which interval mapping (IM) was firstly performed to detect potential QTL with LOD higher than 2.0 for each trait, followed by multiple QTL mapping (MQM) for each QTL, using the closest linked markers to each QTL detected in IM as cofactors. A significant QTL in MQM was defined in this study as one with an LOD score higher than 3.0; minor QTL with LOD values higher than 2.0 were also reported if they were significant in at least one environment. LGs and LOD curves were drawn by the software MapChart ver. 2.3 (Wageningen, Netherlands). Physical positions of markers in IWGSC RefSeq v1.0 were obtained from either T3/Wheat (https://triticeaetoolbox.org/wheat/viroblast/viroblast.php) or URGI (https://urgi.versailles.inra.fr/blast_iwgsc/blast.php) via BLASTN searches.
3. Results
3.1. Phenotypic Analysis
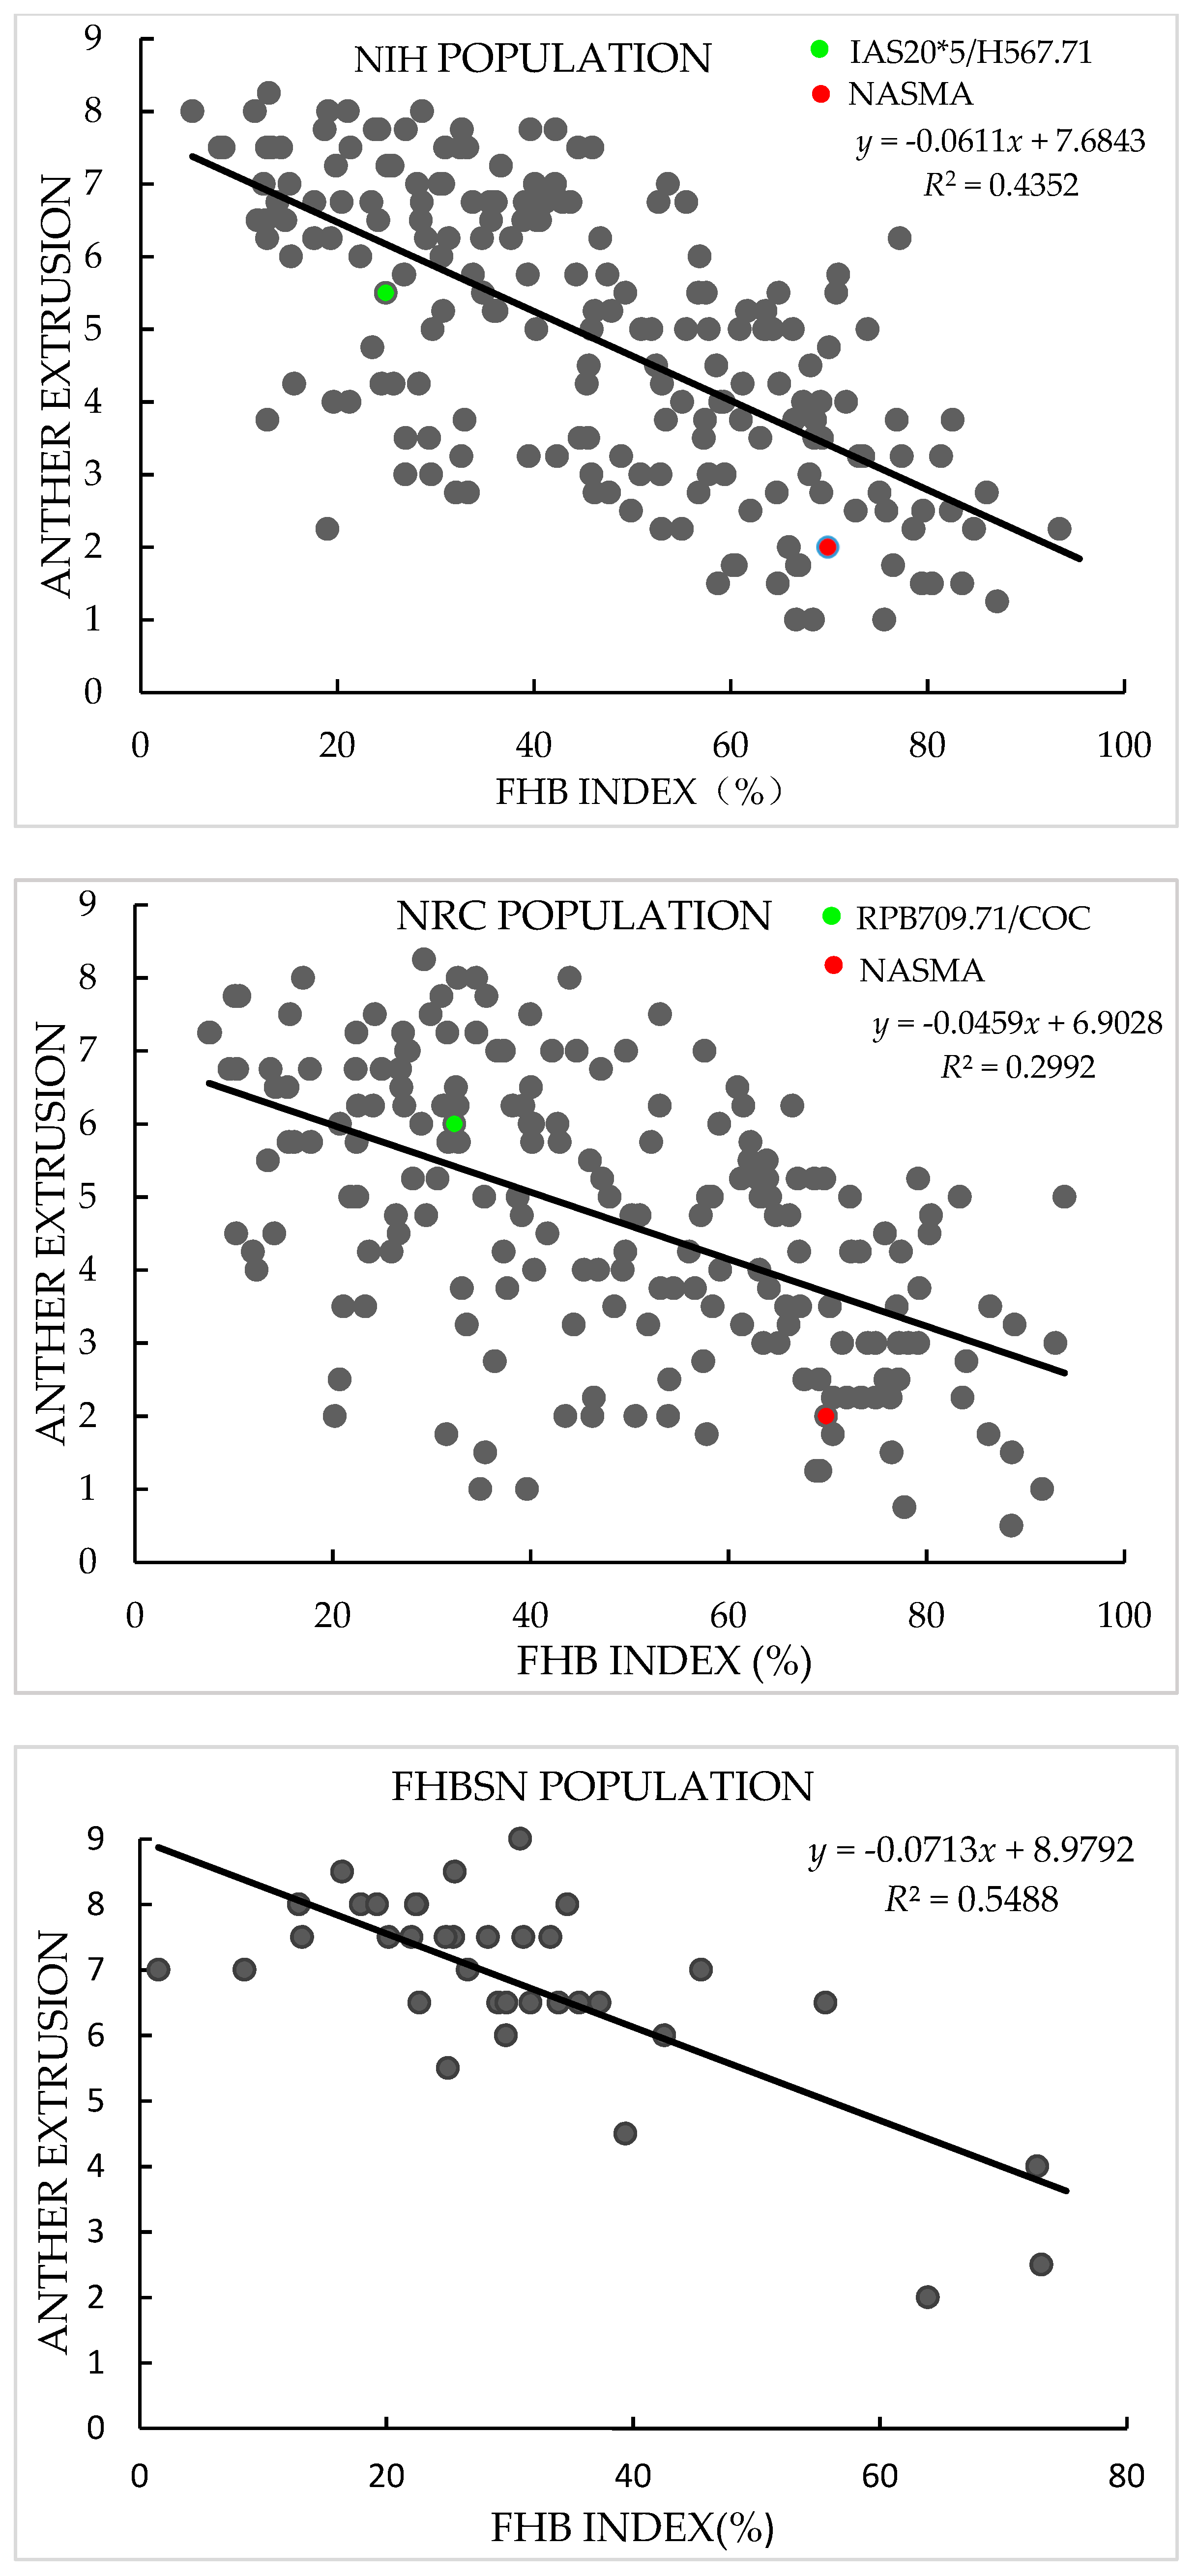
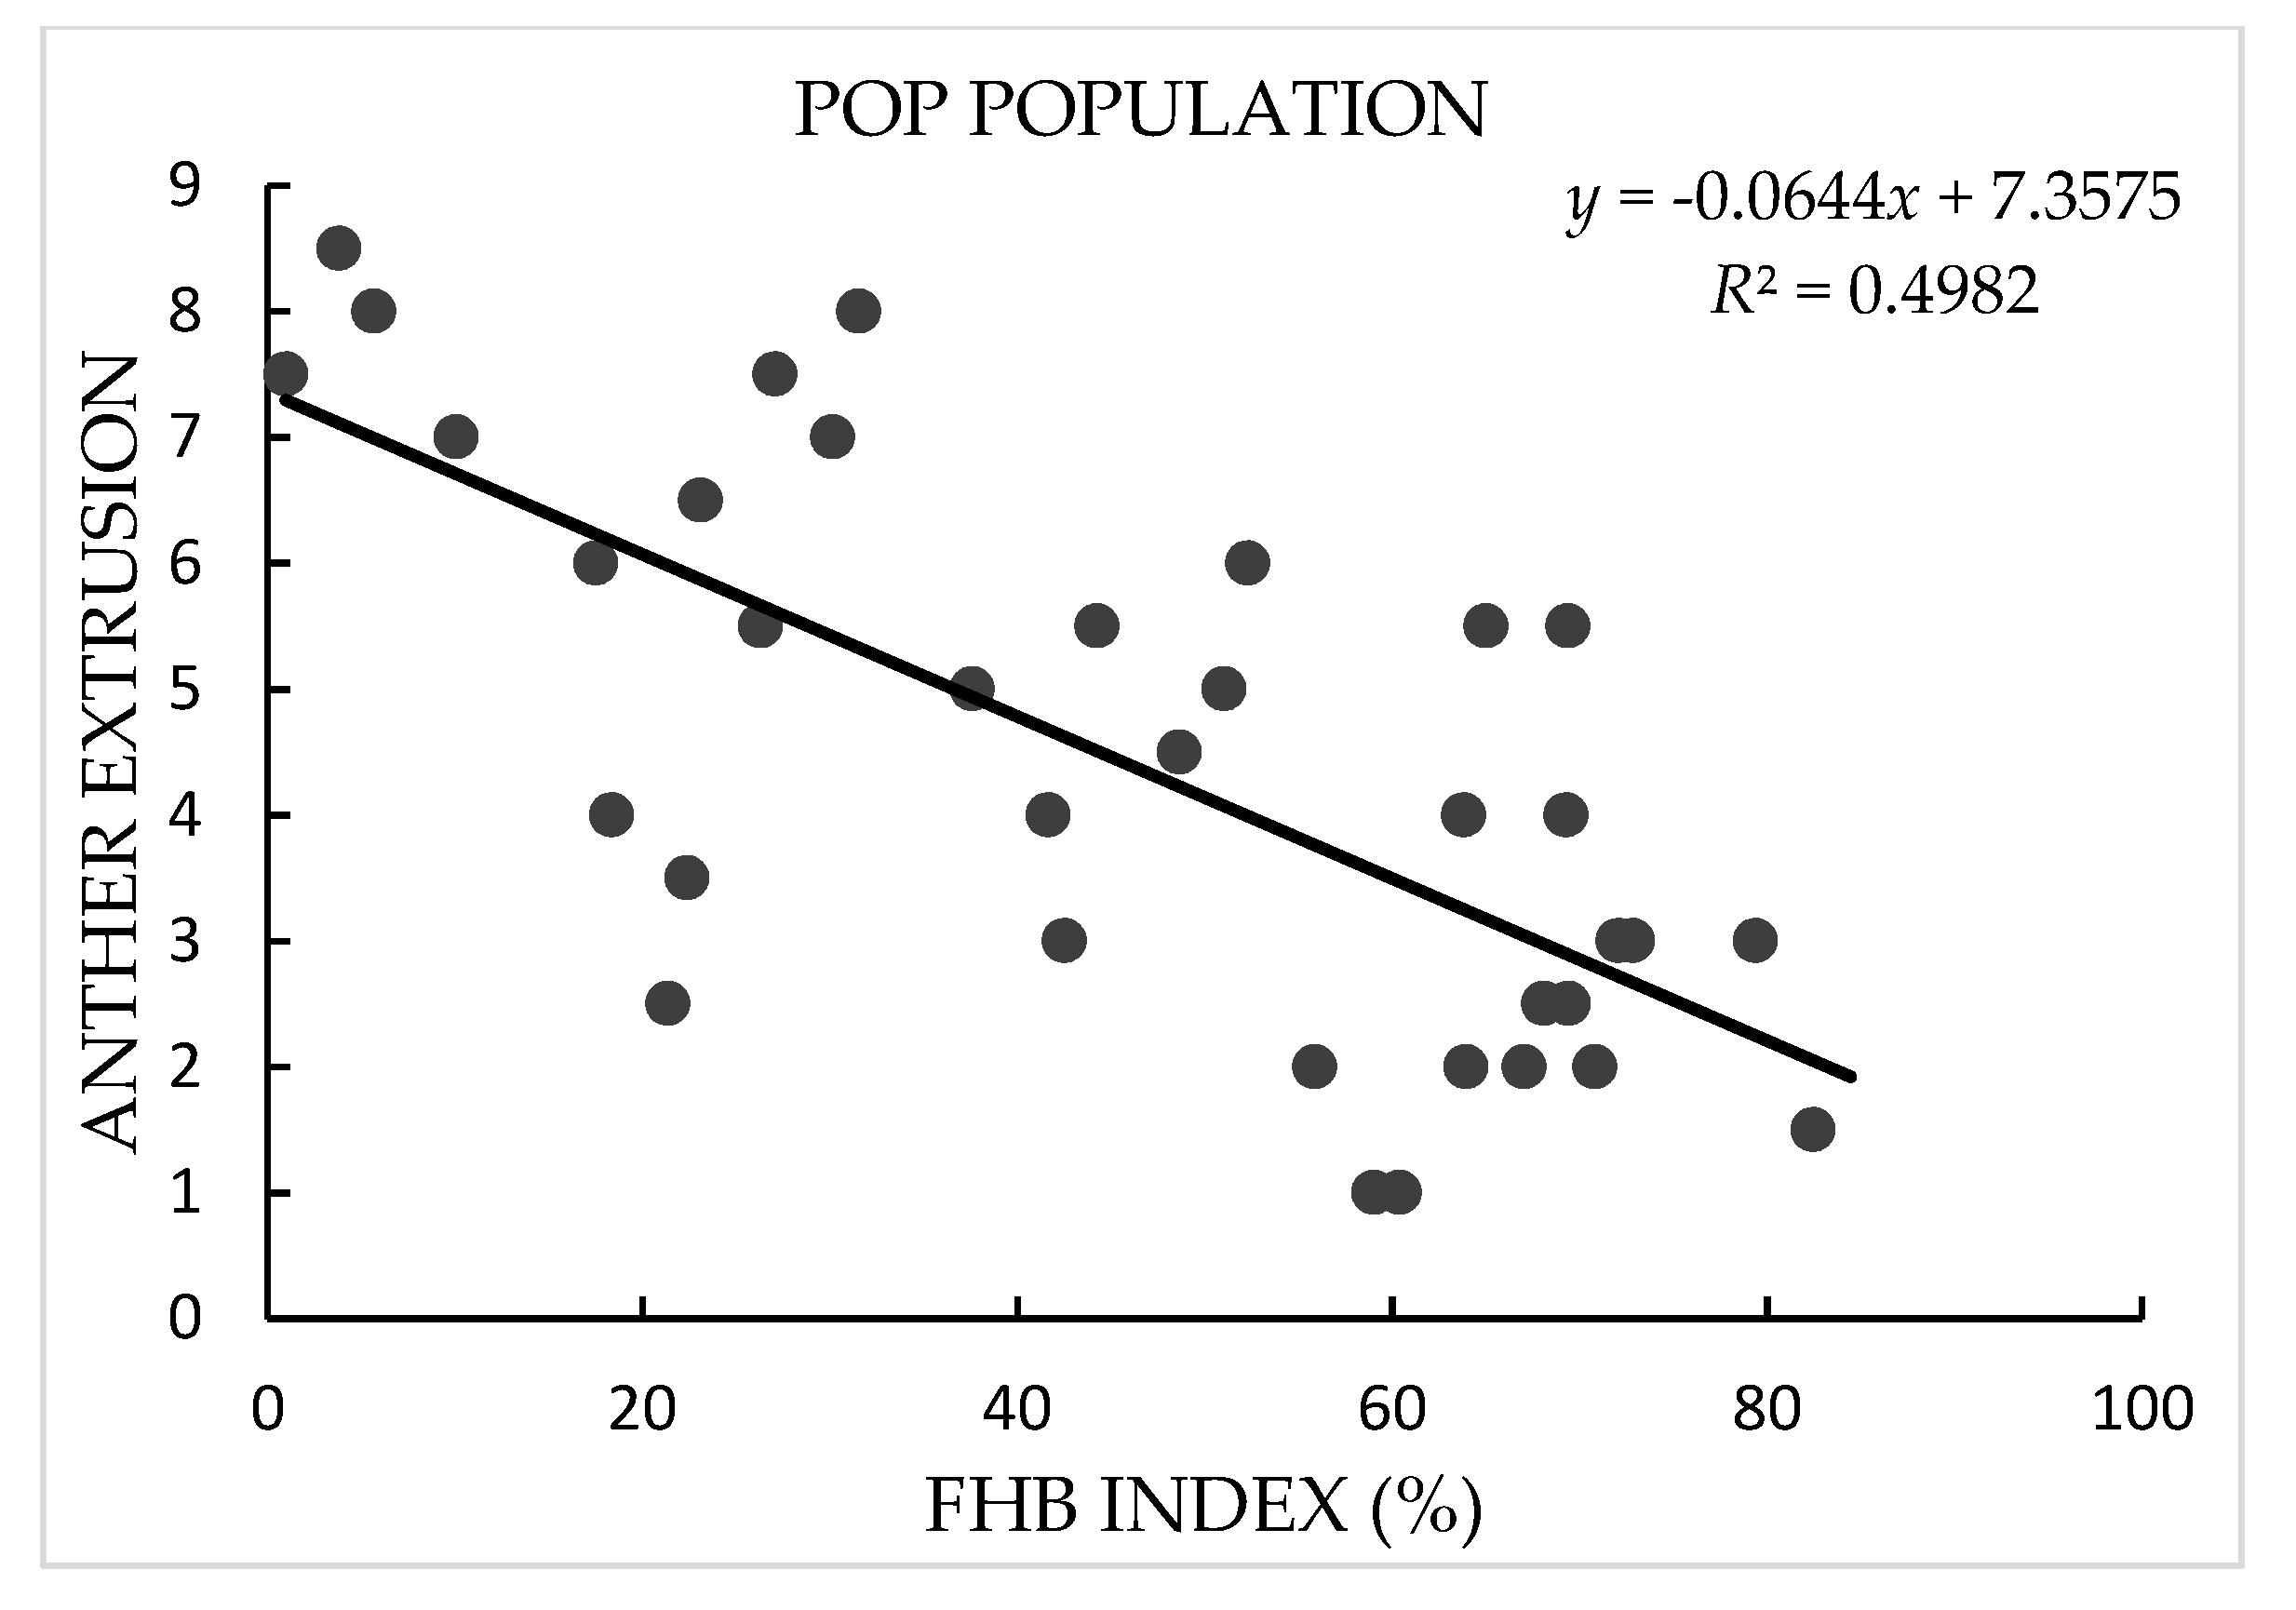
In both years, AE in the NIH and NRC populations showed continuous and broad variation with a range of mean value across replications and years from 1.0 to 8.3 in the NIH and 0.5 to 8.3 in the NRC population, in agreement with the quantitative inheritance of the trait. Transgressive segregation of AE was observed in both populations, and the AE scores of NASMA (with a mean value of 2.0) were always much lower than those of the two male parents (5.5 for IAS20*5/H567.71 and 6.0 for RPB709.71/COC). In FBHSN and POP populations, AE also showed large variation, with a range from 2.0 to 9.0 in the former and 1.0 to 8.5 in the latter. In all four populations, variation in “genotype” for AE were significant (p < 0.0001), as well as the “genotype × year” effects in the two RIL populations. The heritability estimates of AE in these populations were from 0.74 to 0.86 (Table 1 and Figure 1).
In terms of FHB index, the two male parents, IAS20*5/H567.71 (with a mean value of 24.9%) and RPB709.71/COC (32.3%), showed significantly lower infection than the female parent NASMA (69.9%). Continuous distribution patterns were found in both populations, indicating quantitative inheritance of FHB resistance. Transgressive segregation was observed for both high and low disease directions. As for FHBSN and POP, FHB index showed a range of mean values across replications from 1.5% to 73.1% in the former and 1.0% to 82.4% in the latter. The heritability estimates for the FHB index were from 0.74 to 0.93, and the “genotype” effects were significant in all four populations (p < 0.0001) (Table 2).
AE exhibited consistently significant negative correlation with FHB index in the four populations used in this study, with r-values ranging from −0.55 in the NRC population to −0.74 in the FHBSN population (Figure 1). PH and DH also showed continuous distribution patterns in the studied populations (Table S1), and they often exhibited significant correlations with FHB and AE. These two phenological traits showed constantly better correlations with FHB than with AE (Table S2).
3.2. Genotyping and Linkage Analysis
In the NRC population, 1182 SNPs together with Rht-B1, Rht-D1, Vrn-A1, and four SSRs were used for linkage map construction. Thirty-one LGs were generated, covering 4430 cM with an average density of 2.2 cM between markers. All the 21 wheat chromosomes were represented in this map, and nine LGs were not assigned to a chromosome due to a lack of anchored markers. Regarding the NIH population, 1316 markers were used for linkage mapping, and its map had a very similar marker density to the NRC population, as described in He et al. [23].
3.3. QTL Mapping for AE
Seven QTL for AE were detected on chromosomes 1BS, 3BL, 4BS, 4DS, 5BL, 6BS, and 7AS in the NIH population, with accumulated percentage of phenotypic variation explained from 32.2% to 39.7% in different years, while six QTL were mapped on 3BL, 4AL, 4DS, 5AL, 6AS, and 7BS in the NRC population, collectively explaining 23.6% to 43.0% of phenotypic variation. Five QTL on 3BL, 4DS, 5BL, 6AS, and 7Ac were stably identified in both years (Table 3). The QTL on 4DS showed the biggest effects in both populations, explaining 4.6% to 16.1% of the phenotypic variation in the NIH population, and 11.8% to 19.7% in the NRC population. The QTL on 3BL explained 4.5% to 8.8% of phenotypic variation in the NIH population, and 3.1% to 6.9% in the NRC population. Alleles for high AE at both QTL were contributed by the male parents IAS20*5/H567.71 and RPB709.71/COC. Additionally, minor QTL were detected on 1BS, 5BL, 6BS, and 7Ac in the NIH population, which explained 3.8% to 6.8% of phenotypic variation, and on 4AL, 5AL, 6AS, and 7BS in the NRC population, explaining 3.9% to 6.1% of phenotypic variation (Table 3).
3.4. QTL Mapping for FHB Resistance
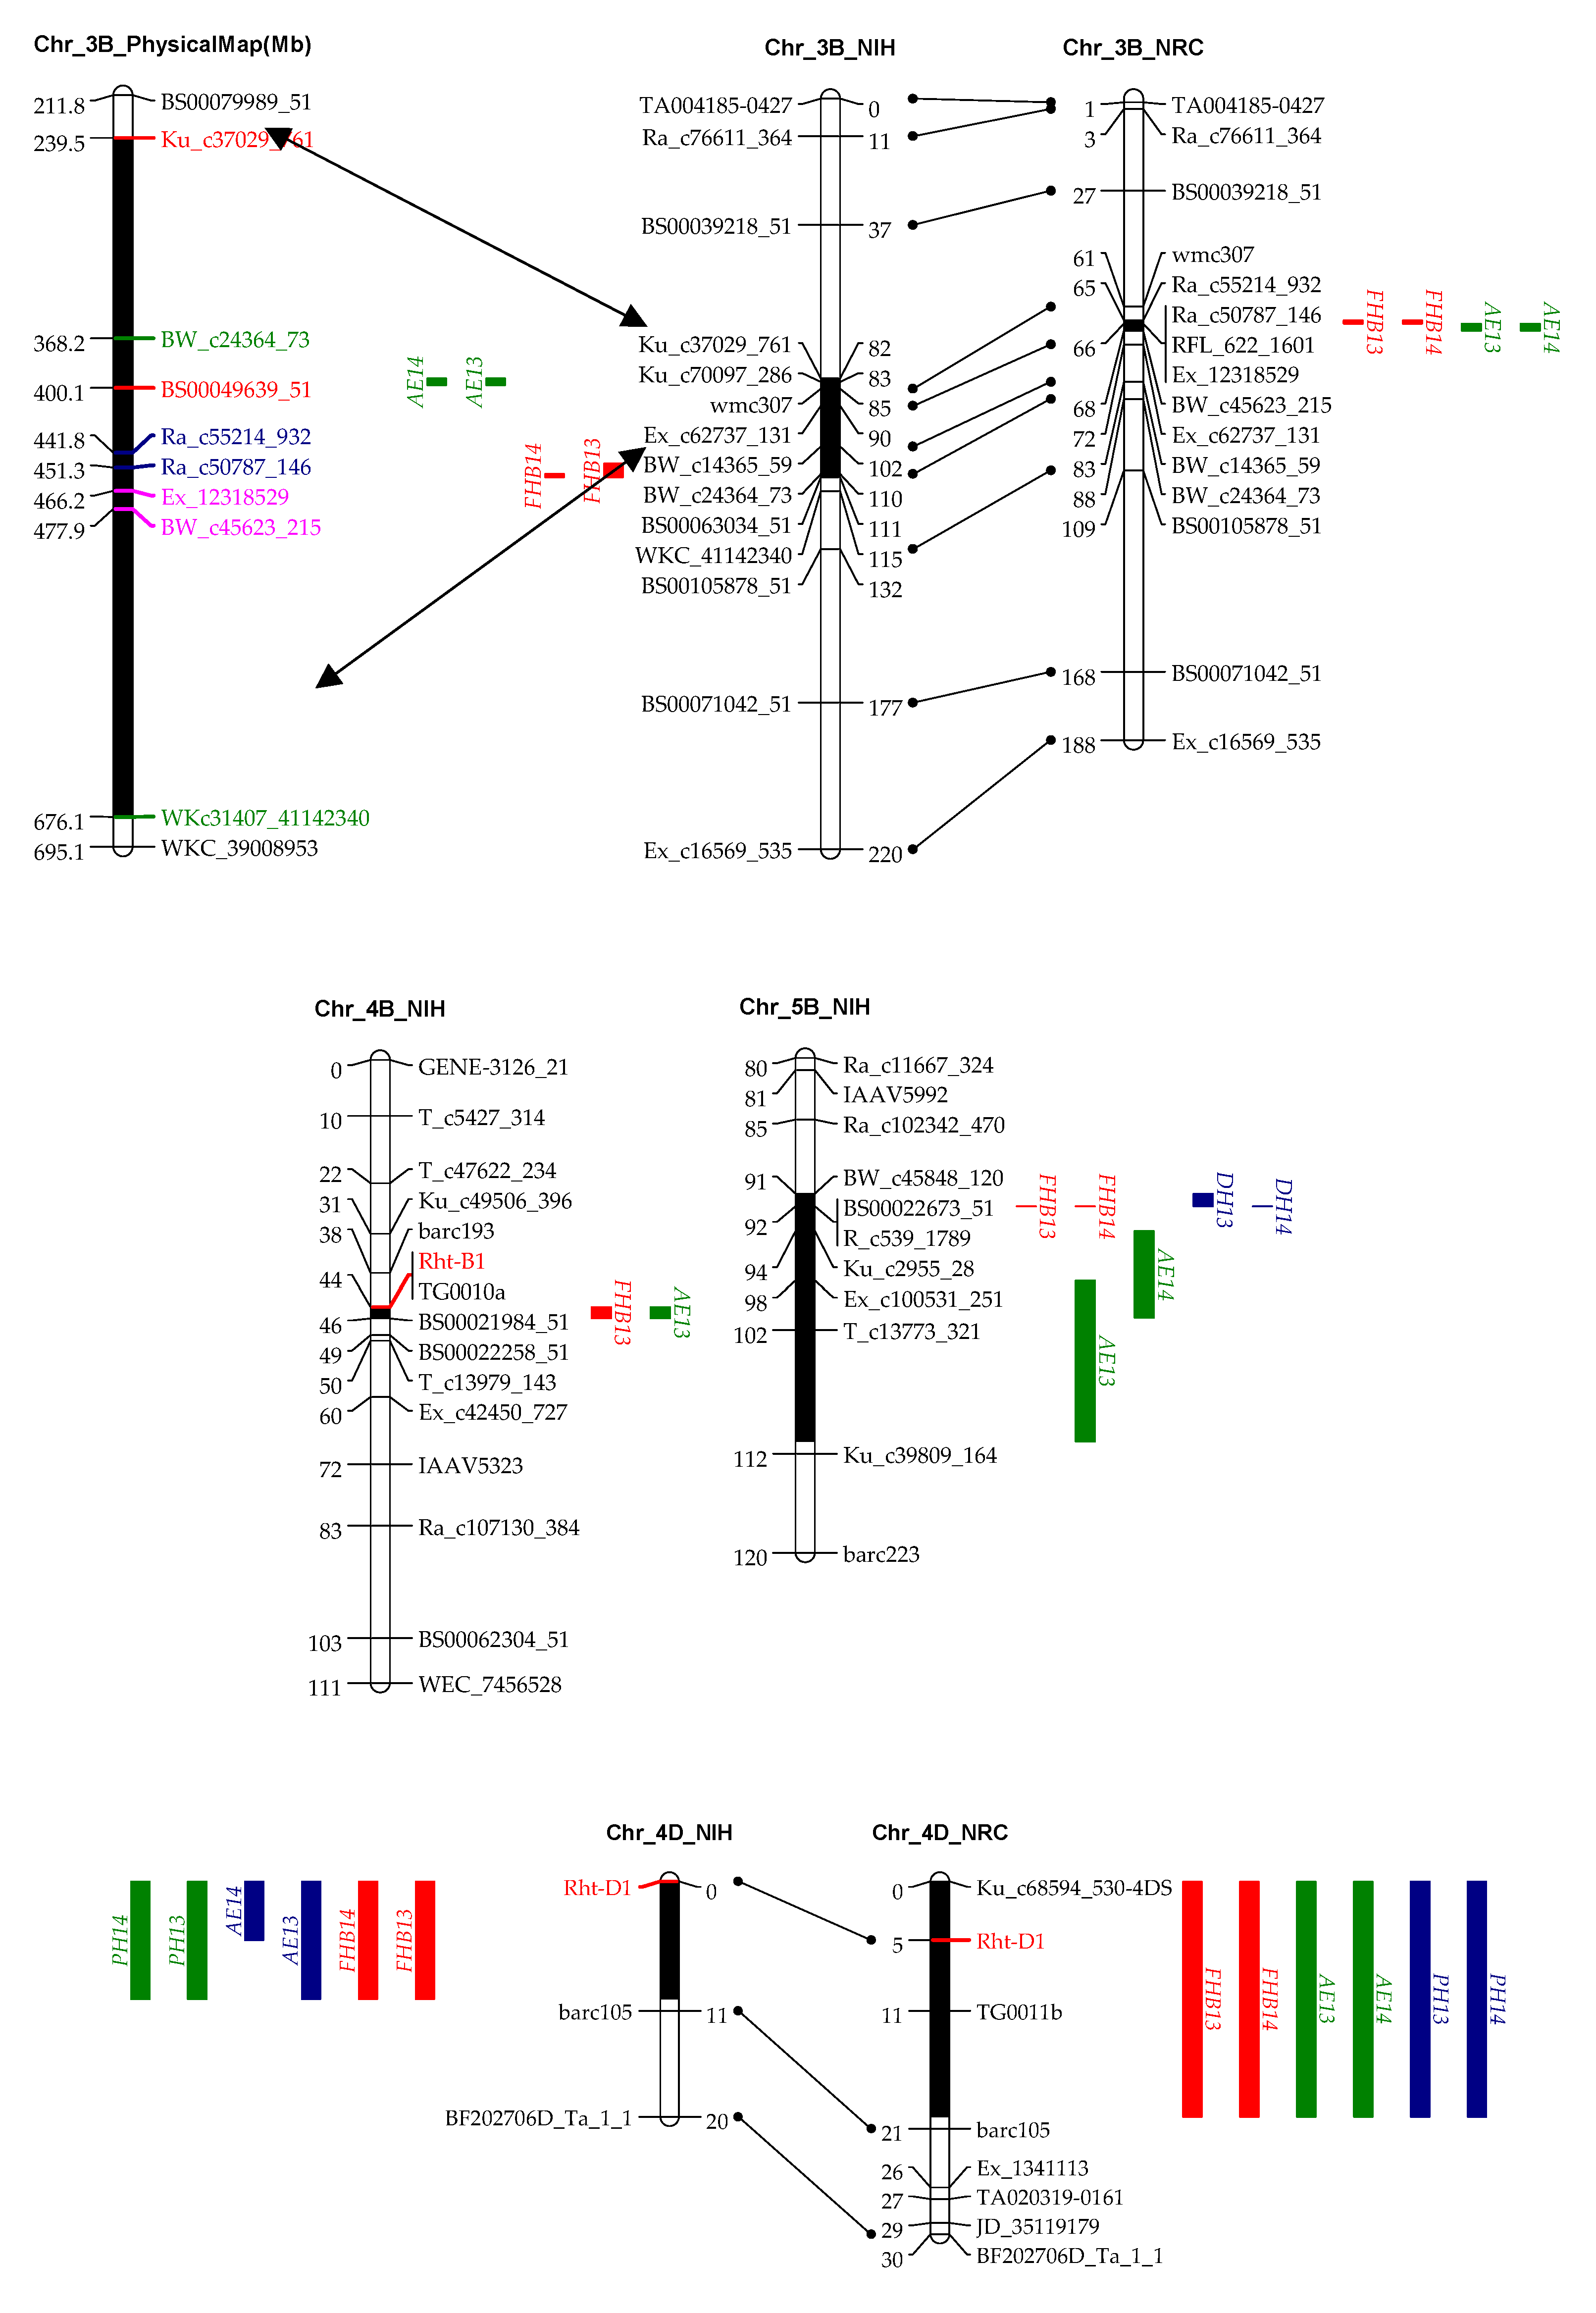
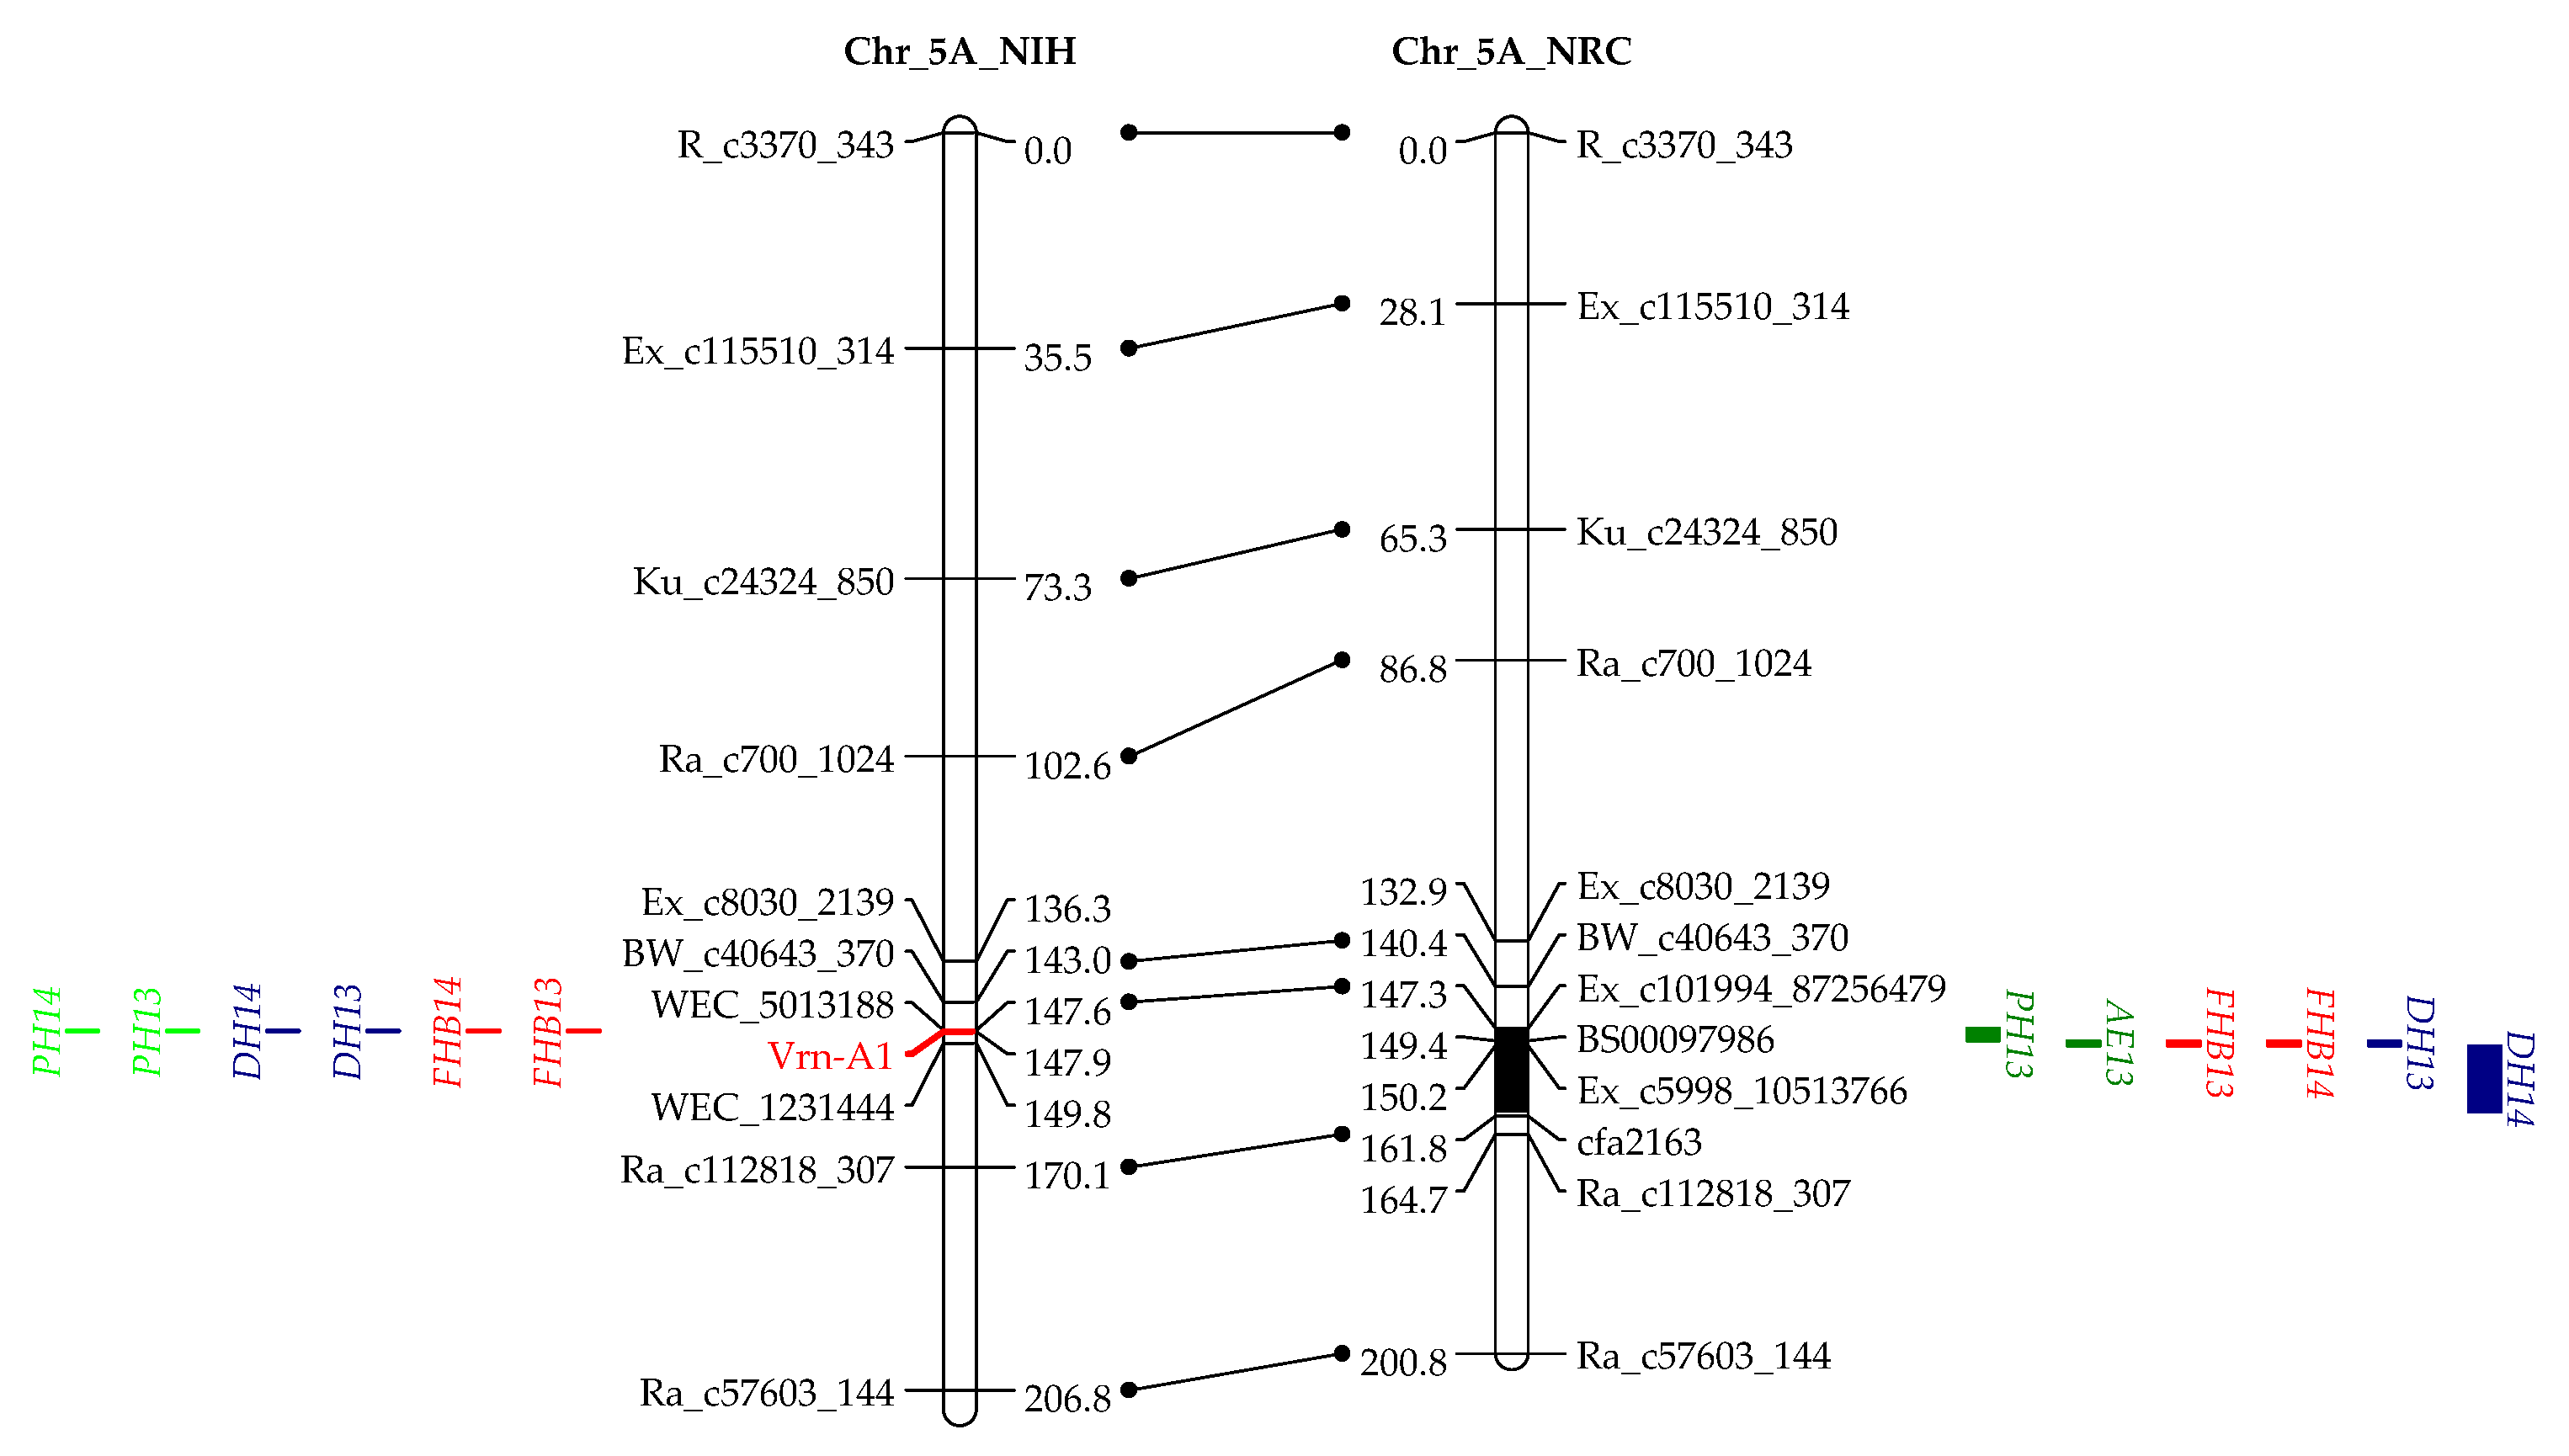
Nine QTL for FHB resistance were mapped on chromosomes 2AL, 2DS, 3BL, 4AL, 4BS, 4DS, 5AL, 5BL, and 7AS in the two mapping populations. Seven out of the nine QTL were stably identified in both years, and, among them, the QTL on 4DS and 5AL were shared by both populations and the one on 3BL was mapped to similar regions. These three QTL with their resistant alleles contributed by IAS20*5/H567.71 or RPB709.71/COC collectively explained 42.5% of phenotypic variation in NIH and 32.5% in NRC. The QTL on 5AL showed the biggest effects on FHB resistance in both populations, followed by 4DS and 3BL (Table 4, Figure 2).
In the NRC population, six QTL were detected for FHB resistance, i.e., 2DS, 3BL, 4AL, 4DS, 5AL, and 7AS. The QTL on 5AL that was associated with DH and AE and linked to Vrn-A1 explained 9.2% to 18.7% of phenotypic variation. The QTL on 4DS, which was associated with AE and PH and linked to Rht-D1, also had major effects on FHB resistance, explaining 10.2%–14.4% of phenotypic variation. QTL on 2DS, 3BL, 4AL, and 7AS were consistently identified in both years and, thus, can be regarded as stable QTL, explaining 3.0% to 9.7% of phenotypic variation (Table 4). In the NIH population, four stable QTL on 3BL, 4DS, 5AL, and 5BL were detected, explaining 4.4% to 21.7% of phenotypic variation as previously reported in He et al. [23].
In agreement with the significant phenotypic correlation, QTL for AE and FHB often coincided or were tightly linked to each other. In this regard, QTL on chromosomes 3BL, 4BS, 4DS, 5AL, and 5BL in the NIH population, and those on 3BL, 4DS, and 5AL in the NRC population were responsible for both AE and FHB (Table 3 and Table 4, Figure 2).
4. Discussion
4.1. AE as a Morphological Marker for FHB
A wide range of variation for AE among wheat genotypes was reported in recent studies. This trait was extensively studied as a factor promoting cross-pollination in hybrid breeding [7,8,15,29], and it showed a close relationship with FHB resistance in wheat [4,5,9,11,30]. It is generally acknowledged that cleistogamy and high AE have better Type I resistance against FHB [11]. This is in agreement with the results from the present study, where AE was consistently correlated with field FHB resistance.
The importance of AE in FHB resistance has long been recognized [10,31], but genetic studies on AE were performed only in the last decade [4,9,32]. In the aforementioned studies, numerous QTL for AE were identified, and many of them were reported to be responsible for both AE and FHB [4,5,9,33]. In this regard, the well-known ones are those on 4BS and 4DS, linking to Rht-B1 and Rht-D1 [9], respectively, as well as the closely linked ones on 5AS and 5Ac in the Fhb5 region [5,34]. Considering the close relationship of AE with Type I FHB resistance, the former was proposed as a morphological marker for FHB resistance by many researchers [4,10]. In fact, this strategy was practiced in the late 1970s by a Chinese breeder, who succeeded in selecting lines with good FHB resistance [35]. In recent years, breeders in Norway and Germany also started using this strategy, which proved to be promising [36,37].
4.2. Rht-B1 and Rht-D1 with Major Phenotypic Effects on Both AE and FHB
It is well known that dwarfing genes (Rht-B1b and Rht-D1b) reduce PH and AE and increase FHB index [9,38]. In the current study, Rht-D1 was associated with QTL for AE and FHB in both RIL populations, exhibiting major phenotypic effects, whereas Rht-B1 was associated with the two traits only in NIH with minor effects, and it was non-significant in NRC for neither AE nor FHB. This was different from our previous results, where Rht-B1b showed stronger effects on decreasing AE and FHB resistance than Rht-D1b in two mapping populations [9], implying a genetic background dependency of the genes; however, it is also possible that the minor effects of Rht-B1b were caused by environmental conditions that were not conducive for the expression of this gene. These two dwarfing genes encode forms of DELLA proteins that are insensitive to gibberellins (GAs) [39,40], which regulate plant height and several floral development processes, e.g., flower induction, pollen development, pollen tube growth, stamen development, filament extension, anther development and exertion [15,41,42]. Bioactive forms of GAs are most likely involved in establishing anther extrusion patterning in barley spikes [43]. Based on these facts, it is reasonable to speculate that Rht-B1 and Rht-D1 are the underlying genes for the AE QTL at the two loci, which influence FHB via two ways, i.e., (1) conditioning AE that in turn impacts FHB, and (2) controlling PH that is associated with FHB escape. Rht-B1b and Rht-D1b are widely used in breeding programs globally; however, considering their negative effects on FHB resistance and AE, Rht24 that has no negative effects on FHB could be a good candidate to replace the former two genes [44].
4.3. QTL Associated with AE, DH, and FHB
In addition to the two dwarfing genes that showed association with multiple traits, we also detected two QTL on 5AL and 5BL, which were associated with AE, DH, and FHB (Table 2 and Table 3, Figure 2). The QTL on 5AL encompasses Vrn-A1, spanning a region between 585.1 and 587.4 Mb in the Chinese spring (CS) reference genome. Recently, Muqaddasi et al. [8] reported a QTL on 5AL for AE, and its physical position was about 592.0 Mb, very close to ours and, thus, likely to be the same QTL. The QTL on 5BL responsible for AE, DH, and FHB spans a physical region between 583.6 and 613 Mb in the CS genome, closely linking to the Vrn-B1, with a distance of only 9.5 Mb. It could be possible that Vrn-A1 and Vrn-B1 are the underlying genes for these two QTL, and they affected FHB by regulating AE and DH.
Flowering of higher plants is a complex biological process and is regulated by both environmental and developmental factors. Many genes were reported to regulate flowering and are, thus, associated with DH, e.g., VRN and Ppd genes. The VRN1 genes, including three homoeologous genes Vrn-A1, Vrn-B1, and Vrn-D1 that encode MADS-box proteins, are the major loci for vernalization requirement and are related to plant height and spikelet development in wheat [45]. VRN1 is one of the central genes with strong epistatic interactions in the vernalization pathway to regulate heading time in wheat. Together with GAs, VRN1 upregulate the expression of the SOC1 gene that integrates GA signals, which is required for normal spike development and plant height [46,47]. Considering the biological functions of VRN1 genes, it is reasonable that QTL at or closely linked to VRN1 genes, like Vrn-A1 and Vrn-B1 in the current study, are associated with AE. Specific to the present study, the mechanism could be that Vrn-A1a and Vrn-B1a induce GA biosynthesis that promotes early heading and pronounced AE. However, in this study, early heading was associated with high FHB, whereas high AE was associated with low FHB; thus, the overall effects of Vrn-A1a and Vrn-B1a on FHB were more complicated than those of Rht-B1a and Rht-D1a, because the latter two led to tall stature and high AE that both were associated with FHB resistance. In this study, the overall effects of Vrn-A1a and Vrn-B1a were the increased FHB infection, implying that they had more impact on DH than on AE.
4.4. QTL on 3BL Was Also Important for AE and FHB Resistance
The QTL on 3BL for AE were always linked to those for FHB in the two mapping populations (Table 3 and Table 4, Figure 2). In the NIH population, physical locations of 3B for AE (251.2–419.6 Mb) and those for FHB (386.1–709.0 Mb) overlapped, and, in the NRC population, the QTL for AE (488.9–501.1 Mb) were closely linked to those for FHB (463.3–473.2 Mb) (Figure 2). Distances among the QTL were short; thus, they may have the same underlying gene, or they have closely linked but different underlying genes. In our previous study, a major QTL for DON and FDK was located in the same region as that for FHB in the NIH population [22], making this chromosome region very important for FHB-related traits, warranting further investigation.
5. Conclusions
We demonstrated the close interrelationships among FHB, AE, PH and DH in the CIMMYT germplasm used in the current study and pointed out that Rht-B1, Rht-D1, Vrn-A1 and Vrn-B1 genes may have pleiotropic effects on those traits. Understanding of the complicated interrelationships is helpful in breeding for FHB resistance in wheat.
Supplementary Materials
The following are available online at https://www.mdpi.com/2073-4395/10/1/47/s1, Table S1: Phenotypic data of the four populations investigated in the current study, along with their pedigree information and basic statistics. Table S2. Phenotypic correlations among Fusarium head blight (FHB), Anther extrusion (AE), Plant height (PH) and Days to heading (DH) in ‘NASMA’ × ‘IAS20*5/H567.71’ (NIH), ‘NASMA’ × ‘RPB709.71/COC’ (NRC), 16th FHBSN (FHBSN), and ‘Panel of Parents’ (POP) populations. Table S3. QTL for Days to heading (DH) and Plant height (PH) in ‘NASMA’ × ‘IAS20*5/H567.71’ (NIH) and ‘NASMA’ × ‘RPB709.71/COC’ (NRC) populations.
Author Contributions
P.K.S. and X.H. conceptualized and designed the experiments; X.H. and P.K.S. performed field trials; S.D. conducted all genotyping activities; K.X. and X.H. analyzed the data, K.X. wrote the first draft of the manuscript, and K.X., X.H., S.D., Z.H., and P.K.S. contributed to and approved the final draft of the manuscript. All authors have read and agreed to the published version of the manuscript.
Funding
Financial support from the CGIAR Research Program on WHEAT is gratefully acknowledged. Genotyping with the 15 K Illumina Beadchip was supported by the CRP WHEAT partnership project A4031.09.46 between TraitGenetics GmbH and CIMMYT/ICARDA with the title “Develop SNP-based genotyping service for existing marker trait combinations and whole-genome evaluations”.
Acknowledgments
The first author is grateful for the financial support from the China Scholarship Council. Technical support from Francisco Lopez in field trials, Nerida Lozano in inoculum preparation, and Claudia Nuñez for her genotyping work (SSR and KASP markers) is highly acknowledged.
Conflicts of Interest
The authors declare no conflict of interest.
References
- Okada, T.; Jayasinghe, J.E.A.R.M.; Eckermann, P.; Watson-Haigh, N.S.; Warner, P.; Hendrikse, Y.; Baes, M.; Tucker, E.J.; Laga, H.; Kato, K.; et al. Effects of Rht-B1 and Ppd-D1 loci on pollinator traits in wheat. Theor. Appl. Genet. 2019, 132, 1965–1979. [Google Scholar] [CrossRef]
- McMullen, M.; Bergstrom, G.; De Wolf, E.; Dill-Macky, R.; Hershman, D.; Shaner, G.; Van Sanford, D. A unified effort to fight an enemy of wheat and barley: Fusarium Head Blight. Plant Dis. 2012, 96, 1712–1728. [Google Scholar] [CrossRef] [PubMed] [Green Version]
- Mesterhazy, A. Types and components of resistance to Fusarium head blight of wheat. Plant Breed. 1995, 114, 377–386. [Google Scholar] [CrossRef]
- Skinnes, H.; Semagn, K.; Tarkegne, Y.; Marøy, A.G.; Bjørnstad, Å. The inheritance of anther extrusion in hexaploid wheat and its relationship to Fusarium head blight resistance and deoxynivalenol content. Plant Breed. 2010, 129, 149–155. [Google Scholar] [CrossRef]
- Lu, Q.; Lillemo, M.; Skinnes, H.; He, X.; Shi, J.; Ji, F.; Dong, Y.; Bjornstad, A. Anther extrusion and plant height are associated with Type I resistance to Fusarium head blight in bread wheat line ‘Shanghai-3/Catbird’. Theor. Appl. Genet. 2013, 126, 317–334. [Google Scholar] [CrossRef] [PubMed]
- Mao, S.; Wei, Y.; Cao, W.; Lan, X.; Yu, M.; Chen, Z.; Chen, G.; Zheng, Y. Confirmation of the relationship between plant height and Fusarium head blight resistance in wheat (Triticum aestivum L.) by QTL meta-analysis. Euphytica 2010, 174, 343–356. [Google Scholar] [CrossRef]
- Muqaddasi, Q.H.; Brassac, J.; Börner, A.; Pillen, K.; Röder, M.S. Genetic Architecture of Anther Extrusion in Spring and Winter Wheat. Front. Plant Sci. 2017, 8, 754. [Google Scholar] [CrossRef] [PubMed] [Green Version]
- Muqaddasi, Q.H.; Jayakodi, M.; Börner, A.; Röder, M.S. Identification of consistent QTL with large effect on anther extrusion in doubled haploid populations developed from spring wheat accessions in German Federal ex situ Genebank. Theor. Appl. Genet. 2019, 132, 3035–3045. [Google Scholar] [CrossRef]
- He, X.; Singh, P.K.; Dreisigacker, S.; Singh, S.; Lillemo, M.; Duveiller, E. Dwarfing genes Rht-B1b and Rht-D1b are associated with both type I FHB susceptibility and low anther extrusion in two bread wheat populations. PLoS ONE 2016, 11, e0162499. [Google Scholar] [CrossRef] [Green Version]
- Strange, R.; Deramo, A.; Smith, H. Virulence enhancement of Fusarium graminearum by choline and betaine and of Botrytis cinerea by other constituents of wheat germ. Trans. Br. Mycol. Soc. 1978, 70, 201–207. [Google Scholar] [CrossRef]
- Kubo, K.; Fujita, M.; Kawada, N.; Nakajima, T.; Nakamura, K.; Maejima, H.; Ushiyama, T.; Hatta, K.; Matsunaka, H. Minor differences in anther extrusion affect resistance to Fusarium head blight in wheat. J. Phytopathol. 2013, 161, 308–314. [Google Scholar] [CrossRef]
- Strange, R.N.; Smith, H. A fungal growth stimulant in anthers which predisposes wheat to attack by Fusarium graminearum. Physiol. Plant Pathol. 1971, 1, 141–150. [Google Scholar] [CrossRef]
- Strange, R.N.; Smith, H.; Majer, J.R. Choline, one of two fungal growth stimulants in anthers responsible for the susceptibility of wheat to fusarium graminearum. Nature 1972, 238, 103–104. [Google Scholar] [CrossRef]
- Pearce, R.B.; Strange, R.N.; Smith, H. Glycinebetaine and choline in wheat: Distribution and relation to infection by Fusarium graminearum. Phytochemistry 1976, 15, 953–954. [Google Scholar] [CrossRef]
- Muqaddasi, Q.H.; Pillen, K.; Plieske, J.; Ganal, M.W.; Röder, M.S. Genetic and physical mapping of anther extrusion in elite European winter wheat. PLoS ONE 2017, 12, e0187744. [Google Scholar] [CrossRef] [Green Version]
- Buerstmayr, H.; Ban, T.; Anderson, J.A. QTL mapping and marker-assisted selection for Fusarium head blight resistance in wheat: A review. Plant Breed. 2009, 128, 1–26. [Google Scholar] [CrossRef]
- Muqaddasi, Q.H.; Reif, J.C.; Roder, M.S.; Basnet, B.R.; Dreisigacker, S. Genetic Mapping Reveals Large-Effect QTL for Anther Extrusion in CIMMYT Spring Wheat. Agronomy 2019, 9, 407. [Google Scholar] [CrossRef] [Green Version]
- De Vries, A.P. Flowering biology of wheat, particularly in view of hybrid seed production—A review. Euphytica 1971, 20, 152–170. [Google Scholar] [CrossRef]
- Couture, L. Receptivite de cultivars de cereales de printemps a la contamination des graines sur inflorescence par les Fusarium spp. Can. J. Plant Sci. 1982, 62, 29–34. [Google Scholar] [CrossRef]
- Zhu, H.; Gilchrist, L.; Hayes, P.; Kleinhofs, A.; Kudrna, D.; Liu, Z.; Prom, L.; Steffenson, B.; Toojinda, T.; Vivar, H. Does function follow form? Principal QTLs for Fusarium head blight (FHB) resistance are coincident with QTLs for inflorescence traits and plant height in a doubled-haploid population of barley. Theor. Appl. Genet. 1999, 99, 1221–1232. [Google Scholar] [CrossRef]
- He, X.; Skinnes, H.; Oliver, R.E.; Jackson, E.W.; Bjørnstad, Å. Linkage mapping and identification of QTL affecting deoxynivalenol (DON) content (Fusarium resistance) in oats (Avena sativa L.). Theor. Appl. Genet. 2013, 126, 2655–2670. [Google Scholar] [CrossRef]
- Emrich, K.; Wilde, F.; Miedaner, T.; Piepho, H.P. REML approach for adjusting the Fusarium head blight rating to a phenological date in inoculated selection experiments of wheat. Theor. Appl. Genet. 2008, 117, 65–73. [Google Scholar] [CrossRef]
- He, X.; Dreisigacker, S.; Singh, R.P.; Singh, P.K. Genetics for low correlation between Fusarium head blight disease and deoxynivalenol (DON) content in a bread wheat mapping population. Theor. Appl. Genet. 2019, 132, 2401–2411. [Google Scholar] [CrossRef] [Green Version]
- He, X.; Singh, P.K.; Duveiller, E.; Schlang, N.; Dreisigacker, S.; Singh, R.P. Identification and characterization of international Fusarium head blight screening nurseries of wheat at CIMMYT, Mexico. Eur. J. Plant Pathol. 2013, 136, 123–134. [Google Scholar] [CrossRef]
- Dreisigacker, S.; Sehgal, D.; Reyes-Jaimez, A.; Luna-Garrido, B.; Muñoz-Zavala, S.; Núñez-Ríos, C.; Mollins, J.; Mall, S. CIMMYT Wheat Molecular Genetics: Laboratory Protocols and Applications to Wheat Breeding; CIMMYT: Texcoco, Mexico, 2016. [Google Scholar]
- Dreisigacker, S.; Wang, X.; Cisneros, B.A.M.; Jing, R.L.; Singh, P.K. Adult-plant resistance to Septoria tritici blotch in hexaploid spring wheat. Theor. Appl. Genet. 2015, 128, 2317–2329. [Google Scholar] [CrossRef]
- Wang, S.; Wong, D.; Forrest, K.; Allen, A.; Chao, S.; Huang, B.E.; Maccaferri, M.; Salvi, S.; Milner, S.G.; Cattivelli, L. Characterization of polyploid wheat genomic diversity using a high-density 90 000 single nucleotide polymorphism array. Plant Biotechnol. J. 2014, 12, 787–796. [Google Scholar] [CrossRef] [Green Version]
- Ooijen, J.W.V. MapQTL® 6, Software for the Mapping of Quantitative Trait Loci in Experimental Populations of Diploid Species; Kyazma BV: Wageningen, The Netherlands, 2009. [Google Scholar]
- Muqaddasi, Q.H.; Reif, J.C.; Li, Z.; Basnet, B.R.; Dreisigacker, S.; Röder, M.S. Genome-wide association mapping and genome-wide prediction of anther extrusion in CIMMYT spring wheat. Euphytica 2017, 213, 73. [Google Scholar] [CrossRef]
- Graham, S.; Browne, R.A. Anther extrusion and Fusarium head blight resistance in European wheat. J. Phytopathol. 2009, 157, 580–582. [Google Scholar] [CrossRef]
- Pugh, G.W.; Johann, H.; Dickson, J. Factors affecting infection of wheat heads by Gibberella saubiuetii. J. Agric. Res. 1933, 46, 771–797. [Google Scholar]
- Buerstmayr, M.; Buerstmayr, H. Comparative mapping of quantitative trait loci for Fusarium head blight resistance and anther retention in the winter wheat population Capo x Arina. Theor. Appl. Genet. 2015, 128, 1519–1530. [Google Scholar] [CrossRef] [Green Version]
- He, X.; Lillemo, M.; Shi, J.; Wu, J.; Bjørnstad, Å.; Belova, T.; Dreisigacker, S.; Duveiller, E.; Singh, P. QTL characterization of Fusarium head blight resistance in CIMMYT bread wheat line Soru# 1. PLoS ONE 2016, 11, e0158052. [Google Scholar]
- Steiner, B.; Buerstmayr, M.; Wagner, C.; Danler, A.; Eshonkulov, B.; Ehn, M.; Buerstmayr, H. Fine-mapping of the Fusarium head blight resistance QTL Qfhs.ifa-5A identifies two resistance QTL associated with anther extrusion. Theor. Appl. Genet. 2019. [Google Scholar] [CrossRef] [Green Version]
- Zhang, Q. Preliminary study on identification method of wheat resistant to scab in breeding process. Seed 1982, 2, 19–22. [Google Scholar] [CrossRef]
- Reitan, L.; Skinnes, H. Breeding strategies for resistance to Fusarium in graminor cereal breeding. In Bioforsk FOKUS; Bioforsk: Aas, Norway, 2010; Volume 5, p. 33. [Google Scholar]
- Taylor, M. Incorporation of Fusarium head blight resistance into European winter wheat breeding programmes. In Proceedings of the 2nd International Symposium on Fusarium Head Blight: Incorporating the 8th European Fusarium Seminar, Orlando, FL, USA, 11–15 Decmber 2004; Canty, S.M., Boring, T., Wardwell, J., Ward, R.W., Eds.; Michigan State University: East Lansing, MI, USA, 2004; pp. 195–196. [Google Scholar]
- Gosman, N.; Steed, A.; Hollins, T.W.; Bayles, R.; Jennings, P.; Nicholson, P. Semi-dwarfing Rht-B1 and Rht-D1 loci of wheat differ significantly in their influence on resistance to Fusarium head blight. Theor. Appl. Genet. 2009, 118, 695–702. [Google Scholar] [CrossRef]
- Peng, J.; Richards, D.E.; Hartley, N.M.; Murphy, G.P.; Devos, K.M.; Flintham, J.E.; Beales, J.; Fish, L.J.; Worland, A.J.; Pelica, F. ‘Green revolution’genes encode mutant gibberellin response modulators. Nature 1999, 400, 256–261. [Google Scholar] [CrossRef]
- Pearce, S.; Saville, R.; Vaughan, S.P.; Chandler, P.M.; Wilhelm, E.P.; Sparks, C.A.; Al-Kaff, N.; Korolev, A.; Boulton, M.I.; Phillips, A.L. Molecular characterization of Rht-1 dwarfing genes in hexaploid wheat. Plant Physiol. 2011, 157, 1820–1831. [Google Scholar] [CrossRef] [Green Version]
- Mutasa-Göttgens, E.; Hedden, P.H. Gibberellin as a factor in floral regulatory networks. J. Exp. Bot. 2009, 60, 1979–1989. [Google Scholar] [CrossRef] [Green Version]
- Chhun, T.; Aya, K.; Asano, K.; Yamamoto, E.; Morinaka, Y.; Watanabe, M.; Kitano, H.; Ashikari, M.; Matsuoka, M.; Ueguchi-Tanaka, M. Gibberellin regulates pollen viability and pollen tube growth in rice. Plant Cell 2007, 19, 3876–3888. [Google Scholar] [CrossRef] [Green Version]
- Youssef, H.M.; Eggert, K.; Koppolu, R.; Alqudah, A.M.; Poursarebani, N.; Fazeli, A.; Sakuma, S.; Tagiri, A.; Rutten, T.; Govind, G. VRS2 regulates hormone-mediated inflorescence patterning in barley. Nat. Genet. 2017, 49, 157–161. [Google Scholar] [CrossRef]
- Herter, C.P.; Ebmeyer, E.; Kollers, S.; Korzun, V.; Leiser, W.L.; Wurschum, T.; Miedaner, T. Rht24 reduces height in the winter wheat population ‘Solitar x Bussard’ without adverse effects on Fusarium head blight infection. Theor. Appl. Genet. 2018, 131, 1263–1272. [Google Scholar] [CrossRef]
- Sutka, J.; Galiba, G.; Vagujfalvi, A.; Gill, B.S.; Snape, J.W. Physical mapping of the Vrn-A1 and Fr1 genes on chromosome 5A of wheat using deletion lines. Theor. Appl. Genet. 1999, 99, 199–202. [Google Scholar] [CrossRef]
- Yan, L.; Loukoianov, A.; Blechl, A.; Tranquilli, G.; Ramakrishna, W.; SanMiguel, P.; Bennetzen, J.L.; Echenique, V.; Dubcovsky, J. The wheat VRN2 gene is a flowering repressor down-regulated by vernalization. Science 2004, 303, 1640–1644. [Google Scholar] [CrossRef] [Green Version]
- Li, C.; Lin, H.; Chen, A.; Lau, M.; Jernstedt, J.; Dubcovsky, J.J.b. Wheat VRN1 and FUL2 play critical and redundant roles in spikelet meristem identity and spike determinacy. BioRxiv 2019, 146, dev175398. [Google Scholar]
Figure 1.
Scatter plots of Fusarium head blight (FHB) index against anther extrusion in “NASMA” × “IAS20*5/H567.71” (NIH), “NASMA” × “RPB709.71/COC” (NRC), 16th Fusarium head blight screening nursery (FHBSN), and “Panel of Parents” (POP) populations, using overall means. The red dot represents NASMA, and the green dot represents IAS20*5/H567.71 or RPB709.71/COC. The correlations are all significant at p < 0.0001.


Figure 2.
QTL for FHB resistance, anther extrusion (AE), plant height (PH), and days to heading (DH) on chromosomes 3B, 4B, 4D, 5A, and 5B in the “NASMA” × “IAS20*5/H567.71” (NIH) and “NASMA” × “RPB709.71/COC” (NRC) populations using the multiple QTL mapping (MQM) method. Genetic distances are shown in centimorgans to the inner or left side of the linkage groups, whereas QTL ranges are denoted to the outer or right side of the linkage groups. Only framework markers are presented except for the QTL regions.


Table 1.
Analysis of variance for anther extrusion (AE) and its heritability estimates in the “NASMA” × “IAS20*5/H567.71” (NIH), “NASMA” × “RPB709.71/COC” (NRC), 16th Fusarium head blight screening nursery (FHBSN), and Panel of Parents (POP) populations.
Table 1.
Analysis of variance for anther extrusion (AE) and its heritability estimates in the “NASMA” × “IAS20*5/H567.71” (NIH), “NASMA” × “RPB709.71/COC” (NRC), 16th Fusarium head blight screening nursery (FHBSN), and Panel of Parents (POP) populations.
| Population | Source | DF | Mean Square | F-Value | p-Value | Heritability |
|---|---|---|---|---|---|---|
| NIH | Genotype | 196 | 14.97 | 9.66 | <0.0001 | 0.83 |
| Year | 1 | 324.92 | 209.67 | <0.0001 | ||
| Genotype × year | 196 | 2.52 | 1.63 | <0.0001 | ||
| Rep (year) | 2 | 23.27 | 15.02 | <0.0001 | ||
| Error | 392 | 1.55 | ||||
| NRC | Genotype | 184 | 14.07 | 6.82 | <0.0001 | 0.74 |
| Year | 1 | 231.62 | 112.28 | <0.0001 | ||
| Genotype × year | 184 | 3.61 | 1.75 | <0.0001 | ||
| Rep (year) | 2 | 26.43 | 12.81 | <0.0001 | ||
| Error | 368 | 2.06 | ||||
| FHBSN | Genotype | 35 | 4.67 | 5.67 | <0.0001 | 0.82 |
| Rep | 1 | 1.68 | 2.04 | 0.1620 | ||
| Error | 35 | 0.82 | ||||
| POP | Genotype | 35 | 9.44 | 7.04 | <0.0001 | 0.86 |
| Rep | 1 | 0.06 | 0.04 | 0.8399 | ||
| Error | 35 | 1.34 |
Table 2.
Analysis of variance for Fusarium head blight (FHB) and its heritability estimates in “NASMA” × “IAS20*5/H567.71” (NIH), “NASMA” × “RPB709.71/COC” (NRC), 16th Fusarium head blight screening nursery (FHBSN), and “Panel of Parents” (POP) populations.
Table 2.
Analysis of variance for Fusarium head blight (FHB) and its heritability estimates in “NASMA” × “IAS20*5/H567.71” (NIH), “NASMA” × “RPB709.71/COC” (NRC), 16th Fusarium head blight screening nursery (FHBSN), and “Panel of Parents” (POP) populations.
| Population | Source | DF | Mean Square | F-Value | p-Value | Heritability |
|---|---|---|---|---|---|---|
| NIH | Genotype | 196 | 1734.59 | 18.2 | <0.0001 | 0.92 |
| Year | 1 | 297.47 | 3.12 | 0.0781 | ||
| Genotype × year | 195 | 136.17 | 1.43 | 0.0016 | ||
| Rep (year) | 2 | 1173.78 | 12.32 | <0.0001 | ||
| Error | 390 | 95.308 | ||||
| NRC | Genotype | 184 | 1927.59 | 19.33 | <0.0001 | 0.74 |
| Year | 1 | 6655.90 | 66.73 | <0.0001 | ||
| Genotype × year | 184 | 279.66 | 2.80 | <0.0001 | ||
| Rep (year) | 2 | 699.51 | 7.01 | 0.001 | ||
| Error | 362 | 99.74 | ||||
| FHBSN | Genotype | 35 | 504.16 | 10.79 | <0.0001 | 0.91 |
| Rep | 1 | 27.90 | 0.60 | 0.4448 | ||
| Error | 35 | 46.72 | ||||
| POP | Genotype | 35 | 1135.29 | 13.52 | <0.0001 | 0.93 |
| Rep | 1 | 1454.45 | 17.32 | 0.0002 | ||
| Error | 35 | 83.99 |
Table 3.
QTL for anther extrusion in “NASMA” × “IAS20*5/H567.71” (NIH) and “NASMA” × “RPB709.71/COC” (NRC) populations and their association with other traits.
Table 3.
QTL for anther extrusion in “NASMA” × “IAS20*5/H567.71” (NIH) and “NASMA” × “RPB709.71/COC” (NRC) populations and their association with other traits.
| Population | Chr. | Position | Left Marker | Right Marker | 2013 | 2014 | Source b | Traits Associated c | ||
|---|---|---|---|---|---|---|---|---|---|---|
| LOD | PVE (%) a | LOD | PVE (%) | |||||||
| NIH | 1BS | 46.9–54.1 | wmc406 | barc8 | 2.2 | 3 | I | |||
| 3BL | 82.1–84.1 | Ku_c37029_761 | BS00049639_51 | 3.3 | 4.5 | 5.5 | 8.8 | I | FHB | |
| 4BS | 44.1–46.3 | Rht-B1 | BS00021984_51 | 4.0 | 6.1 | N | FHB, PH | |||
| 4DS | 0–10.7 | Rht-D1 | barc105 | 10.6 | 16.1 | 3.0 | 4.6 | I | FHB, PH | |
| 5BL | 98.4–111.8 | Ex_c100531_251 | Ku_c39809_164 | 4.4 | 6.2 | 4.3 | 6.8 | N | FHB, DH | |
| 6BS | 65.5–66.0 | WEC_3267186 | Ku_c9507_142 | 3.4 | 5.2 | I | ||||
| 7Ac | 118.7–121.7 | BS00006674_51 | BW_c66165_77 | 2.8 | 3.8 | 4 | 6.8 | N | ||
| NRC | 3BL | 66.0–67.9 | RFL_622_1601 | BW_c45623_215 | 5.0 | 6.9 | 2.1 | 3.1 | R | FHB |
| 4AL | 78.4–79.4 | Ex_c8658_335 | Ex_9657856 | 3.4 | 4.7 | N | ||||
| 4DS | 0.0–21.3 | Ku_c68594_530 | barc105 | 12.6 | 19.7 | 6.0 | 11.8 | R | FHB, PH | |
| 5AL | 149.4–150.2 | BS00097986 | Ex_c5998_10513766 | 4.1 | 5.6 | R | FHB, PH, DH | |||
| 6AS | 18.7–19.3 | IACX2250 | BS00037006_51 | 4.4 | 6.1 | 2.6 | 4.8 | N | ||
| 7BS | 46.2–53.3 | Ku_c101472_574 | GENE-4333_211 | 2.1 | 3.9 | R | DH | |||
a Percentage variation explained. b The parent that contributes the allele for high anther extrusion. I, IAS20*5/H567.71; N, NASMA; R, RPB709.71/COC. c FHB, Fusarium head blight; PH, plant height; DH, days to heading. QTL mapping results for DH and PH are available in Table S3.
Table 4.
QTL for Fusarium head blight (FHB) in “NASMA” × “IAS20*5/H567.71” (NIH) and “NASMA” × “RPB709.71/COC” (NRC) populations and their association with other traits.
Table 4.
QTL for Fusarium head blight (FHB) in “NASMA” × “IAS20*5/H567.71” (NIH) and “NASMA” × “RPB709.71/COC” (NRC) populations and their association with other traits.
| Population | Chr. | Position (cM) | Left Marker | Right Marker | 2013 | 2014 | R Source b | Traits Associated c | ||
|---|---|---|---|---|---|---|---|---|---|---|
| LOD | PVE (%) a | LOD | PVE (%) | |||||||
| 3BL | 109.6–115.5 | BW_c24364_73 | wKc31407_41142340 | 4.0 | 4.8 | 3.0 | 4.4 | I | AE | |
| 4BS | 44.1–46.3 | Rht-B1 | BS00021984_51 | 4.2 | 5.5 | N | AE, PH | |||
| NIH | 4DS | 0–10.7 | Rht-D1 | barc105 | 10.1 | 12.7 | 6.0 | 9.2 | I | AE, PH |
| 5AL | 147.6–147.9 | WEC_5013188 | Vrn-A1 | 15.8 | 21.2 | 13.2 | 21.7 | I | AE, DH, PH | |
| 5BL | 92.1–92.4 | BS00022673_51 | R_c539_1789 | 4.1 | 4.8 | 2.3 | 3.4 | N | AE, DH | |
| 2AL | 91.3–96.9 | BW_c4743_63 | Ra_c38018_278 | 3.1 | 4.2 | N | ||||
| 2DS | 37.3–55.6 | BS00022276_51 | Ex_c39215_100 | 4.6 | 5.8 | 2.3 | 3.8 | N | DH, PH | |
| NRC | 3BL | 64.9–65.6 | Ra_c55214_932 | Ra_c50787_146 | 3.1 | 3.8 | 2.6 | 3.6 | R | AE |
| 4AL | 129.3–136.8 | IAAV1383 | Ra_32274079 | 3.2 | 3.9 | 2.2 | 3 | N | ||
| 4DS | 0.0–21.3 | Ku_c68594_530 | barc105 | 7.7 | 10.2 | 9.4 | 14.4 | R | AE, PH | |
| 5AL | 149.4–164.7 | BS00097986 | Ra_c112818_307 | 13.4 | 18.7 | 6.4 | 9.2 | R | AE, DH, PH | |
| 7AS | 54.9–61.6 | Ex_c109881_701 | BS00023225_51 | 6.1 | 9.7 | 2.9 | 4.7 | R | DH, PH | |
a Percentage variation explained. b Source of resistance. I, IAS20*5/H567.71; N, NASMA; R, RPB709.71/COC. c AE, anther extrusion; PH, plant height; DH, days to heading. QTL mapping results for DH and PH are available in Table S3.
© 2019 by the authors. Licensee MDPI, Basel, Switzerland. This article is an open access article distributed under the terms and conditions of the Creative Commons Attribution (CC BY) license (http://creativecommons.org/licenses/by/4.0/).
Share and Cite
MDPI and ACS Style
Xu, K.; He, X.; Dreisigacker, S.; He, Z.; Singh, P.K. Anther Extrusion and Its Association with Fusarium Head Blight in CIMMYT Wheat Germplasm. Agronomy 2020, 10, 47. https://doi.org/10.3390/agronomy10010047
AMA Style
Xu K, He X, Dreisigacker S, He Z, Singh PK. Anther Extrusion and Its Association with Fusarium Head Blight in CIMMYT Wheat Germplasm. Agronomy. 2020; 10(1):47. https://doi.org/10.3390/agronomy10010047
Chicago/Turabian StyleXu, Kaijie, Xinyao He, Susanne Dreisigacker, Zhonghu He, and Pawan K. Singh. 2020. "Anther Extrusion and Its Association with Fusarium Head Blight in CIMMYT Wheat Germplasm" Agronomy 10, no. 1: 47. https://doi.org/10.3390/agronomy10010047
Note that from the first issue of 2016, this journal uses article numbers instead of page numbers. See further details here.