MicroRNA-455-3p as a Potential Biomarker for Alzheimer's Disease: An Update
 Subodh Kumar1
  P. Hemachandra Reddy1,2,3,4,5,6,7*
- 1Garrison Institute on Aging, Texas Tech University Health Sciences Center, Lubbock, TX, United States
- 2Department of Cell Biology and Biochemistry, Texas Tech University Health Sciences Center, Lubbock, TX, United States
- 3Department of Pharmacology and Neuroscience, Texas Tech University Health Sciences Center, Lubbock, TX, United States
- 4Department of Neurology, Texas Tech University Health Sciences Center, Lubbock, TX, United States
- 5Speech, Language and Hearing Sciences, Texas Tech University Health Sciences Center, Lubbock, TX, United States
- 6Department of Public Health, Graduate School of Biomedical Studies, Texas Tech University Health Sciences Center, Lubbock, TX, United States
- 7Garrison Institute on Aging, Texas Tech University Health Sciences Center, Lubbock, TX, United States
A non-invasive and early-detectable peripheral biomarker is urgently needed for Alzheimer's disease (AD). The present study is a step forward to verify the biomarker properties of human microRNA-455-3p (Hsa-miR-455-3p) in AD patients. Our previous findings on mild cognitive impaired subjects, AD patients and AD cells and mouse models unveiled the miR-455-3p as a potential peripheral biomarker for AD. In the current study, we verified the differential expression of miR-455-3p in postmortem AD brains obtained from NIH NeuroBioBank, and fibroblasts and B-lymphocytes from both familial and sporadic AD patients from Coriell Cell Repository of National Institutes on Aging. Total RNA was extracted from the fibroblasts, B-lymphocytes and AD postmortem brains, and expression of miR-455-3p was measured by real-time reverse-transcriptase RT-PCR. Our real-time RT-PCR analysis showed a significant (P = 0.0002) upregulation of miR-455-3p expression in AD postmortem brains compared to healthy control samples. Expression of miR-455-3p was also upregulated in the fibroblasts from AD patients, however a significant difference in miR-455-3p level was observed in the cells from sporadic AD patients (P = 0.014) compared to healthy controls. Similarly, in B-lymphocytes, miR-455-3p level was also higher (P = 0.044) especially in sporadic AD cases compared to controls. Receiver operating characteristic (ROC) curve analysis indicated the significant area under ROC curve (AUROC) value of miR-455-3p in AD postmortem brain (AUROC = 0.792; P = 0.001) and AD fibroblasts cells (AUROC = 0.861; P = 0.03), whereas in B-lymphocytes AUROC value of miR-455-3p was not significant. Further, in-silico analysis for miRNA targets predictions showed the binding capacity of miR-455-3p with several AD associated key genes such as APP, NGF, USP25, PDRG1, SMAD4, UBQLN1, SMAD2, TP73, VAMP2, HSPBAP1, and NRXN1. Hence, these observations further revealed that miR-455-3p is a potential biomarker for AD and its possible therapeutic target for AD.
Introduction
Alzheimer's disease (AD) is a progressive, heterogeneous, age-dependent, neurodegenerative disorder, characterized by the loss of memory, impairment of multiple cognitive functions, and changes in the personality and behavior (Mattson, 2004; LaFerla et al., 2007; Reddy et al., 2010). Currently, 36 million people older than 65 years are living with AD-related dementia world-wide, with numbers in this age group expecting to double to 66 million by 2030 and increase to 115 million by 2050. According to 2015 estimates from the World Alzheimer Report, worldwide dementia is currently costing $818 billion annually (World Alzheimer Report, 2015).
Morphological and pathological studies of postmortem AD brains revealed that AD is mainly associated with intracellular neurofibrillary tangles (NFTs); extracellular amyloid-β (Aβ) plaques; synaptic damage, loss of synapses, and loss of synaptic proteins; proliferation of reactive astrocytes and activated microglia; defects in cholinergic neurons; an age-dependent imbalance in hormones, and structural and functional changes in mitochondria (Terry et al., 1991; McGeer and McGeer, 1995; DeKosky et al., 1996; Nunomura et al., 2001; Reddy, 2006; Reddy and Beal, 2008; Du et al., 2010; Tampellini and Gouras, 2010; Swerdlow, 2011; Reddy et al., 2012; Zhu et al., 2013). Among these changes, synaptic damage and the loss of synapses and mitochondrial oxidative damage are widely recognized as early events in the pathogenesis and progression of AD (Du et al., 2010; Tampellini and Gouras, 2010). Also, the loss of synapses and synaptic damage are the best correlates of cognitive decline found in AD patients (Terry et al., 1991; Bertoni-Freddari et al., 1996; DeKosky et al., 1996).
AD occurs in two forms, early-onset “familial” AD involves genetic mutations and late-onset “sporadic” AD. Genetic mutations in amyloid precursor protein (APP), presenilin 1 (PS1), and presenilin 2 cause a small proportion of familial AD. Several factors, including lifestyle, diet, environmental exposure, apolipoprotein allele E4, and several other genetic variants reported to involve in late-onset AD (Reddy et al., 2012). Aging is a major risk factor for developing AD. With increasing lifespan, AD is becoming a major factor in the society. Currently, we do not have drugs and agents that can delay and/or prevent disease progression in elderly individuals and patients with AD. Further, we do not have peripheral biomarkers that can detect disease process early on life. However, recent advancements in molecular biology revealed that blood-based microRNAs can be used as early detectable peripheral biomarkers for aging, AD and other neurological diseases (Kumar and Reddy, 2016; Reddy et al., 2017).
MicroRNAs (miRNAs) are non-coding RNAs (20–24 nt), involved in post-transcriptional processing of genes by affecting the stability and translation of mRNAs. These are transcribed by RNA pol II in the form of capped and polyA primary transcripts (pri-miRNAs) and can be either protein-coding or non-coding. Mature miRNA sequences are incorporated into a RNA-induced silencing complex, which recognizes target mRNAs resulting in the translational inhibition or target mRNA destabilization (Kumar and Reddy, 2016). There are several miRNAs that have been implicated in most of the neurodegenerative diseases (Reddy, 2006; Williams et al., 2016).
MicroRNA-455 (MiR-455) is identified as a member of broadly conserved family non-coding RNA and expressed in most of the phylum such as Eukaryota, Metazoa, Chordata, Craniata, Vertebrata, Euteleostomi; Mammalia, and Primates etc. (www.ncbi.nlm.nih.gov). MiR-455 precursor sequence is 96 base pairs and it is present on the human chromosome 9 at locus 9q32. It is originally encoded by human COL27A1 gene (collagen type XXVII alpha 1 chain) at position 114,209,434–114,209,529. MiR-455 has been implicated in various human diseases specially cancer and chondrogenesis (Chen et al., 2016). Role of miR-455 has been identified in Human Colon Cancer (Zheng et al., 2016), prostate cancer (Zhao et al., 2017), hepatocellular carcinoma (Qin et al., 2016), gastric cancer (Liu et al., 2016), oral squamous cancer cells (Cheng et al., 2016), and non-small cell lung cancer (Li et al., 2016). However, in neurodegenerative diseases, role of miR-455-3p is barely investigated. Our previous study reported the higher expression of miR-455-3p in patients with AD and other AD sources. Current findings is the continuation of our past study to elaborate the biomarker potential of miR-455-3p in more details.
The goal of present study was to identify a suitable, non-invasive, blood-based early biomarker for AD detection. To achieve this goal, we focused on circulatory microRNAs (cmiRNAs), which are quite stable in peripheral circulation and levels of particular miRNA seems to be changing with disease severity. Our previous research findings on human serum samples from AD patients, MCI individual and healthy subjects identified significant number of deregulated miRNAs in patients compared to controls (Kumar et al., 2017). A few of them were significantly upregulated and some were down regulated in AD and MCI individual compared to healthy controls. One of the most suitable identified candidate in our study was microRNA-455-3p. Expression of miR-455-3p was found to be significantly upregulated in AD serum samples, AD postmortem brains, AD mouse model, and AD cell lines (Kumar et al., 2017). Upregulation of miR-455-3p in different cell and mouse models of AD proven its biomarker potential for AD. To further strengthen our findings, the present study is focused on the AD postmortem brains obtained from NIH NeuroBioBanks, human fibroblast, and B-lymphocytes cell lines derived from familial AD and sporadic AD patients. Expression of miR-455-3p was quantified and its diagnostic potential was examined in different sources. Further, in-silico analysis was performed to understand the roles and downstream application of miR-455-3p in AD. Findings from this study, will provide the valuable information about miR-455-3p role in AD and in search of pre-clinical biomarker for early AD detection.
Materials and Methods
Study Subjects
(a) AD postmortem brains—Postmortem brains from AD patients and healthy controls were obtained from three NIH NeuroBioBanks- (1) Human Brain and Spinal Fluid Resource Center, 11301 Wilshire Blvd (127A), Los Angeles, CA. (2) Brain Endowment Bank, University of Miami, Millar School of Medicine, 1951, NW 7th Avenue Suite 240, Miami, FL. (3) Mount Sinai NIH Brain and Tissue Repository, 130 West Kingsbridge Road Bronx, NY. Brain tissues were dissected from the Brodmann's Area 10 of the frontal cortices from AD patients (n = 27) and age and sex matched healthy controls (n = 15). Demographic and clinical details of study specimens were given in Table 1.
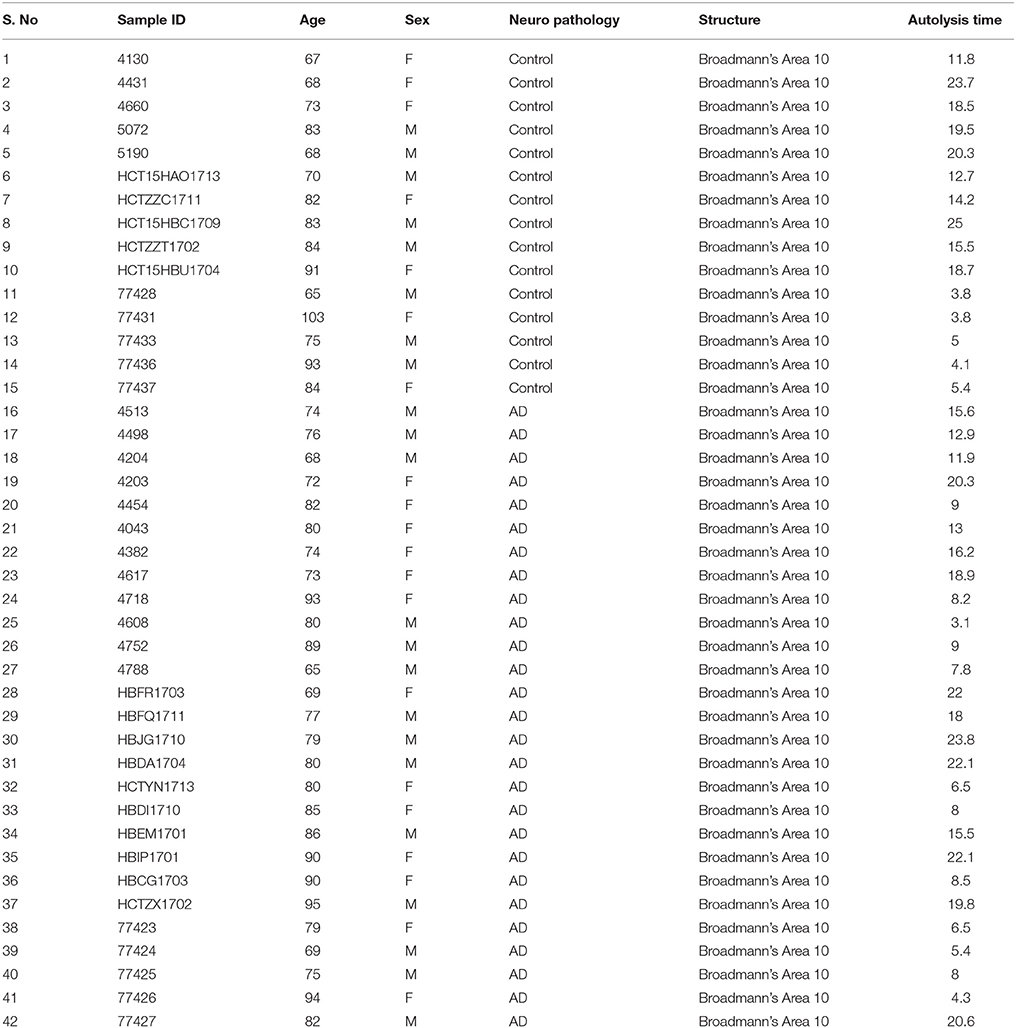
Table 1. Demographic and clinical details of the brain samples.
(b) AD patients cell lines- Human skin fibroblast and Lymphoblast cell culture systems were used for these studies. Banked skin fibroblasts and lymphoblast cells with the diagnoses AD, non-AD dementia (e.g., Huntington's disease and Parkinson's disease, and schizophrenia), and age-matched control were obtained from the Coriell Institute of Medical Research, Camden, New Jersey, USA. The demographic details of cell lines along with their passage numbers, biopsy sources and tissue types were provided in Table 2. Cells were cultured and maintained in RPMI1640 for B-lymphocytes and MEM media for Fibroblasts (Life Technologies Corporation, NY, USA; supplemented with 10% Fetal Bovine Serum and 1X penicillin/streptomycin) at 37°C with 5% CO2 to the 90–100% confluence stage in 25 and 75 cm2 cell culture flasks.
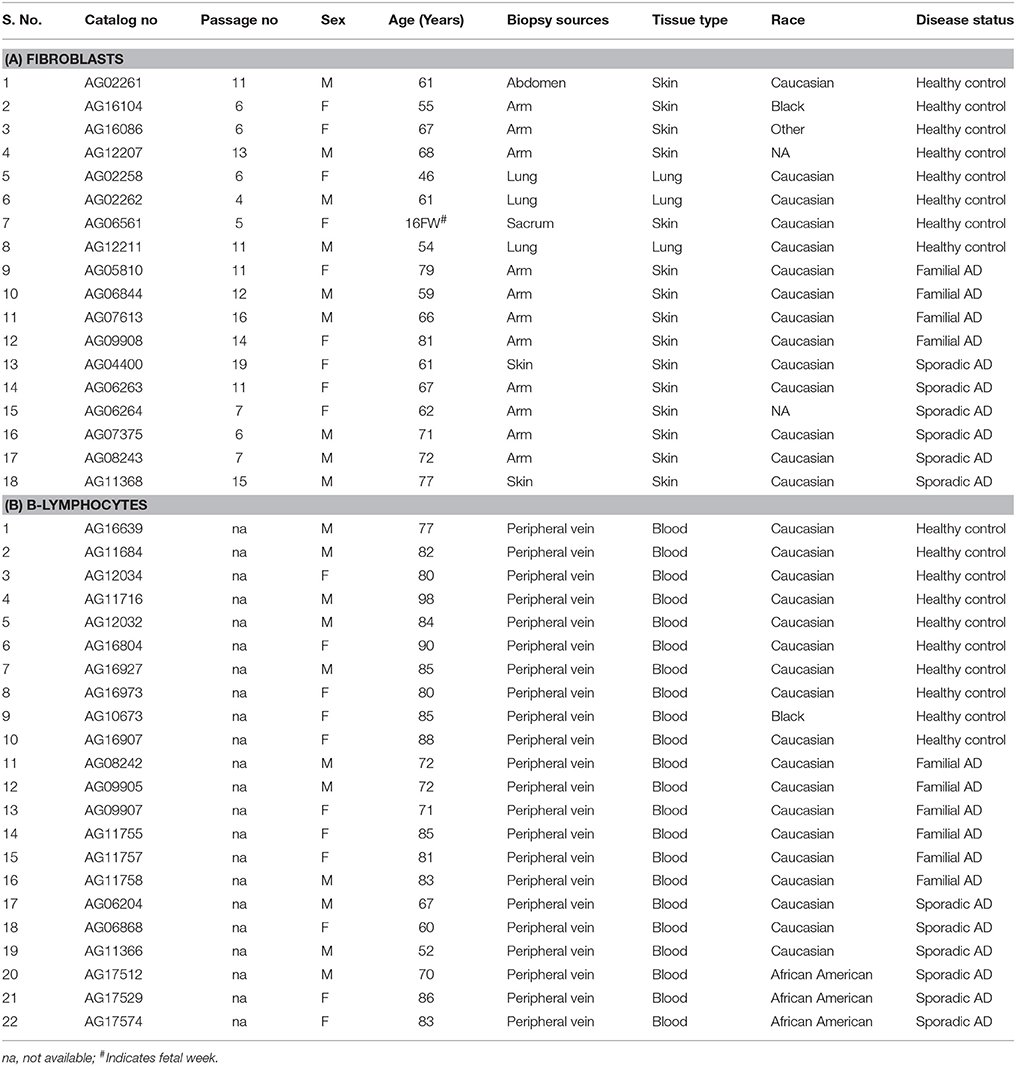
Table 2. Details of human Fibroblasts and B-lymphocytes.
Ethical Approval and Consent
The study was conducted at the Garrison Institute on Aging (GIA), Texas Tech University Health Sciences Center (TTUHSC), and study protocol was approved by the Institutional Review Board of TTUHSC, Lubbock, Texas for the use of biospecimens in Project FRONTIER (IRB #: L06-028). Regarding postmortem brains and cell lines used in the current study—each of the NIH NeuroBioBanks mentioned above operated under their institution's IRB approval. As determined by the FDA Research Involving Human Subjects Committee, current study did not reach the definition of “Human Subject Research” at 45 CFR 46.102(f) and thus, 45 CFR Part 46 does not apply (Ferguson et al., 2017). Further, according to Office for Human Research Protections Guidelines biospecimens obtained by the researchers from NIGMS Human Genetic Cell Repository are not considered to be human subjects because conducting research with the samples does not involve an intervention or interaction with the individual and the samples do not contain identifiable private information (www.coriell.org).
RNA Extraction
Total RNA was isolated from the 80 mg of frontal cortices using the TriZol RT reagent (Ambion, USA) as per manufacturer instructions. Briefly, tissue samples were homogenized in 1 ml of TriZol reagent with Bio-Gen PRO200 Homogenizer (PRO Scientific Inc., CT, USA) in a 2-ml RNase-free tube. Chloroform (0.2 ml) was added to the tissue homogenate, vigorously shaken for 15 s, and stored for 5 min at room temperature. The mixture was then centrifuged at 12,000 g for 15 min at 4°C. The supernatant was transferred to a new tube and precipitated with 0.5 ml of isopropanol for 15 min at room temperature. Samples were centrifuged at 12,000 g for 10 min at 4°C. The resulting RNA pellet was washed with 1 ml of 75% ethanol and centrifuged at 7,500 g for 5 min at 4°C. The RNA pellet was dried and dissolved in 50 μl of DEPC-treated water. The quality and quantity of the RNA were analyzed by NanoDrop analysis. The value of absorbance of each brain RNA sample (A260/A280) was 1.8–2.0.
Quantification of miRNAs Expression by Quantitative Real-Time PCR
Quantification Involved Three Steps
Polyadenylation
One microgram of total RNA was polyadenylated with an miRNA First-Strand cDNA synthesis kit (Agilent Technologies Inc., CA, USA), following manufacturer's instructions. Briefly, a polyA reaction was prepared by mixing RNA with 4.0 μl of 5X poly A polymerase buffer, 1.0 μl of rATP (10 mM), 1 μl of E. coli poly A polymerase, producing a final volume of 20 μl with RNase-free water. The tube with these components was incubated at 37°C for 30 min, followed another incubation at 95°C for 5 min to terminate the adenylation reaction (Kumar et al., 2014).
cDNA synthesis
Ten microliters of polyadenylated miRNAs were processed for cDNA synthesis with the miRNA First-Strand cDNA synthesis kit (Agilent Technologies Inc.). The following reaction components were combined in a tube: 2 μl of 10X AffinityScript RT buffer, 0.8 μl of dNTP mix (100 mM), 1 μl of RT adaptor primer (10 μM), 1.0 μl of AffinityScript RT/RNase Block enzyme, and polyadenylated RNA. The combination resulted in a reaction volume of 20 μl RNase-free water. This reaction mixture was incubated at 55°C for 5 min, then at 25°C for 15 min, followed by an incubation at 42°C for 30 min, and a final incubation at 95°C for 5 min in a Veriti 96 well thermal cycler (Applied Biosystems, USA). Resulting cDNAs were diluted with 20 μl of RNase-free water and stored at 80°C for further analysis.
Real-time RT-PCR
Real-time RT-PCR reaction was performed by preparing a reaction mixture containing 1 μl of miRNA-specific forward primer (10 μm), 1 μl of a universal reverse primer (3.125 μm) (Agilent Technologies Inc., CA, USA), 10 μl of 2X SYBR® Green PCR master mix (Applied Biosystems, NY, USA), and 1 μl of cDNA. To this mixture RNase-free water was added up to a 20 μl final volume. Primers for hsa-miR-455-3p (Forward: 5′-GCAGTCCATGGGCATATACAC-3′), and U6snRNA (P1: 5′-CGCTTCGGCAGCACATATACTAA-3′ and Reverse: 5′-TATGGAACGCTTCACGAATTTGC-3′) were synthesized commercially (Integrated DNA Technologies, Inc. Iowa USA).
To normalize the miRNA expression, U6 snRNA (small nuclear RNA) expression was also quantified in the tissue and cells, which was used as an internal control. The reaction mixture of each sample was prepared in triplicates. The reaction was set in the 7900HT Fast Real Time PCR System (Applied Biosystems, USA) using following reaction conditions: initial denaturation at 95°C for 5 min, denaturation at 95°C for 10 s, annealing at 60°C for 15 s, and extension at 72°C for 25 s. The relative levels of miR-455-3p in the AD patients vs. the controls subjects were determined in terms of their fold change, using the formula (2−ΔΔCt), where ΔCt was calculated by subtracting Ct of U6snRNA from the Ct of miR-455-3p. Real-time RT-PCR was performed in triplicate, and the data were expressed as the mean ± SD (Kumar et al., 2014; Hamam et al., 2016).
In-Silico Analysis for miR-455-3p
MiR-455-3p target genes were analyzed using various on-line miRNA algorithms (diana-microt, microrna.org, mirdb, rna22-has, targetminer, and targetscan-vert). Details about predictive and validated transcripts were obtained by searching hsa-miR-455-3p.1 and hsa-miR-455-3p.2 isoforms. Target genes were checked for following parameters: (i) their representative transcripts, (ii) number of 3P-seq tags supporting UTR +5, (iii) link to sites in UTRs, (iv) conserved sites/poorly conserved sites, (v) cumulative weighted context++ score, (vi) total context++ score, and (vii) aggregate PCT (preferentially conserved targeting) values. Further, Predicted consequential pairing showed the miRNA-target complementarity at inside or outside the seed regions of miRNAs was checked at untranslated regions links (http://www.targetscan.org).
Statistical Analysis
The real-time RT-PCR data was analyzed by using the formula 2−ΔΔCT value of genes in each sample from AD patient's samples and controls. Statistical analysis was performed with Prism software, v, 6 (La Zolla, CA). P-value was calculated, based on the unpaired t-tests for analyzing two groups and using one-way comparative analysis of variance (ANOVA) when comparing between more than two groups. ROC curve was plotted based on the ΔCT value of samples in patients and control groups. Correlation analysis was performed using two tailed Pearson correlation coefficient (r) calculation considering 95% confidence interval. P < 0.05 was considered statistically significant.
Results
Up Regulation of miR-455-3p Expression in AD
AD Postmortem Brains
Total RNA was extracted from the postmortem brains of healthy controls (n = 15) and AD patients (n = 27) and expression of hsa-miR-455-3p was quantified by real-time RT-PCR analysis. Fold-change was calculated based on the ΔCT value of miR-455-3p in AD patients' vs. healthy controls. The (–ΔCT) value (mean ± SD) was significantly (P = 0.0001) higher in AD patients (−6.89 ± 0.21) compared to the healthy controls (−8.94 ± 0.56; Figure 1A). Interestingly, fold-change analysis indicated the significantly higher expression of miR-455-3p in AD patients.
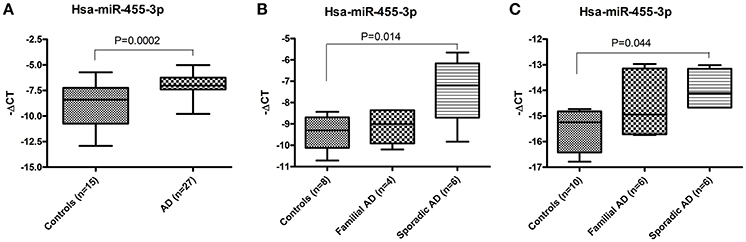
Figure 1. Expression of hsa-miR-455-3p in AD patients. (A) miR-455-3p expression in the postmortem brains of healthy controls (n = 15) and AD patients' (n = 32) was quantified by real-time RT-PCR. Data are presented as “-delta CT” values using box and whiskers plots. Significant difference between groups were calculated by unpaired t-test with P < 0.05 is considered statistically significant. (B) Expression of hsa-miR-455-3p in human fibroblast cells from healthy controls (n = 8), Familial AD cases (n = 4) and sporadic AD patients' (n = 6). Significant difference between groups were calculated by one-way ANOVA with P < 0.05 is considered statistically significant. (C) Expression of hsa-miR-455-3p in human B-lymphocytes cells from healthy controls (n = 10), Familial AD cases (n = 6) and sporadic AD patients' (n = 6). Significant difference between groups were calculated by one-way ANOVA with P < 0.05 is considered statistically significant.
AD Fibroblasts
Similarly, expression of miR-455-3p was quantified in the skin fibroblast cells generated form familial AD patients (n = 4), sporadic AD patients (n = 6), and healthy control subjects (n = 8). Differences in ΔCT values was evaluated among three groups using one-way ANOVA. Results showed the higher (−ΔCT) values (mean ± SD) of miR-455-3p in familial and sporadic patients compared to controls. However, significant difference (P = 0.014) in (−ΔCT) value was observed in sporadic cases (−7.35 ± 1.39) compared to control samples (−9.37 ± 0.76; Figure 1B).
AD B-Lymphocytes
Further, we checked the level of miR-455-3p in B-lymphocytes obtained from familial AD patients (n = 6), sporadic AD patients (n = 6), and healthy controls (n = 10). The (–ΔCT) (mean ± SD) value was compared among three group using one-way ANOVA. Analysis showed the variations in miR-455-3p level among these groups, however significant difference (P = 0.044) in (–ΔCT) value was reported between sporadic AD cases (−13.98 ± 0.73) and controls (−15.50 ± 0.80; Figure 1C). Hence, results obtained from AD postmortem brains, AD fibroblast, and AD B-lymphocyte were conclusively confirmed the decisive role of miR-455-3p in AD assessment.
Receiver Operating Characteristics Curve Analysis of miR-455-3p
AD Postmortem Brains
To determine the diagnostic performance of miR-455-3p expression in AD patients, ROC curve was plotted using (ΔCT) values of miR-455-3p in AD patients and healthy controls. Analysis showed the significant area under ROC curve (AUROC) value of miR-455-3p (AUROC = 0.792) with the 95% confidence interval was 0.637–0.948 (P = 0.0018). The cut-off value was 8.16 with sensitivity of 88.89% (95% confidence interval: 70.84–97.65%) and specificity was 66.67% (95% confidence interval: 38.38–88.18%) in AD brain samples compared with healthy controls (Figure 2A).
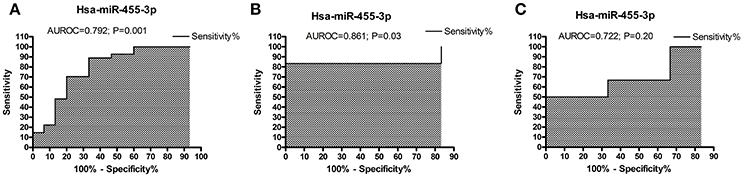
Figure 2. ROC curve analysis of hsa-miR-455-3p in (A) AD postmortem brains, (B) AD fibroblast cell lines, and in (C) B-lymphocytes cells from AD patients. The curve was plotted based on the ΔCT value of miR-455-3p in AD patients and control samples. Area under the ROC curve (AUROC) was calculated along with the sensitivity and specificity values. P < 0.05 is considered statistically significant.
In AD Fibroblasts
ROC curve was analyzed for miR-455-3p expression in fibroblast cells form familial and sporadic AD patients vs. healthy controls. However, significant AUC value was obtained for ROC curve when comparing between sporadic AD patients with healthy controls. AUROC value was (0.861) with 95% confidence interval of 0.6036–1.119 (P = 0.037). The cut-off value was 9.12 with sensitivity of 83.33% (95% confidence interval: 35.88–99.58%) and specificity was also 66.67% with confidence interval (22.28–95.67%; Figure 2B).
In AD B-Lymphocytes
Similarly ROC curve for miR-455-3p was analyzed in B-lymphocytes of AD patients. Analysis between sporadic AD patients and healthy controls showed the fair AUROC value (0.722) with 95% confidence interval of 0.4185–1.026 (P = 0.20). The cut-off value was 14.90 with sensitivity of 66.67% (95% confidence interval: 22.28–95.67%) and specificity was 50.00% (95% confidence interval: 11.81–88.19%; Figure 2C). Thus, analysis showed that ROC analysis of miR-455-3p in B-lymphocytes was not significant. However, data from postmortem AD brains and AD fibroblasts cells showed significant ROC curve data further confirmed that the miR-455-3p as a valuable molecule capable of discriminating the patients with AD from healthy individuals.
Correlation of miR-455-3p Expression with Patients' Demographic Data
We analyzed miR-455-3p expression levels in relation to (1) postmortem interval, (2) AD patients' age, and also (3) donors' age of fibroblasts, and (4) B-lymphocytes using Pearson correlation coefficients (r). AD postmortem brains showed a negative correlation r = −0.146 (with 95% confidence interval: −0.498 to 0.247; P = 0.466) between brains postmortem interval and miR-455-3p expression level (Figure 3A). Whereas a positive correlation r = 0.355 (with 95% confidence interval: −0.029 to 0.647; P = 0.069) was observed between the age of AD postmortem brains and miR-455-3p level (Figure 3B). However, P-values were not significant in both cases. Thus, results showed a trend of reduced levels of miR-455-3p with increased postmortem interval and increased trend of miR-455-3p with patients' age. As shown in Figures 3C,D, donors' age for fibroblasts (r = −0.396, 95% confidence interval: −0.821 to 0.310; P = 0.256), and B-lymphocytes (r = 0.235, 95% confidence interval: −0.391 to 0.713; P = 0.461), we did not find statistical significance, between donors age with miR-455-3p levels for fibroblasts and B-lymphocytes, indicating that donors age do not affect miR-455-3p expression levels.
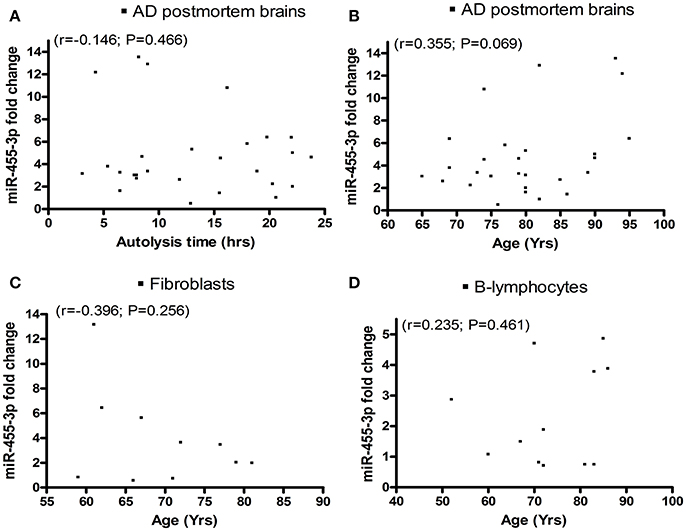
Figure 3. Scattered plot diagrams showing the Pearson correlation coefficient (r) values of miR-455-3p expression with (A) AD postmortem brains autolysis time (B) Age of AD postmortem brains (C) Age of AD fibroblast cells and (D) Age of AD B-lymphocytes.
In-Silico Analysis for miR-455-3p Function in AD
In-silico analysis was performed to understand the functions of miR-455-3p and its possible role in AD pathogenesis. Analysis was performed using the various bio-informatics algorithms such as DIANA-MICROT, MICRORNA.ORG, MIRDB, RNA22-HAS, TARGETMINER, and TARGETSCAN-VERT. As per miRbase database, a total of 3,102 reads of miR-455-3p has been detected by deep sequencing in 62 experiments (www.mirbase.org). Each algorithm was run for miR-455-3p and validated/predictive target genes were analyzed. A total of 323 predicted transcripts/human genes were identified with conserved miR-455-3p.2 binding site. Out of these genes most potential 13 targets genes were screened for those were having the roles in AD pathogenesis. Important ones were: APP, NGF, USP25, PDRG1, SMAD4, UBQLN1, SMAD2, TP73, VAMP2, HSPBAP1, and NRXN1 (Table 3). miR-455-3p having at least one or two binding site at 3′UTR of the genes and total context++ score ranges from −0.1 to −0.46. For e.g., miR-455-3p binds at the two sequence sites of 3′ UTR of APP gene at sequence position 522–528 and 3,139–3,145. Interaction of miR-455-3p at these sites will influence the expression level of APP genes. Hence, these analyses indicated the possible way the miR-455-3p involved in AD pathogenesis.
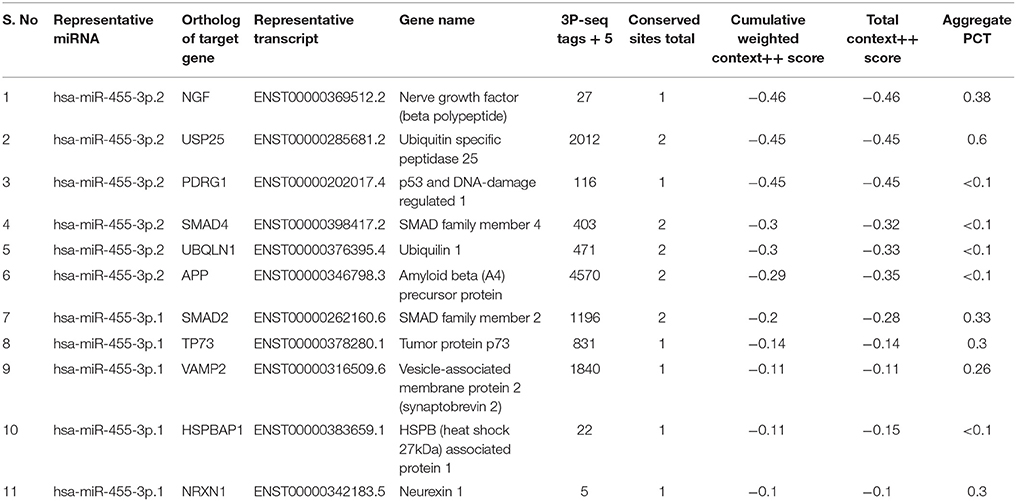
Table 3. Predictive/validated gene targets of miR-455-3p involved in AD.
Discussion
The purpose of our study was to determine the blood-based peripheral biomarkers for AD. We recently conducted a high throughput microRNA analysis using serum-derived RNA samples from MCI subjects, AD patients, and healthy control subjects (Kumar et al., 2017). We found several differentially expressed miRNAs in MCI subjects and patients with AD relative to healthy controls. Further, we verified differentially expressed miRNAs using real-time RT-PCR from serum-derived miRNAs, and also from cell and mouse models of AD. In the current study, we extended our investigations using large numbers of fibroblasts, B-lymphocytes from familial and sporadic AD patients and age-matched control subjects. We found miR-455-3p levels were upregulated in the fibroblasts and B-lymphocytes from AD patients relative to healthy control subjects. However, a significant difference was observed in the cells form sporadic AD patients compared to healthy controls. Similarly, in B-lymphocytes, miR-455-3p level was significantly upregulated in sporadic AD cases compared to controls (P = 0.044). Receiver operating characteristic curve analysis indicated the significant area under curve value of miR-455-3p in AD postmortem brains (AUROC = 0.792; P = 0.001) and AD fibroblasts cells (AUROC = 0.861; P = 0.03). These observations strongly suggest that miR-455-3p is a potential biomarker for sporadic AD.
An early stage pre-clinical diagnostic biomarkers are urgently needed to detect disease process early on in life and take necessary action to prevent and/or delay disease progression. Recent molecular biology studies using serum/plasma revealed that several circulatory microRNAs can be used as potential peripheral biomarkers for AD (Kumar and Reddy, 2016). However, these circulatory microRNAs are needed further validation using postmortem AD brains and cell and mouse models of AD. Therefore, more accurate and mechanistic research is needed to determine potential candidates as biomarkers for AD. As mentioned above, our recent lab study on AD serum samples and other AD sources/AD mouse model unveiled the miR-455-3p as potential biomarker candidate for AD (Kumar et al., 2017; Figure 4). Many other reports identified the role of miR-455-3p in several cancers and chondrogenic differentiation (Chen et al., 2016; Cheng et al., 2016; Li et al., 2016; Liu et al., 2016; Qin et al., 2016; Zheng et al., 2016; Zhao et al., 2017). Our study was the first to reveal the higher expression level of miR-455-3p in persons with AD.
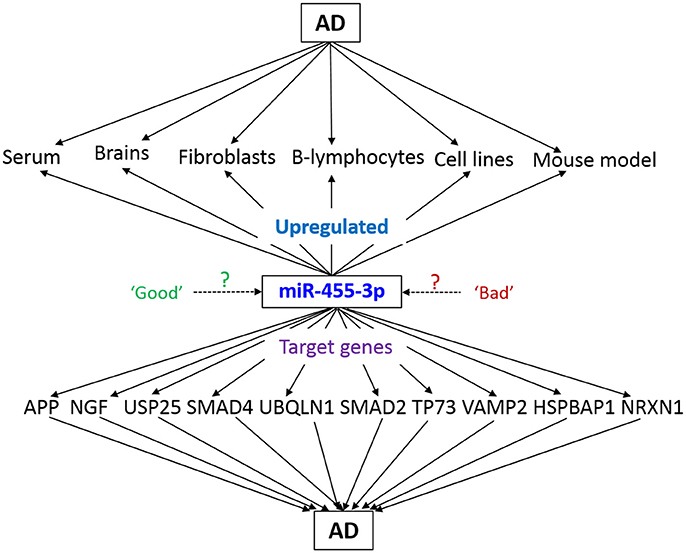
Figure 4. Schematic representation of miR-455-3p roles in AD pathogenesis. miR-455-3p expression is upregulated in different AD models and sources. Simultaneously, miR-455-3p target several key genes those are involved in the AD. Hence, upregulation of miR-455-3p in AD may be a “good” or “bad” signal for the cells. However, exact molecular link between miR-455-3p, AD, and target genes needs to be determined.
Current study is the continuation of our ongoing biomarkers research project in the Reddy Lab. Here, first we investigated miR455-3p levels in the well-defined postmortem brain tissues from AD patients. All tissues were dissected from the affected area (Broadmann's area 10) of AD patients and commonly used for the investigation of AD pathogenesis (Wilcock et al., 2015; De Rossi et al., 2016; Shackleton et al., 2017). Our current study on AD postmortem findings revealed that miR-455-3p levels are significantly increased in a large number (n = 27) of AD brains and a significant AUC value also strengthen its biomarker potential. However, we don't know the exact reason for the upregulation of miR-455-3p in AD brains and further, we still do not know molecular mechanism(s) of its increased levels. Based on current findings, we cautiously propose that the upregulation of miR-455-3p—may be a compensatory to the amyloid beta toxicity in disease process. However, we need further research to understand the nature of miR-455-3p upregulation, not only serum but also in affected tissues from AD patients and AD cell and mouse models.
Beside brain tissues, we also investigated the AD fibroblasts and B-lymphocytes for miR-455-3p expression. These AD cell lines are the good sources for the investigation of AD pathologies and associated molecular changes in the patients' genome (Khan and Alkon, 2016). Both cell types showed the significantly higher levels of miR-455-3p, especially in sporadic AD cases but not in familial AD. Further, high level of miR-455-3p in AD fibroblasts and lymphoblasts indicate that increased levels of miR-455-3p is a typical feature of AD—both in the brain and peripheral cells. Alteration of miR-455-3p expression in AD cell lines indicates the strong molecular association of miR-455-3p with AD progression.
In order to expose the roles and functions of miR-455-3p in AD, in-silico analysis provides the valuable information. As described 11 genes were reported to involve in AD progression (Figure 3) (Burton et al., 2002; Li et al., 2004; Slifer et al., 2006; Tóth et al., 2013; Sindi et al., 2014; Jung et al., 2015, 2016; Malkki, 2015; Vallortigara et al., 2016; Kuruva et al., 2017). To understand the roles of miR-455-3p in AD, expression of these genes needs to be studied by using miR-455-3p modulation approaches (mimics/inhibitors). In this direction, next phase of our study is to determine the effect of miR-455-3p on its AD related target genes. Current focus of our laboratory is to understand the role of miR-455-3p in APP processing and amyloid beta modulation, using miR-455-3p mimics and inhibitor treatments. We also predict that two potential binding sites of miR-455-3p at the 3′UTR of APP gene may be involved in the modulation of full-length APP. Further, we also predict that miR-455-3p affects the APP processing and amyloid beta production. Therefore, current findings together with our recently published study in Human Molecular Genetics (Kumar et al., 2017), strongly suggest that miR-455-3p as a potential biomarker and a possible therapeutic candidate for AD.
In summary, for the first time, we report that microRNA455-3p as a potential peripheral biomarker for AD. Our research findings are based on (1) blood-based circulatory microRNAs from AD patients, (2) AD postmortem brains, AD cell lines, and AD mouse models and a large number of AD fibroblasts and lymphoblasts.
Author Contributions
PR has contributed in designing the concept of the paper and contributed to write up of the paper. SK has performed the experiments and contributed to write up of the paper.
Conflict of Interest Statement
The authors declare that the research was conducted in the absence of any commercial or financial relationships that could be construed as a potential conflict of interest.
Acknowledgments
The research presented in this report was supported by the National Institute of Health grants AG042178, AG47812, and NS105473, and the Garrison Family Foundation, CH Foundation and Alzheimer's Association SAGA grant (to PR). We are thankful to the NIH NeuroBioBanks for providing the AD and control brain specimens. We are also thankful to the Coriell Institute of Medical Research, for providing the AD and control subjects' Fibroblasts and B-Lymphocytes for our study.
References
Bertoni-Freddari, C., Fattoretti, P., Casoli, T., Caselli, U., and Meier-Ruge, W. (1996). Deterioration threshold of synaptic morphology in aging and senile dementia of Alzheimer's type. Anal. Quant. Cytol. Histol. 18, 209–213.
Burton, T., Liang, B., Dibrov, A., and Amara, F. (2002). Transforming growth factor-beta-induced transcription of the Alzheimer beta-amyloid precursor protein gene involves interaction between the CTCF-complex and Smads. Biochem. Biophys. Res. Commun. 295, 713–723. doi: 10.1016/S0006-291X(02)00725-8
Chen, W., Chen, L., Zhang, Z., Meng, F., Huang, G., Sheng, P., et al. (2016). MicroRNA-455-3p modulates cartilage development and degeneration through modification of histone H3 acetylation. Biochim. Biophys. Acta 1863, 2881–2891. doi: 10.1016/j.bbamcr.2016.09.010
Cheng, C. M., Shiah, S. G., Huang, C. C., Hsiao, J. R., and Chang, J. Y. (2016). Up-regulation of miR-455-5p by the TGF-β-SMAD signalling axis promotes the proliferation of oral squamous cancer cells by targeting UBE2B. J. Pathol. 240, 38–49. doi: 10.1002/path.4752
DeKosky, S. T., Scheff, S. W., and Styrene, S. D. (1996). Structural correlates of cognition in dementia: quantification and assessment of synapse change. Neurodegeneration 5, 417–421. doi: 10.1006/neur.1996.0056
De Rossi, P., Buggia-Prévot, V., Clayton, B. L., Vasquez, J. B., van Sanford, C., Andrew, R. J., et al. (2016). Predominant expression of Alzheimer's disease-associated BIN1 in mature oligodendrocytes and localization to white matter tracts. Mol. Neurodegener. 11:59. doi: 10.1186/s13024-016-0124-1
Du, H., Guo, L., Yan, S., Sosunov, A. A., McKhann, G. M., and Yan, S. S. (2010). Early deficits in synaptic mitochondria in an Alzheimer's disease mouse model. Proc. Natl. Acad. Sci. U.S.A. 107, 18670–18675. doi: 10.1073/pnas.1006586107
Ferguson, S. A., Panos, J. J., Sloper, D., and Varma, V. (2017). Neurodegenerative markers are increased in postmortem BA21 tissue from African Americans with Alzheimer's disease. J. Alzheimers Dis. 59, 57–66. doi: 10.3233/JAD-170204
Hamam, R., Ali, A. M., Alsaleh, K. A., Kassem, M., Alfayez, M., Aldahmash, A., et al. (2016). microRNA expression profiling on individual breast cancer patients identifies novel panel of circulating microRNA for early detection. Sci. Rep. 6:25997. doi: 10.1038/srep25997
Jung, E. S., Choi, H., Song, H., Hwang, Y. J., Kim, A., Ryu, H., et al. (2016). p53-dependent SIRT6 expression protects Aβ42-induced DNA damage. Sci. Rep. 6:25628. doi: 10.1038/srep25628
Jung, E. S., Hong, H., Kim, C., and Mook-Jung, I. (2015). Acute ER stress regulates amyloid precursor protein processing through ubiquitin-dependent degradation. Sci. Rep. 5:8805. doi: 10.1038/srep08805
Khan, T. K., and Alkon, D. L. (2016). An internally controlled peripheral biomarker for Alzheimer's disease: Erk1 and Erk2 responses to the inflammatory signal bradykinin. Proc. Natl. Acad. Sci. U.S.A. 103, 13203–13207. doi: 10.1073/pnas.0605411103
Kumar, S., Chawla, Y. K., Ghosh, S., and Chakraborti, A. (2014). Severity of hepatitis C virus (genotype-3) infection positively correlates with circulating microRNA-122 in patients sera. Dis. Markers 2014:435476. doi: 10.1155/2014/435476
Kumar, S., and Reddy, P. H. (2016). Are circulating microRNAs peripheral biomarkers for Alzheimer's disease?. Biochim. Biophys. Acta 1862, 1617–1627. doi: 10.1016/j.bbadis.2016.06.001
Kumar, S., Vijayan, M., and Reddy, P. H. (2017). MicroRNA-455-3p as a potential peripheral biomarker for Alzheimer's disease. Hum. Mol. Genet. 26, 3808–3822. doi: 10.1093/hmg/ddx267
Kuruva, C. S., Manczak, M., Yin, X., Ogunmokun, G., Reddy, A. P., and Reddy, P. H. (2017). Aqua-soluble DDQ reduces the levels of Drp1 and Aβ and inhibits abnormal interactions between Aβ and Drp1 and protects Alzheimer's disease neurons from Aβ- and Drp1-induced mitochondrial and synaptic toxicities. Hum. Mol. Genet. 26, 3375–3395. doi: 10.1093/hmg/ddx226
LaFerla, F. M., Green, K. N., and Oddo, S. (2007). Intracellular amyloid-beta in Alzheimer's disease. Nat. Rev. Neurosci. 8, 499–509. doi: 10.1038/nrn2168
Li, Q., Athan, E. S., Wei, M., Yuan, E., Rice, S. L., Vonsattel, J. P., et al. (2004). TP73 allelic expression in human brain and allele frequencies in Alzheimer's disease. BMC Med. Genet. 5:14. doi: 10.1186/1471-2350-5-14
Li, Y. J., Ping, C., Tang, J., and Zhang, W. (2016). MicroRNA-455 suppresses non-small cell lung cancer through targeting ZEB1. Cell Biol. Int. 40, 621–628. doi: 10.1002/cbin.10584
Liu, J., Zhang, J., Li, Y., Wang, L., Sui, B., and Dai, D. (2016). MiR-455-5p acts as a novel tumor suppressor in gastric cancer by down-regulating RAB18. Gene 592, 308–315. doi: 10.1016/j.gene.2016.07.034
Malkki, H. (2015). Alzheimer disease: NGF gene therapy activates neurons in the AD patient brain. Nat. Rev. Neurol. 11:548. doi: 10.1038/nrneurol.2015.170
Mattson, M. P. (2004). Pathways towards and away from Alzheimer's disease. Nature 430, 631–639. doi: 10.1038/nature02621
McGeer, P. L., and McGeer, E. G. (1995). The inflammatory response system of brain: implications for therapy of Alzheimer and other neurodegenerative diseases. Brain Res. Rev. 21, 195–218. doi: 10.1016/0165-0173(95)00011-9
Nunomura, A., Perry, G., Aliev, G., Hirai, K., Takeda, A., Balraj, E. K., et al. (2001). Oxidative damage is the earliest event in Alzheimer disease. J. Neuropathol. Exp. Neurol. 60, 759–767. doi: 10.1093/jnen/60.8.759
Qin, L., Zhang, Y., Lin, J., Shentu, Y., and Xie, X. (2016). MicroRNA-455 regulates migration and invasion of human hepatocellular carcinoma by targeting Runx2. Oncol. Rep. 36, 3325–3332. doi: 10.3892/or.2016.5139
Reddy, P. H. (2006). Amyloid precursor protein-mediated free radicals and oxidative damage: implications for the development and progression of Alzheimer's disease. J. Neurochem. 96, 1–13. doi: 10.1111/j.1471-4159.2005.03530.x
Reddy, P. H., and Beal, M. F. (2008). Amyloid beta, mitochondrial dysfunction and synaptic damage: implications for cognitive decline in aging and Alzheimer's disease. Trends Mol. Med. 14, 45–53. doi: 10.1016/j.molmed.2007.12.002
Reddy, P. H., Manczak, M., Mao, P., Calkins, M. J., Reddy, A. P., and Shirendeb, U. (2010). Amyloid-beta and mitochondria in aging and Alzheimer's disease: implications for synaptic damage and cognitive decline. J. Alzheimers Dis. 20, S499–S512. doi: 10.3233/JAD-2010-100504
Reddy, P. H., Tonk, S., Kumar, S., Vijayan, M., Kandimalla, R., Kuruva, C. S., et al. (2017). A critical evaluation of neuroprotective and neurodegenerative MicroRNAs in Alzheimer's disease. Biochem. Biophys. Res. Commun. 483, 1156–1165. doi: 10.1016/j.bbrc.2016.08.067
Reddy, P. H., Tripathi, R., Troung, Q., Tirumala, K., Reddy, T. P., Anekonda, V., et al. (2012). Abnormal mitochondrial dynamics and synaptic degeneration as early events in Alzheimer's disease: implications to mitochondria-targeted antioxidant therapeutics. Biochim. Biophys. Acta 1822, 639–649. doi: 10.1016/j.bbadis.2011.10.011
Shackleton, B., Crawford, F., and Bachmeier, C. (2017). Apolipoprotein E-mediated modulation of ADAM10 in Alzheimer's disease. Curr. Alzheimer Res. 14, 578–585. doi: 10.2174/1567205014666170203093219
Sindi, I. A., Tannenberg, R. K., and Dodd, P. R. (2014). Role for the neurexin-neuroligin complex in Alzheimer's disease. Neurobiol. Aging 35, 746–756. doi: 10.1016/j.neurobiolaging.2013.09.032
Slifer, M. A., Martin, E. R., Bronson, P. G., Browning-Large, C., Doraiswamy, P. M., Welsh-Bohmer, K. A., et al. (2006). Lack of association between UBQLN1 and Alzheimer disease. Am. J. Med. Genet. B Neuropsychiatr. Genet. 141B, 208–213. doi: 10.1002/ajmg.b.30298
Swerdlow, R. H. (2011). Brain aging, Alzheimer's disease, and mitochondria. Biochim. Biophys. Acta 1812, 1630–1639. doi: 10.1016/j.bbadis.2011.08.012
Tampellini, D., and Gouras, G. K. (2010). Synapses, synaptic activity and intraneuronal abeta in Alzheimer's disease. Front. Aging Neurosci. 2:13. doi: 10.3389/fnagi.2010.00013
Terry, R. D., Masliah, E., Salmon, D. P., Butters, N., DeTeresa, R., Hill, R., et al. (1991). Physical basis of cognitive alterations in Alzheimer's disease: synapse loss is the major correlate of cognitive impairment. Ann. Neurol. 30, 572–580. doi: 10.1002/ana.410300410
Tóth, M. E., Szegedi, V., Varga, E., Juhász, G., Horváth, J., Borbély, E., et al. (2013). Overexpression of Hsp27 ameliorates symptoms of Alzheimer's disease in APP/PS1 mice. Cell Stress Chaperones 18, 759–771. doi: 10.1007/s12192-013-0428-9
Vallortigara, J., Whitfield, D., Quelch, W., Alghamdi, A., Howlett, D., Hortobágyi, T., et al. (2016). Decreased levels of VAMP2 and monomeric alpha-synuclein correlate with duration of dementia. J. Alzheimers Dis. 50, 101–110. doi: 10.3233/JAD-150707
Wilcock, D. M., Hurban, J., Helman, A. M., Sudduth, T. L., McCarty, K. L., Beckett, T. L., et al. (2015). Down syndrome individuals with Alzheimer's disease have a distinct neuroinflammatory phenotype compared to sporadic Alzheimer's disease. Neurobiol. Aging 36, 2468–2474. doi: 10.1016/j.neurobiolaging.2015.05.016
Williams, J., Smith, F., Kumar, S., Vijayan, M., and Reddy, P. H. (2016). Are microRNAs true sensors of ageing and cellular senescence?. Ageing Res. Rev. 35, 350–363. doi: 10.1016/j.arr.2016.11.008
Zhao, Y., Yan, M., Yun, Y., Zhang, J., Zhang, R., Li, Y., et al. (2017). MicroRNA-455-3p functions as a tumor suppressor by targeting eIF4E in prostate cancer. Oncol. Rep. 37, 2449–2458. doi: 10.3892/or.2017.5502
Zheng, J., Lin, Z., Zhang, L., and Chen, H. (2016). MicroRNA-455-3p inhibits tumor cell proliferation and induces apoptosis in HCT116 human colon cancer cells. Med. Sci. Monit. 18, 4431–4437. doi: 10.12659/MSM.898452
Keywords: microRNA-455-3p, Alzheimer's disease, biomarker, post-mortem brains, fibroblasts, B-lymphocytes
Citation: Kumar S and Reddy PH (2018) MicroRNA-455-3p as a Potential Biomarker for Alzheimer's Disease: An Update. Front. Aging Neurosci. 10:41. doi: 10.3389/fnagi.2018.00041
Received: 04 December 2017; Accepted: 06 February 2018;
Published: 23 February 2018.
Edited by:
Xiongwei Zhu, Case Western Reserve University, United StatesReviewed by:
Qitao Ran, University of Texas Health Science Center San Antonio, United StatesWei Chen, Beijing Institute of Pharmacology and Toxicology, China
Haitao Liu, Case Western Reserve University, United States
Russell H. Swerdlow, University of Kansas, United States
Copyright © 2018 Kumar and Reddy. This is an open-access article distributed under the terms of the Creative Commons Attribution License (CC BY). The use, distribution or reproduction in other forums is permitted, provided the original author(s) and the copyright owner are credited and that the original publication in this journal is cited, in accordance with accepted academic practice. No use, distribution or reproduction is permitted which does not comply with these terms.
*Correspondence: P. Hemachandra Reddy, hemachandra.reddy@ttuhsc.edu