 Johann S. Hawe
 Fabian J. Theis
 Matthias Heinig
- 1Institute of Computational Biology, HelmholtzZentrum München, Munich, Germany
- 2Department of Informatics, Technische Universität München, Munich, Germany
- 3Department of Mathematics, Technische Universität München, Munich, Germany
A major goal in systems biology is a comprehensive description of the entirety of all complex interactions between different types of biomolecules—also referred to as the interactome—and how these interactions give rise to higher, cellular and organism level functions or diseases. Numerous efforts have been undertaken to define such interactomes experimentally, for example yeast-two-hybrid based protein-protein interaction networks or ChIP-seq based protein-DNA interactions for individual proteins. To complement these direct measurements, genome-scale quantitative multi-omics data (transcriptomics, proteomics, metabolomics, etc.) enable researchers to predict novel functional interactions between molecular species. Moreover, these data allow to distinguish relevant functional from non-functional interactions in specific biological contexts. However, integration of multi-omics data is not straight forward due to their heterogeneity. Numerous methods for the inference of interaction networks from homogeneous functional data exist, but with the advent of large-scale paired multi-omics data a new class of methods for inferring comprehensive networks across different molecular species began to emerge. Here we review state-of-the-art techniques for inferring the topology of interaction networks from functional multi-omics data, encompassing graphical models with multiple node types and quantitative-trait-loci (QTL) based approaches. In addition, we will discuss Bayesian aspects of network inference, which allow for leveraging already established biological information such as known protein-protein or protein-DNA interactions, to guide the inference process.
1. Introduction
Systems biology aims to model complex biological systems by employing a holistic view on all cellular processes (Ideker et al., 2001). At its heart lies the central dogma of biology (Crick, 1958), i.e., genes encoded in the DNA (genome) are transcribed to mRNAs (transcriptome) which are translated to proteins (proteome). Additionally, other omic layers like the methylome (DNA methylation at CpG dinucleotides) and the metabolome (abundance of metabolites) take part in maintaining biological systems through molecular interaction networks. These lay the foundation for cellular processes such as gene expression regulation and metabolism. The working hypothesis of systems biology is that understanding molecular interactions and the regulatory networks they form is crucial to understand system level properties such as diseases or other phenotypes (Ideker et al., 2001).
Therefore, a goal of systems biology is to establish interactomes: networks of interacting molecules of distinct cellular omic layers. We define an interactome as a network consisting of nodes representing individual molecules and connections between nodes (edges) which reflect (1) physical (direct) or (2) functional (indirect) interactions between molecules. To establish physical interactions, experimental assays systematically interrogating direct interactions between molecules can be applied. For example, a protein interactome based on protein-protein interactions (PPIs, e.g., protein complexes), can be determined by large-scale yeast-2-hybrid screens (Y2H) or affinity purification followed by mass-spectrometry (AP-MS) (Brueckner et al., 2009). Furthermore, genome-wide protein-DNA interactomes can be constructed by chromatin immunoprecipitation followed by next-generation sequencing (ChIP-seq) (Johnson et al., 2007) in order to identify for instance all sites in the genome, where a particular transcription factor (TF) binds. Similarly, protein-RNA interactions can be probed using cross-linking immunoprecipitation (CLIP-seq) (Licatalosi et al., 2008; Van Nostrand et al., 2016). In addition, DNA-DNA and RNA-RNA interactomes can be established using Chromosome Conformation Capture (Hi-C) (Belton et al., 2012) or RAP-RNA sequencing (Engreitz et al., 2014), respectively.
Indirect functional interactions can be established experimentally through synthetic genetic array (SGA) screens (genetic interactions) (Costanzo et al., 2010) or by computational approaches such as co-regulation (determined from ChIP-seq or co-expression analyses) or co-evolution (Marcotte et al., 1999; De Bodt et al., 2006). For instance, if two genes both are always active in one set of samples and inactive in another set, one might conclude that the two genes are functionally related, based on the principle of guilt by association. This hence would allow to infer a hitherto unknown function of one gene if the function of the other gene is known.
In contrast to experimental protocols enabling to assess global omics profiles in arbitrary cellular contexts with relative ease, physical interaction probing cannot easily be applied to a broad range of biological contexts due to non-physiological conditions (e.g., Y2H) or the limited scope of one-to-many interaction profiling (e.g., AP-MS). Similar to reference genome sequences which are frequently used to provide a coordinate system for the analysis of DNA related processes, context-independent “reference interactomes” can serve as scaffolds to complement cell type or condition (e.g., disease) dependent analyses and several resources aim to provide these for numerous organisms (Table 1). These data set the stage for identifying context specific functionally relevant interactions and novel analysis methodologies need to be developed to derive or complement interactomes using functional genomics data.
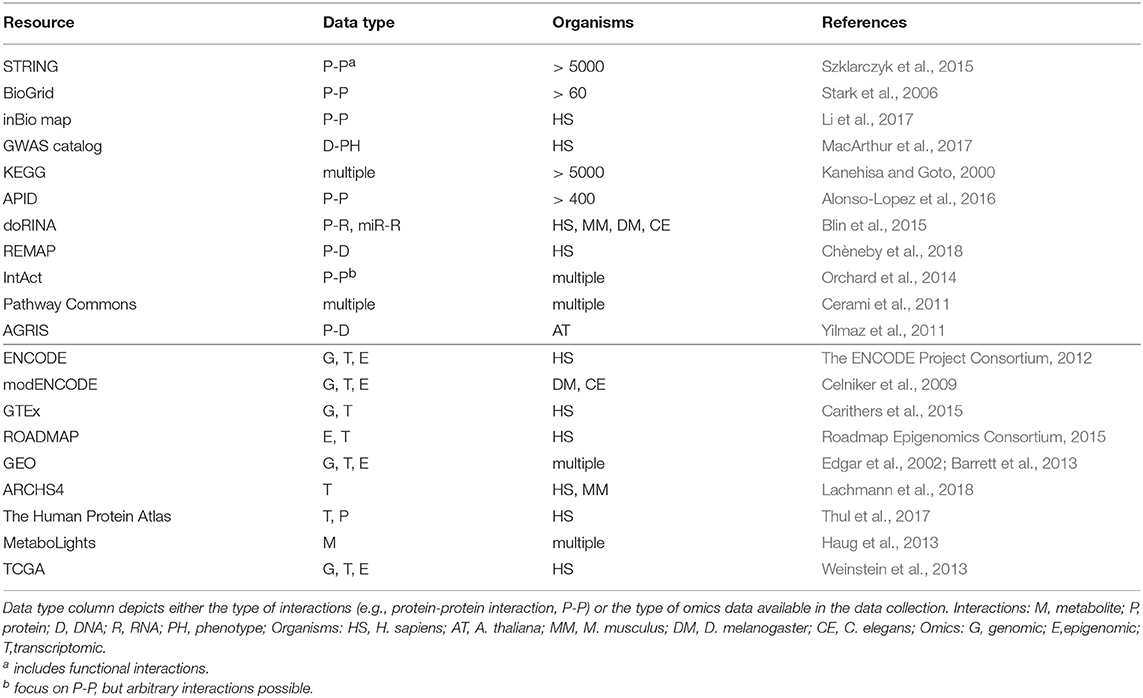
Table 1. Overview on selected resources for molecular interactions and omics datasets.
Rich functional genomic data across large numbers of samples and across multiple omics layers per sample have been accumulated in several large scale projects, paving the way for a systematic integration of reference interactomes with context specific multi-omics data (see Box 1, resources listed in Table 1). These data allow researchers to link static interactomes to disease (e.g., TCGA in cancer) or tissue specific (e.g., GTEx) contexts and have already furthered our understanding of e.g., cancer mechanisms (Manatakis et al., 2018) or tissue specific gene regulation (Saha et al., 2017).
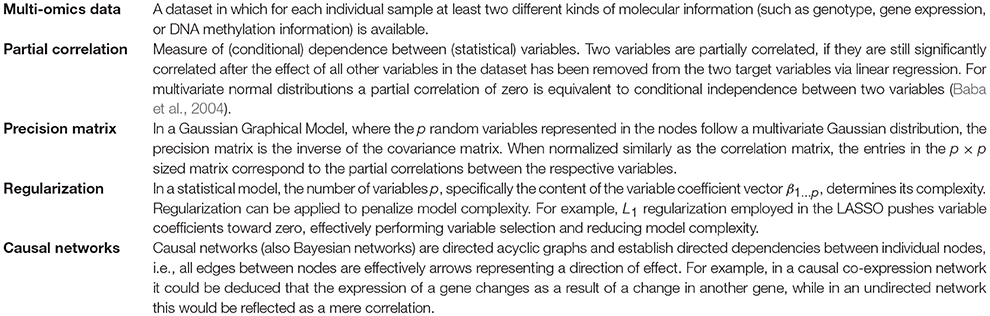
Box 1. Glossary.
They can further help in interpreting non-coding DNA sequence variants (single nucleotide polymorphisms, SNPs) from genome-wide association studies (GWAS). Integration of GWAS results with interaction data can pinpoint SNPs and their molecular targets causal to the respective GWAS phenotype (e.g., Hosp et al., 2015; Suhre et al., 2017). Additionally, databases like GTEx allow to interrogate tissue specific functional consequences of non-coding GWAS SNPs (Albert and Kruglyak, 2015; Aguet et al., 2017).
As protocols to measure functional genomics data get further developed, more possibilities to establish context specific interactomes arise. Single-cell nucleosome, methylation, and transcription sequencing (scNMT-seq) (Clark et al., 2018), for example, allows to generate multi-omics profiles of single cells. This, and single-cell experiments in general, open up promising new avenues for analyzing regulatory pathways in cellular systems: For instance, with single-cell data it is now possible to look at associations between variables in a more conventional statistical setting with at least as many or more samples (single cells) as measured variables, which is usually not the case in typical (bulk) omics studies (see section 2.2). Moreover, single-cell resolution further allows to extract dynamic properties of cellular systems on the basis of static snapshot data, making it possible to for example infer differentiation specific regulatory networks (Ocone et al., 2015). Single-cell data, however, come with their own challenges, for instance a high number of missing values due to low coverage per cell or dropout effects, and these have to be overcome in order to use them to their full potential.
Global interaction networks are important assets for systems biologists, yet their construction is not trivial for dynamic biological systems and novel methods need to be developed Here we present state-of-the-art methods for inferring interaction networks from multi-omics data. We will focus on two inference concepts which we term asynchronous and synchronous methods: asynchronous methods integrate multi-omics data in a step-by-step fashion, two omics at a time while synchronous methods incorporate all data concurrently (Figure 1). We will describe the inference of homogeneous and heterogeneous networks, i.e., networks consisting of a single or multiple node types, respectively, and further consider integration of prior biological knowledge to guide the inference process.
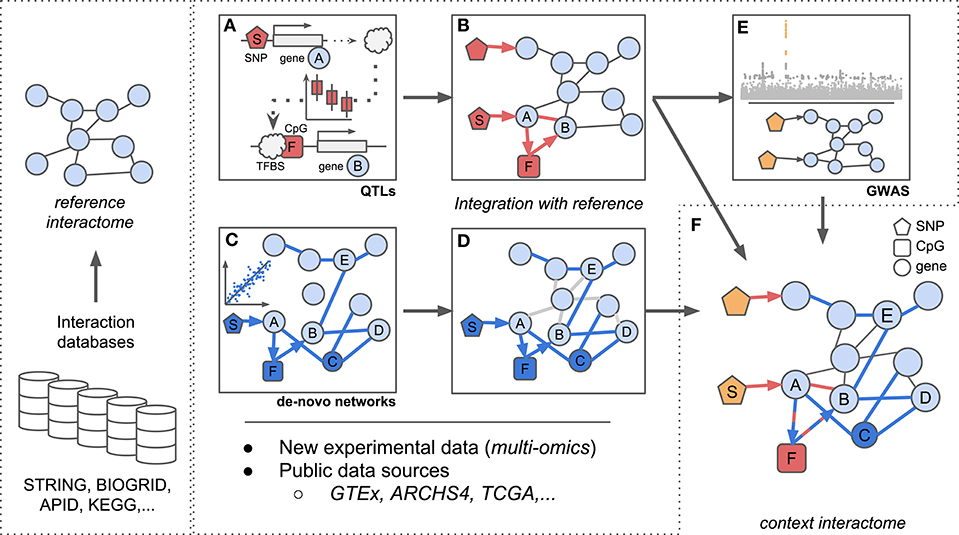
Figure 1. Scheme for integration of reference interactomes with multi-omics data and phenotypes (GWAS) to obtain context specific interactomes. (A) trans-eQTL allow to investigate e.g., TF binding mechanisms which can be complemented with additional regulatory information such as CpG methylation. (B) Established associations from (A) between SNP S, TF A, CpG F, and gene B complement reference interactomes. (C) Regulatory (possibly heterogeneous) networks are inferred from multi-omics data optionally using established biological knowledge as prior information. Integration of e.g., genotypes, expression, and methylation data allows to investigate regulatory dependencies between different omic layers. (D) Associations identified in (C) complement reference interactomes by adding new regulatory layers (SNP S, CpG F), novel genes (gene C) or new links between already existing genes (genes B and E) similar to (B). (E) Reference interactomes are annotated with SNPs associated with specific disease contexts from GWAS results. (F) The final context-specific interactome enables detailed investigation of disease related regulatory mechanisms across distinct omic layers.
2. Statistical Basis for Data Integration
2.1. Pairwise Associations and Graphical Models
Typically, the basis for all omics analysis is formed by a large data matrix (or several, in case of multi-omics experiments): For gene expression data, for instance, the columns would represent individual genes (the variables) and the rows the different samples, each entry hence reflecting the expression of a certain gene in a specific sample.
Graphs are a common way of describing molecular interactions in such data, where nodes represent individual molecules and edges connecting the nodes represent their interactions. For instance, a graph might display proteins as nodes and represent protein-protein interactions as edges. Mathematically, nodes represent random variables (RVs) and integration methods seek to determine dependencies between RVs within or across omics types to infer interaction networks.
The simplest approach to construct correlation networks from multi-omics data is by applying pairwise association measures, such as linear regression, Pearson's Correlation Coefficient (PCC) or Spearman's Rank Correlation coefficient (SRCC), repeatedly on all pairs of RVs. Pairs with non-zero correlation coefficients will be connected by an edge in the graph (Figure 3B). For example, applying the PCC on the expression data of two genes which have been measured in multiple samples yields gene co-expression information: one gene is expressed when the other one is expressed or vice versa (similarly, one gene could be repressed while the other one is expressed). Furthermore, these measures are also used in quantitative-trait locus (QTL) based analyses to identify associations between e.g., SNPs and gene expression, i.e., to determine the genetic effect of sequence variation on a quantitative molecular trait. Alternatively, mutual information (MI) can be employed to detect non-linear relationships (Song et al., 2012). MI is used in several network inference tools (e.g., ARACNE, Margolin et al., 2006; Lachmann et al., 2016), but refined concepts of correlations like the biweight midcorrelation (Zhang and Horvath, 2005; Langfelder and Horvath, 2008) have been shown to outperform MI (Song et al., 2012).
Pairwise approaches applied on omics data yield networks containing indirect associations due to their inability to distinguish direct and indirect effects (Schäfer and Strimmer, 2005). This leads to very dense networks (high number of edges) (Krumsiek et al., 2011) and hence limited interpretability. Conditional dependencies (partial correlations) associate two Gaussian variables while accounting for the effect of all other variables and thereby alleviate this problem: indirect dependencies between two variables originating from a direct dependency on a common source variable will no longer result in an additional connection between the two variables and only the direct interactions between the common source and each variable individually will be retained (Figures 2, 3C). As an example, consider the expression of two genes (node B and C in Figure 2) that are both regulated by the same transcription factor (node A in Figure 2). Regulation of a target gene by the transcription factor introduces a direct dependency between the expression of the transcription factor and the expression of the gene. If two genes are regulated by the same transcription factor, this dependence on a common source variable induces an indirect dependency between the two genes. This indirect dependency would introduce an edge in a pairwise correlation graph (Figure 2A), which would be removed when considering only conditional dependence measures such as partial correlation (Figures 2B,D). In contrast, direct dependencies such as the one between the transcription factor and its target (node A and B in Figure 2B) are preserved in the partial correlation network (Figure 2C). This idea is forming the basis of graphical models, known also as conditional dependence networks (Lauritzen, 1996; Meinshausen and Bühlmann, 2006; Friedman et al., 2008), where edges only represent the conditional dependencies between RVs.
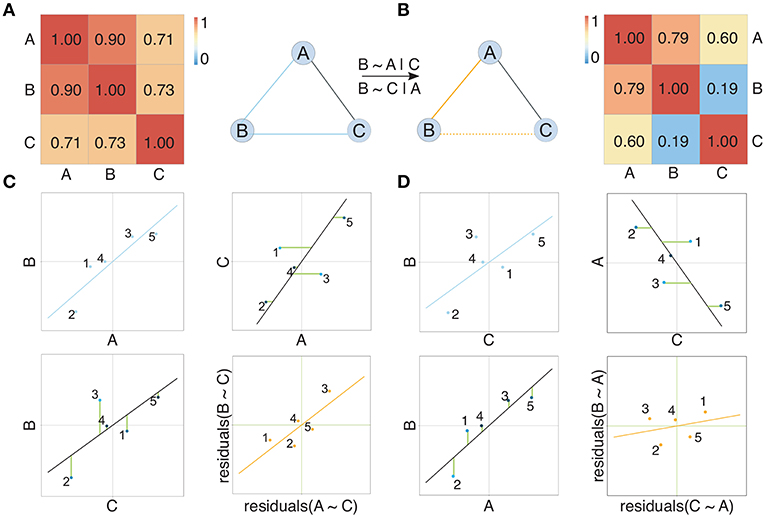
Figure 2. Illustration of the concept of partial correlation networks. Two networks show the dependency structure between random variables depicted as nodes. Solid edges in (A) represent high Pearson correlation coefficients between random variables, also shown in the corresponding correlation matrix. Solid edges in (B) represent non-zero partial correlation coefficients between random variables, also shown in the corresponding partial correlation matrix. Considering partial correlation compared to Pearson correlation removes the edge between B and C arising from the effect A exhibits on both B and C. Subfigure (C) compares correlation and partial correlation between A and B given C. Scatter plots show the original data (blue), the residuals (green lines) after regressing both A and B on C, and the relation between the residuals (orange). Here a clear linear relation between the residuals is observed, which is reflected in a non-zero partial correlation (represented by an edge) between A and B. Analogously, subfigure (D) compares correlation and partial correlation between B and C given A. Here no clear linear relation between the residuals is observed, which is reflected in a partial correlation between B and C that is not significantly different from zero. Consequently, there is no edge between B and C in the partial correlation graph.
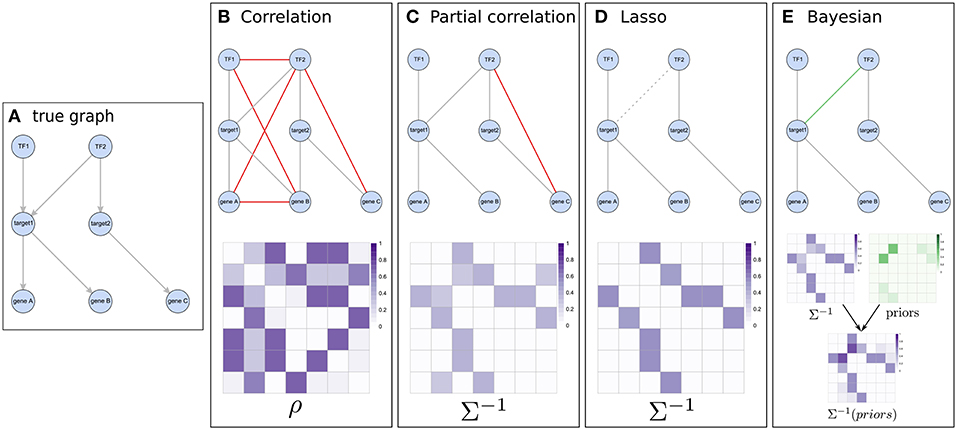
Figure 3. Illustration of the concept of different network inference methods. (A) represents a known pathway structure which should be recovered from functional data using the different approaches: two transcription factors influencing expression of two target genes which in turn affect the expression of other downstream genes. (B,C) show correlation based results and their estimated matrices (correlation and partial-correlation, respectively). While using Pearson correlation results in many indirect associations (shown in red), this is largely amended by using partial correlations. (D) The graphical lasso pushes weaker associations (e.g., between TF1 and gene C) toward zero in the precision matrix and might do so even for real edges which have relatively low evidence in the data (like the edge between TF2 and target1). (E) When considering prior information, weak associations still have a chance of getting selected if their respective prior (shown in green) supports them.
In our case we mostly focus on Gaussian Graphical Models (GGMs) which assume normally distributed variables and have for instance been used in gene expression studies (Schäfer and Strimmer, 2005), in metabolomics (Krumsiek et al., 2011) and to discover novel interactions between genotypes and metabolites (Krumsiek et al., 2012). In GGMs, the network structure is given by the precision matrix Σ−1, the inverse of the covariance matrix Σ (Friedman et al., 2008) (see Box 1). In contrast to correlation networks, the edges reflect partial correlations (Figure 2) between RVs and correspond to the non-zero, off-diagonal entries of Σ−1. Methods seek to estimate either Σ−1 (e.g., GeneNet, Schäfer and Strimmer, 2005) or only its non-zero elements (e.g., Meinshausen and Bühlmann, 2006; Friedman et al., 2008).
2.2. Regularization and the Graphical LASSO
Inference methods working on genomic data typically suffer from the n < < p problem, which occurs when the number of samples is significantly smaller than the number of variables (a typical large expression experiment for example might comprise hundreds of samples and > 20, 000 genes). Specifically, if n < < p, fitting a statistical model is challenging: more variables than data points yield too many degrees of freedom and an underdetermined mathematical system, which ultimately poses a risk of overfitting the model to the measured data (Friedman et al., 2001). A way to handle this dimensionality burden is by using regularization (e.g., GeneNet Schäfer and Strimmer, 2005, see Box 1). While GeneNet uses a shrinkage procedure for estimating Σ−1, Meinshausen and Bühlmann apply LASSO (Least Absolute Shrinkage and Selection Operator) regression separately for each variable against all others to estimate the non-zero entries of Σ−1 under assumption of a sparse precision matrix (Meinshausen and Bühlmann, 2006). The underlying idea is to use L1 regularization (see Box 1) to constrain the total length of the estimated parameter vectors (variable coefficients, β = {β1, β2, …βp}) and simultaneously perform variable selection by implicitly pushing the least important parameters toward zero, thereby also circumventing the n < < p problem introduced above. This yields a precision matrix Σ−1 in which an entry σij for two variables (i, j) is non-zero, if either βij (i regressed against j) or βji or both are non-zero. Ultimately, this procedure exhibits a similar effect as in the conditional dependence graphs mentioned above, with relatively more of the weaker dependencies getting removed (Figure 3D).
However, the above mentioned approach yields only an approximation of the underlying likelihood. To amend this, Friedman et al. present the graphical LASSO (gLASSO), which evaluates the penalized log-likelihood of the multivariate Gaussian distribution by using a block-wise gradient descent algorithm (Banerjee et al., 2007; Friedman et al., 2008) and other works improve upon this idea to achieve e.g., faster convergence (Hsieh et al., 2013).
An important task when using the above methods is to screen for optimal values of the L1 penalization parameter, ρ, to select the ideal graph. The selection of ρ can be done either via cross validation or by employing the Bayesian Information Criterion (BIC), where larger values of ρ encourage sparser graphs and vice versa.
Interestingly, the gLASSO also facilitates the inclusion of biological prior information [the LASSO L1 regularization can be interpreted as a Laplace prior on model coefficients (Friedman et al., 2001)]. By element-wise multiplication of a prior matrix P with Σ−1 in the L1-norm, where P = p×p and p is the number of variables, distinct weights can be assigned to encourage or discourage edges (Li and Jackson, 2015). Employing this possibility and in general utilizing prior information has the potential to retain edges which would otherwise falsely be removed (e.g., due to weak representation in the data) if the respective prior is strong enough (Figure 3E, see also section 2.4). Such prior knowledge, e.g., that a specific transcription factor is a known regulator of a gene (Figure 3E), can be extracted from independent databases such as the ones listed in Table 1.
2.3. Mixed Graphical Models for Multi-Omics Data Integration
Above mentioned methods assume Gaussian RVs and infer homogeneous networks, which is not always appropriate in multi-omics settings due to heterogeneity in the measured data. This is for example the case when integrating discrete genotype data with continuous DNA methylation data. This is taken into account by works building on the Meinshausen-Bühlmann approach to infer heterogeneous networks from multi-omics data using Mixed Graphical Models (MGMs) (Lee and Hastie, 2013) and identify edges by regressing each continuous or discrete variable against all others applying either (Gaussian) linear or (multiclass) logistic regression, respectively. This allows for example to directly integrate discrete genotype data of specific sequence variants with DNA methylation readouts and hence to uncover e.g., the genetic determinants of epigenetic marks. In contrast to Lee and Hastie who apply a single penalty parameter, Sedgewick et al. (2016) incorporate group-wise penalties, i.e., penalties for continuous-continuous, continuous-discrete and discrete-discrete edges, to account for different performances in edge prediction of linear and logistic regressions (Chen et al., 2014; Sedgewick et al., 2016). To achieve stable model selection under three distinct penalties, they propose a repeated subsampling procedure to determine the total instability of the model (StEPS, Stepwise Edge-specific Penalty Selection). The total instability reflects the average probability for edges to differ between two graphs estimated from subsamples of the data for all values of the penalty parameters. A threshold is applied on the screened regularization parameters such that the least amount of regularization is used to achieve a sparse, stable graph (Liu et al., 2010; Sedgewick et al., 2016).
An alternative to the gLASSO are tree based methods. A random forest model (Breiman, 2001; Hapfelmeier and Ulm, 2013) is built for each variable, using all other variables as predictors, and interactions are inferred by ranking variables according to their importance in explaining the selected variable similar to Meinshausen and Bühlmann (2006). Absence of any distributional assumptions (Huynh-Thu et al., 2010) and their ability to discover non-linear interactions and deal with large variable numbers harbors potential for use in multi-omics or in general mixed settings. Similar to the penalty parameter in the gLASSO, the number of edges to select from the individual models has to be optimized (Huynh-Thu et al., 2010; Fellinghauer et al., 2013), which can be achieved e.g. via Stability Selection (Meinshausen and Bühlmann, 2010) to control the number of false positive edges (Fellinghauer et al., 2013). Recent extensions further allow prior integration via weights included in the variable ranking (e.g., iRafNet, Petralia et al., 2015) or application to large single-cell datasets [e.g., GRNBoost, an extension to GENIE3 (Huynh-Thu et al., 2010) used in the SCENIC workflow (Aibar et al., 2017)].
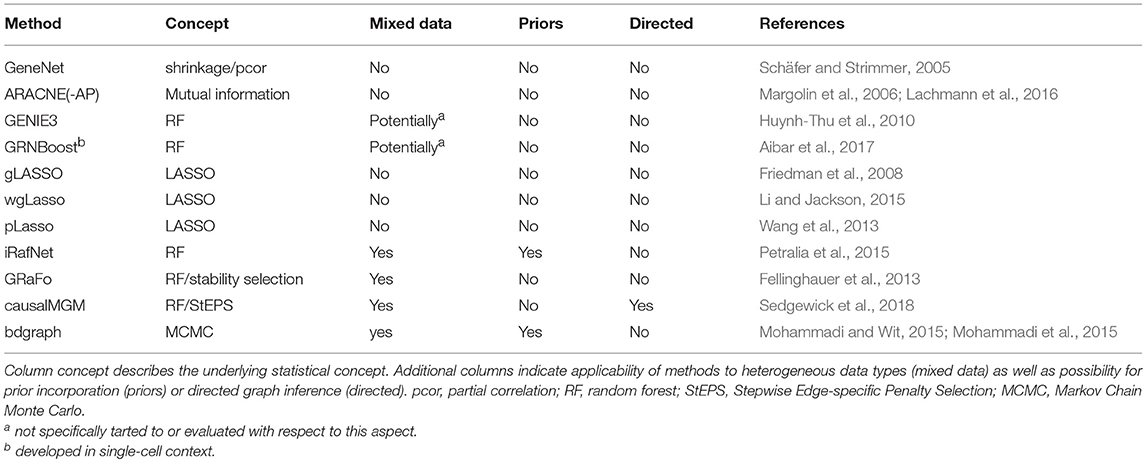
Table 2. List of network inference methods discussed in this review for which implementations are available.
2.4. Bayesian Treatment of Network Inference
A Bayesian approach for GGM estimation and prior incorporation is proposed by Mohammadi and Wit (Mohammadi and Wit, 2015). They estimate Σ−1 (the precision matrix, see Box 1) using a Markov-Chain-Monte-Carlo (MCMC) procedure. In brief, their approach samples from the large space of possible graph configurations (where p is the number of nodes/variables) and seeks the one best fitting the data and corresponding prior information. Their method bdgraph facilitates inclusion of edge-wise priors and extension to graphical copula models (Dobra and Lenkoski, 2011) allows integration of mixed data-types (Mohammadi et al., 2015). In contrast to MGMs, the copula is a semi-parametric approach which does not explicitly model different types of distributions but transfers non-normal variables to a Gaussian space before inferring the network.
While above approaches yield undirected associations and hence the direction of effect cannot be determined from the association, probabilistic Bayesian networks (BN) can be used to establish directed causal networks, e.g. indicating that expression of gene B changes as a result of an expression change of gene A (Zhu et al., 2004). BNs identify the best network by evaluating a likelihood together with prior information (Friedman et al., 2000) for numerous network structures (e.g., via MCMC sampling Zhu et al., 2007; Tasaki et al., 2015), which also allows integration of prior assumptions to guide the reconstruction (Zhu et al., 2007). However, BNs on their own cannot always reliably infer causality and additional evidence, e.g., from genetic data, are needed to infer edge directions, similar to Mendelian Randomization strategies (Zhu et al., 2004, 2007).
3. Heterogeneous Interactomes Using Asynchronous Integration
A simple way to integrate multiple omics data is to analyze pairs of data and integrate results in a step-wise fashion. Genotypes (e.g., SNPs) form the basis of inter-individual variation on the cellular level (Ritchie et al., 2015) and are therefore at the heart of many asynchronous methods. To decipher their mechanism of action, GWAS-SNPs are associated with quantitative molecular traits (quantitative trait loci, QTLs), using for example linear regression models to estimate their effects on mRNA expression (eQTLs), protein abundance (pQTL), DNA methylation (meQTLs), or metabolite levels (mQTLs). Of particular value for investigating regulatory interactions are trans-QTL hotspots: A SNP on one chromosome is associated with numerous traits such as gene expression levels of genes on different chromosomes. In order to explain the genome-wide changes a QTL hotspot variant induces in a cell it is necessary to understand the regulatory relationships giving rise to the observed trans associations.
For instance, trans-eQTLs can be used to analyze the consequences of disease associated SNPs on gene expression as was done by Võsa et al. (2018) (Figure 1). Here, the authors established trans-eQTLs at 3,853 unique SNPs associated to 6,298 unique genes in a large meta-analysis of whole blood data and describe the molecular effects of trans associated SNPs. Probing trans-eQTL loci for TFs encoded at the trans-acting locus and at the same time affected in gene expression locally by the variant along with ChIP-seq derived TF-DNA binding sites (TFBS) lead to an estimated 17.4% of trans-eQTLs whose effects could be explained by direct TF-target interactions. Similarly, for longrange-eQTL (same chromosome, distance ≥100 kb) they infer enhancer-promoter interactions and confirm physical DNA-DNA contacts using capture Hi-C data (Javierre et al., 2016). Following their approach, the authors were able to implicate for example circadian clock related genes with height as a complex trait, a hitherto unsuspected connection.
Bonder et al. interrogated GWAS-SNPs with regard to their impact on DNA methylation and gene expression in whole blood (Bonder et al., 2017). To analyze the influence of methylation on gene expression, they established associations between methylation and expression levels (expression quantitative trait methylation, eQTM) in addition to eQTLs and meQTLs (see Figure 1A). By integrating trans-meQTLs with eQTMs and TFBS from ChIP-seq data, they found disease loci to induce changes in gene expression networks via altered DNA binding of TFs (protein-DNA interactions) and DNA methylation changes (see Figure 1B). In their work, they extracted a novel gene network for a locus associated with ulcerative colitis (SNP rs3774937). They showed how this locus, residing in the first intron of the NFKB1 gene, influences the expression of NFKB1, which in turn affects the methylation at distal CpG sites and further leads to a change in expression of genes close to those sites. Thereby, the authors established the molecular and regulatory interactions between NFKB1, methylation levels at the associated CpG sites and expression levels of the neighboring genes to generate hypotheses about molecular mechanisms underlying disease associations identified in GWAS (see Figure 1E).
Reference interactomes or de-novo gene co-expression networks allow a holistic view on the regulatory context of QTLs (Figure 1C). For example, after establishing trans-pQTLs for GWAS-SNPs, Suhre et al. (2017) connected trans associated traits by building PPI networks from a targeted protein expression assay (Gold et al., 2010) using GeneNet (Schäfer and Strimmer, 2005). They further joined pQTLs and their PPI network by adding genotype-protein edges for all identified pQTLs and contextualized their networks with disease information obtained from GWAS variants. Following this approach, the authors for instance gained novel insights into the molecular mechanisms involved in Alzheimer's disease (AD) by inferring a hitherto unknown link between a major AD risk variant (rs4420638) and splicing related proteins. They propose that a potential mediator of the effect of rs4420638 on a splicing regulator (SNRPF) could be of pharmaceutical interest in order to decrease amyloid precursor protein levels, potentially improving understanding and treatment of AD (Suhre et al., 2017).
4. Synchronous Network Inference From Omics Data
While e.g., Bartel et al. (2015) inferred a transcriptome-metabolome network by step-wise application of the SRCC on all pairs of transcripts and metabolites, recovering known and unknown interactions, using all available data in a single integration step (synchronously) has the potential to boost inference performance by recognizing complementary regulatory information of other variables or omic layers (Petralia et al., 2015). To capture these effects and to make use of established knowledge (e.g., reference interactomes), graphical models often are preferred to pairwise approaches, specifically their extensions for heterogeneous network inference and prior inclusion. In the next three sections we will briefly present applications of synchronous inference methods, covering homogeneous and heterogeneous network inference, as well as prior based inference approaches.
4.1. Homogeneous Network Reconstruction
Krumsiek et al. (2011) used a large metabolite dataset on which they applied a GGM based approach to infer de-novo metabolite reaction networks (see Figure 1C). Although only in a single-omics setting, they were able to demonstrate the added benefit of using network based inference as compared to pairwise approaches: by comparing their inferred network to known metabolic reactions as a reference interactome (e.g., from KEGG, see Table 1), they were able to propose additional associations (Figure 1D) between lipid metabolites which had so far only indirectly been associated in the reference.
With the advance of single-cell experiments, recent studies seek to make use of their favorable statistical properties (e.g., large sample sizes) in association analyses. Specifically, single-cell protocols have been proposed to assess multiple regulatory layers in individual cells (e.g., scNMT-seq Clark et al., 2018, sciCAR Cao et al., 2018, or scCAT-seq Liu et al., 2019). However, these data come with their own challenges such as dropout effects, large number of missing values and technical variation, which have to be overcome to use them to their full potential (Colomé-Tatché and Theis, 2018).
Aibar et al. (2017) for example proposed the single-cell regulatory network inference and clustering (SCENIC) workflow to map gene regulatory networks in single-cell data and identify stable cell states of individual cells based on common regulatory subnetworks. The authors seek to overcome general limitations of single-cell data by integrating cis-regulatory sequence analysis with single-cell gene expression data and provide an extension to GENIE3 (Huynh-Thu et al., 2010), GRNBoost, which scales favorably with respect to computation time in large (single-cell) datasets.
In another study, Pliner et al. used a gLASSO based approach (CICERO) to identify co-accessibility regions from single-cell ATAC-seq data (Pliner et al., 2018). Those regions represent distal regulatory elements that interact with DNA regulatory elements at the promoters of the respective target genes. Comparison of their results with physical interactions measured using promoter-capture Hi-C (Cairns et al., 2016) showed a strong overlap, suggesting physical interactions between the co-accessibility regions detected through their network inference approach. Similar regulatory inference can be performed based on scCAT-seq as the authors demonstrated by example of inferring regulatory relationships between accessible chromatin regions and expression of putative target genes (Liu et al., 2019).
4.2. Inference of Heterogeneous Networks
Saha et al. (2017) used GTEx gene expression data to infer transcriptome-wide (TWNs) and tissue-specific (TSN) networks using GGMs (Hsieh et al., 2013). Using RNA-seq data, the authors define a heterogeneous network containing total expression (TE) or isoform ratio (IR) nodes, enabling the investigation of splicing control mechanisms e.g., by observing TE-IR edges indicating potential splicing regulators. They further constructed different L1 penalties for distinct edge types (TE-TE, TE-IR, or IR-IR) to encode prior assumptions for their occurrence (similar to Sedgewick et al., 2016). With their strategy, the authors were able to recover known (e.g., RBM14, PPP1R10) and propose novel (e.g., TMEM160) splicing regulators across different tissues as well as pinpoint tissue-specific regulators such as TTC36 in breast-mammary tissue which could be essential to unravel disease related regulatory mechanisms. For example, they identified MAGHO and MAB21L1 as hub genes (i.e., strongly connected genes) in brain-caudate and artery-aorta specific TSNs, respectively. Both genes have been found to play an important role in tissue-specific transcription regulation and are known to be crucial for the development of their TSN's respective organs.
Due to the relatively novel idea of using multi-omics data for heterogeneous network inference, MGM applications are mostly limited to proof of concept studies with simulated data (Lee and Hastie, 2013; Haslbeck and Waldorp, 2016). Although MGMs have been shown to perform well, further investigations are needed to demonstrate their usefulness in real-world contexts.
An interesting line of work in this direction is the inclusion of phenotype information. The tree based method proposed in Fellinghauer et al. (2013) (graphical random forests, GRaFo), for example, was used in a multi-omics study by Zierer et al. to evaluate age related disease comorbidities (Zierer et al., 2016) and their dependencies on molecular traits from transcriptomics, metabolomics, epigenomics, and glycomics. Here, the authors established a heterogeneous network and identified for example urate as a key factor linking metabolic syndrome phenotypes to renal function and body composition.
Another line of work with respect to the application of graphical models in disease contexts is given by Mohammadi et al. (2015). In their study of Dupuytren disease (a disease affecting finger contractures), the authors apply their extended bdgraph approach to model indicators and severity of the disease together with 13 different potential risk factors. Although Mohammadi and colleagues did not use omics data in their case study, they demonstrate the possibilities of heterogeneous network inference to elucidate disease pathogenesis: They affirmed a possible genetic risk for the disease as well as identify key phenotypic factors, such as age and alcohol consumption, which have a direct impact on the severity of Dupuytren disease. They further found that the severity of the disease is correlated for individual fingers and proposed to perform surgical measures simultaneously for both the ring and the middle finger as an improved therapy as compared to treating them independently.
4.3. Leveraging Biological Prior Knowledge for Network Reconstruction
Given the broad availability of reference interactomes, a significant amount of work focused on using them to improve network reconstruction. These works guide network inference by setting weights on specific edges, e.g. generated by combining reference interactomes with omics data (Figures 1B,D).
Wang et al. (pLasso) and Li and Jackson (wgLasso) use reference interactomes in an adjusted LASSO and gLASSO context (Wang et al., 2013; Li and Jackson, 2015). Wang et al. (2013) extracted interaction networks from KEGG and the Pathway Commons database (see Table 1) to define distinct penalties for prior and non-prior edges, i.e., nodes linked or not linked in the reference network, respectively. Li and Jackson (2015) showed that using priors in wgLasso outperforms the regular gLASSO on simulated data as well as real-world gene expression data from Arabidopsis thaliana compared to a reference of annotated gene pathways (Lee et al., 2010) in terms of the Matthew's Correlation Coefficient (MCC).
MGM based methodologies have also been extended to incorporate prior information. For example, Manatakis et al. (2018) proposed prior incorporation Mixed Graphical Models (piMGM), an extension to CausalMGM (Sedgewick et al., 2016, 2018). piMGM independently applies CausalMGM for a set of regularization parameters on a random partition of samples and assembles the final graph by aggregating all generated models. This method encourages specific network edges via incorporation of pathway knowledge similar to pLasso and wgLasso. They evaluated their approach via breast cancer subtype prediction in TCGA RNA-seq and cancer subtype data with priors derived from KEGG pathways and were able to recover known pathways (e.g., the Notch signaling pathway) as well as determine the parts of the pathways most important to breast cancer subtyping. In addition, they affirmed a possible role of other pathways, such as the insulin signaling pathway or T cell receptor signaling, as an important part in determining cancer subtypes.
Petralia et al. (2015) applied iRafNet on test data from two “Dialogue for Reverse Engineering Assessments and Methods” (DREAM4/5) challenges (Greenfield et al., 2010; Marbach et al., 2012) and used prior information obtained from time-series gene expression and knockout data in addition to PPIs to infer regulatory networks. They demonstrate improved performance as compared to GENIE3 (which does not utilize prior information) in terms of Area Under the receiver operator characteristic Curve (AUC) and Area Under the Precision Recall Curve (AUPRC) (Petralia et al., 2015). However, as for GENIE3, this approach has not yet been applied to mixed data types.
Finally, Zhu et al. (2008) derived directed yeast regulatory networks with a BN approach. Using a modified MCMC strategy (Friedman et al., 2000; Zhu et al., 2004), they inferred a causal consensus network from 1,000 sampled networks (edges present in ≥30% of the networks) and determined edge directions by including PPI, TFBS, and eQTL information as priors. They used gene knockout data to demonstrate the predictive power of their network in determining the downstream effects of systematic changes in the biological system. Their study lead to the prediction of novel gene interactions, complementing existing yeast PPI databases, as well as pinpointing novel causal drivers of yeast eQTL hotspots. Strikingly, they were able to confirm their computationally derived interaction predictions by using previous experimental findings and hence showcase the predictive power of their approach. For instance, they identified AMN1, a gene implicated in yeast daughter cell separation, as a causal transcriptional regulator based on one of their eQTL hotspots, a discovery made in experimental screens by Yvert et al. (2003).
5. Conclusion
To understand disease causing molecular processes, systems biology studies seek to establish molecular interaction networks or interactomes. Numerous methods have been developed for contextualizing reference interactomes from large databases and to pinpoint interactions important in disease with the help of multi-omics data.
While many studies perform step-wise data integration, relatively few studies follow synchronous integration strategies for constructing homogeneous or heterogeneous networks, which could exploit omics data to their full potential and therefore are representing promising tools to unravel complex cellular processes.
Methods previously used for constructing homogeneous networks (e.g., GENIE3, Huynh-Thu et al., 2010, for gene expression data) could be applied to multi-omics data to infer heterogeneous networks, however, additional evaluation and benchmarks are required. Yet, as the top performer in two DREAM challenges (DREAM4/5, Greenfield et al., 2010; Marbach et al., 2012), GENIE3 and, more generally, tree based methods represent a promising basis for multi-omics network inference.
Most recent methods implement variations of the graphical LASSO to predict conditional dependence networks from experimental data (Meinshausen and Bühlmann, 2006; Friedman et al., 2008). Additionally, methods like wgLasso, piMGM, iRafNet, and bdgraph can utilize prior knowledge to guide the inference process. With these methods, large public databases containing massive multi-omics data represent important assets for network inference and to contextualize reference interactomes.
To date only few studies make use of these independent data (e.g., Li and Jackson, 2015; Sedgewick et al., 2018) and current methods such as iRafNet and piMGM) need to be adjusted and applied to new biological contexts to make full use of their potential. An interesting challenge with respect to including prior information in computational models, for example, is to make the plethora of available biological data accessible to such methods, i.e., to create data driven priors not only relying on available PPI databases but making use of further data such as available chromatin conformation data, DNA accessibility or other biological knowledge.
Moreover, novel experimental protocols such as scNMT-seq (single-cell nucleosome, methylation and transcription sequencing) (Clark et al., 2018), sciCAR (Cao et al., 2018), or scCAT-seq (Liu et al., 2019) allow for simultaneously probing multiple molecular layers in hundreds of individual cells. Such new methods, and in general the development of single-cell techniques, pave exciting new avenues for the analysis of cell-type specific networks and initial studies show promising results (Moignard et al., 2015; Aibar et al., 2017; Pliner et al., 2018). Nevertheless, methods have to be further adapted to be able to cope with single-cell contexts, e.g., to take into account dropout effects and differing noise properties (Colomé-Tatché and Theis, 2018).
In addition to the methods discussed above, protocols to directly measure interacting molecules from biological samples are steadily improving. More reliable experimental protocols to e.g., measure protein-metabolite interactions (Piazza et al., 2018) or to establish genome-wide protein-RNA interactions (Van Nostrand et al., 2016) could improve reference interactome quality, in turn alleviating reconstruction of context-specific interactomes.
Finally, other strategies for network based integration of molecular data such as methods implementing network diffusion (e.g., Dimitrakopoulos et al., 2018) or network embedding (e.g., Perozzi et al., 2017) could be used to complement network inference efforts and have in fact been shown to improve the predictive performance of biomedical networks (Su et al., 2018). Indeed, some methods (e.g., by Kuchaiev et al., 2009) can even be used to refine (de-noise) reference interactomes and predict novel interactions (not part of this review). However, most such methods rely heavily on established molecular networks, making initial network creation a crucial step for their successful application.
Author Contributions
JH, FT, and MH wrote the manuscript.
Conflict of Interest Statement
The authors declare that the research was conducted in the absence of any commercial or financial relationships that could be construed as a potential conflict of interest.
Acknowledgments
The authors would like to thank Jan Krumsiek for valuable discussion and feedback. FT acknowledges financial support by the German Research Foundation (DFG) within the Collaborative Research Centre 1243, Subproject A17 and by the Helmholtz Association (Incubator grant sparse2big, ZT-I-0007). MH gratefully acknowledges funding by the Federal Ministry of Education and Research (BMBF, Germany) in the projects eMed:symAtrial (01ZX1408D) and eMed:confirm (01ZX1708G).
References
Aguet, F., Brown, A. A., Castel, S. E., Davis, J. R., He, Y., Jo, B., et al. (2017). Genetic effects on gene expression across human tissues. Nature 550, 204–213. doi: 10.1038/nature24277
Aibar, S., González-Blas, C. B., Moerman, T., Huynh-Thu, V. A., Imrichova, H., Hulselmans, G., et al. (2017). SCENIC: single-cell regulatory network inference and clustering. Nat. Methods 14, 1083–1086. doi: 10.1038/nmeth.4463
Albert, F. W., and Kruglyak, L. (2015). The role of regulatory variation in complex traits and disease. Nat. Rev. Genet. 16, 197–212. doi: 10.1038/nrg3891
Alonso-Lopez, D., Gutierrez, M. A., Lopes, K. P., Prieto, C., Santamaria, R., and De Las Rivas, J. (2016). APID interactomes: providing proteome-based interactomes with controlled quality for multiple species and derived networks. Nucleic Acids Res. 44, W529–W535. doi: 10.1093/nar/gkw363
Baba, K., Shibata, R., and Sibuya, M. (2004). Partial correlation and conditional correlation as measures of conditional independence. Aust. N. Z. J. Stat. 46, 657–664. doi: 10.1111/j.1467-842X.2004.00360.x
Banerjee, O., Ghaoui, L. E., and D'Aspremont, A. (2007). Model selection through sparse maximum likelihood estimation. J. Mach. Learn. Res. 9, 485–516. doi: 10.1093/rfs/hht062
Barrett, T., Wilhite, S. E., Ledoux, P., Evangelista, C., Kim, I. F., Tomashevsky, M., et al. (2013). NCBI GEO: archive for functional genomics data sets–update. Nucleic Acids Res. 41, D991–D995. doi: 10.1093/nar/gks1193
Bartel, J., Krumsiek, J., Schramm, K., Adamski, J., Gieger, C., Herder, C., et al. (2015). The human blood metabolome-transcriptome interface. PLOS Genet. 11:e1005274. doi: 10.1371/journal.pgen.1005274
Belton, J. M., McCord, R. P., Gibcus, J. H., Naumova, N., and Zhan, Y. (2012). Hi–C: a comprehensive technique to capture the conformation of genomes. Methods 58, 268–276. doi: 10.1016/J.YMETH.2012.05.001
Blin, K., Dieterich, C., Wurmus, R., Rajewsky, N., Landthaler, M., and Akalin, A. (2015). DoRiNA 2.0–upgrading the doRiNA database of RNA interactions in post-transcriptional regulation. Nucleic Acids Res. 43, D160–D167. doi: 10.1093/nar/gku1180
Bonder, M. J., Luijk, R., Zhernakova, D. V., Moed, M., Deelen, P., Vermaat, M., et al. (2017). Disease variants alter transcription factor levels and methylation of their binding sites. Nat. Genet. 49, 131–138. doi: 10.1038/ng.3721
Brückner, A., Polge, C., Lentze, N., Auerbach, D., and Schlattner, U. (2009). Yeast two-hybrid, a powerful tool for systems biology. Int. J. Mol. Sci. 10, 2763–2788. doi: 10.3390/ijms10062763
Cairns, J., Freire-Pritchett, P., Wingett, S. W., Várnai, C., Dimond, A., Plagnol, V., et al. (2016). CHiCAGO: robust detection of DNA looping interactions in Capture Hi-C data. Genome Biol. 17:127. doi: 10.1186/s13059-016-0992-2
Cao, J., Cusanovich, D. A., Ramani, V., Aghamirzaie, D., Pliner, H. A., Hill, A. J., et al. (2018). Joint profiling of chromatin accessibility and gene expression in thousands of single cells. Science 361, 1380–1385. doi: 10.1126/science.aau0730
Carithers, L. J., Ardlie, K., Barcus, M., Branton, P. A., Britton, A., Buia, S. A., et al. (2015). A novel approach to high-quality postmortem tissue procurement: the gtex project. Biopreserv. Biobank. 13, 311–319. doi: 10.1089/bio.2015.0032
Celniker, S. E., Dillon, L. A. L., Gerstein, M. B., Gunsalus, K. C., Henikoff, S., Karpen, G. H., et al. (2009). Unlocking the secrets of the genome. Nature 459, 927–930. doi: 10.1038/459927a
Cerami, E. G., Gross, B. E., Demir, E., Rodchenkov, I., Babur, O., Anwar, N., et al. (2011). Pathway Commons, a web resource for biological pathway data. Nucleic Acids Res. 39, D685–D690. doi: 10.1093/nar/gkq1039
Chen, S., Witten, D. M., and Shojaie, A. (2014). Selection and estimation for mixed graphical models. Biometrika 102, 47–64. doi: 10.1093/biomet/asu051
Chèneby, J., Gheorghe, M., Artufel, M., Mathelier, A., and Ballester, B. (2018). ReMap 2018: an updated atlas of regulatory regions from an integrative analysis of DNA-binding ChIP-seq experiments. Nucleic Acids Res. 46, D267–D275. doi: 10.1093/nar/gkx1092
Clark, S. J., Argelaguet, R., Kapourani, C. A., Stubbs, T. M., Lee, H. J., Alda-Catalinas, C., et al. (2018). scNMT-seq enables joint profiling of chromatin accessibility DNA methylation and transcription in single cells. Nat. Commun. 9:781. doi: 10.1038/s41467-018-03149-4
Colomé-Tatché, M., and Theis, F. J. (2018). Statistical single cell multi-omics integration. Curr. Opin. Syst. Biol. 7, 54–59. doi: 10.1016/j.coisb.2018.01.003
Costanzo, M., Baryshnikova, A., Bellay, J., Kim, Y., Spear, E. D., Sevier, C. S., et al. (2010). The genetic landscape of a cell. Science 327, 425–431. doi: 10.1126/science.1180823
De Bodt, S., Theissen, G., and Van de Peer, Y. (2006). Promoter analysis of MADS-Box genes in eudicots through phylogenetic footprinting. Mol. Biol. Evol. 23, 1293–1303. doi: 10.1093/molbev/msk016
Dimitrakopoulos, C., Hindupur, S. K., Häfliger, L., Behr, J., Montazeri, H., Hall, M. N., et al. (2018). Network-based integration of multi-omics data for prioritizing cancer genes. Bioinformatics 34:2441. doi: 10.1093/BIOINFORMATICS/BTY148
Dobra, A., and Lenkoski, A. (2011). Copula Gaussian graphical models and their application to modeling functional disability data. Ann. Appl. Stat. 5, 969–993. doi: 10.1214/10-AOAS397
Edgar, R., Domrachev, M., and Lash, A. E. (2002). Gene expression omnibus: NCBI gene expression and hybridization array data repository. Nucleic Acids Res. 30, 207–210. doi: 10.1093/nar/30.1.207
Engreitz, J. M., Sirokman, K., McDonel, P., Shishkin, A. A., Surka, C., Russell, P., et al. (2014). RNA-RNA interactions enable specific targeting of noncoding RNAs to nascent Pre-mRNAs and chromatin sites. Cell 159, 188–199. doi: 10.1016/j.cell.2014.08.018
Fellinghauer, B., Bühlmann, P., Ryffel, M., Von Rhein, M., and Reinhardt, J. D. (2013). Stable graphical model estimation with Random Forests for discrete, continuous, and mixed variables. Comput. Stat. Data Anal. 64, 132–152. doi: 10.1016/j.csda.2013.02.022
Friedman, J., Hastie, T., and Tibshirani, R. (2001). The Elements of Statistical Learning, Vol. 1. New York, NY: Springer series in statistics.
Friedman, J., Hastie, T., and Tibshirani, R. (2008). Sparse inverse covariance estimation with the graphical lasso. Biostatistics 9, 432–441. doi: 10.1093/biostatistics/kxm045
Friedman, N., Linial, M., Nachman, I., and Pe'er, D. (2000). Using Bayesian networks to analyze expression data. J. Comput. Biol. 7, 601–620. doi: 10.1089/106652700750050961
Gold, L., Ayers, D., Bertino, J., Bock, C., Bock, A., Brody, E. N., et al. (2010). Aptamer-based multiplexed proteomic technology for biomarker discovery. PLoS ONE 5:e15004. doi: 10.1371/journal.pone.0015004
Greenfield, A., Madar, A., Ostrer, H., and Bonneau, R. (2010). Dream4: combining genetic and dynamic information to identify biological networks and dynamical models. PLoS ONE 5:e13397. doi: 10.1371/journal.pone.0013397
Hapfelmeier, A., and Ulm, K. (2013). A new variable selection approach using random forests. Comput. Stat. Data Anal. 60, 50–69. doi: 10.1016/j.csda.2012.09.020
Haslbeck, J. M., and Waldorp, L. J. (2016). mgm: estimating time-varying mixed graphical models in high-dimensional data. arXiv: 1510.06871 [Preprint].
Haug, K., Salek, R. M., Conesa, P., Hastings, J., de Matos, P., Rijnbeek, M., et al. (2013). MetaboLights–an open-access general-purpose repository for metabolomics studies and associated meta-data. Nucleic Acids Res. 41, D781–D786. doi: 10.1093/nar/gks1004
Hosp, F., Vossfeldt, H., Heinig, M., Vasiljevic, D., Arumughan, A., Wyler, E., et al. (2015). Quantitative interaction proteomics of neurodegenerative disease proteins. Cell Rep. 11, 1134–1146. doi: 10.1016/J.CELREP.2015.04.030
Hsieh, C.-J., Sustik, M. A., Dhillon, I. S., and Ravikumar, P. (2013). “Sparse inverse covariance matrix estimation using quadratic approximation,” in Neural Information Processing Systems 2011, 1–9.
Huang, S., Chaudhary, K., and Garmire, L. X. (2017). More is better: recent progress in multi-omics data integration methods. Front. Genet. 8:84. doi: 10.3389/fgene.2017.00084
Huynh-Thu, V. A., Irrthum, A., Wehenkel, L., and Geurts, P. (2010). Inferring regulatory networks from expression data using tree-based methods. PLoS ONE 5:e12776. doi: 10.1371/journal.pone.0012776
Ideker, T., Galitski, T., and Hood, L. (2001). A new approach to decoding life : systems biology. Annu. Rev. Genomics Hum. Genet. 2, 343–372. doi: 10.1146/annurev.genom.2.1.343
Javierre, B. M., Burren, O. S., Wilder, S. P., Kreuzhuber, R., Hill, S. M., Sewitz, S., et al. (2016). Lineage-specific genome architecture links enhancers and non-coding disease variants to target gene promoters. Cell 167, 1369–1384.e19. doi: 10.1016/j.cell.2016.09.037
Johnson, D. S., Mortazavi, A., Myers, R. M., and Wold, B. (2007). Genome-wide mapping of in vivo protein-DNA interactions. Science 316, 1497–1502. doi: 10.1126/science.1141319
Kanehisa, M., and Goto, S. (2000). KEGG: Kyoto encyclopedia of genes and genomes. Nucleic Acids Res. 28, 27–30. doi: 10.1093/nar/28.1.27
Krumsiek, J., Suhre, K., Evans, A. M., Mitchell, M. W., Mohney, R. P., Milburn, M. V., et al. (2012). Mining the unknown: a systems approach to metabolite identification combining genetic and metabolic information. PLoS Genet. 8:e1003005. doi: 10.1371/journal.pgen.1003005
Krumsiek, J., Suhre, K., Illig, T., Adamski, J., and Theis, F. J. (2011). Gaussian graphical modeling reconstructs pathway reactions from high-throughput metabolomics data. BMC Syst. Biol. 5:21. doi: 10.1186/1752-0509-5-21
Kuchaiev, O., Rašajski, M., Higham, D. J., and Pržulj, N. (2009). Geometric de-noising of protein-protein interaction networks. PLoS Comput. Biol. 5:e1000454. doi: 10.1371/journal.pcbi.1000454
Lachmann, A., Giorgi, F. M., Lopez, G., and Califano, A. (2016). ARACNe-AP: gene network reverse engineering through adaptive partitioning inference of mutual information. Bioinformatics 32, 2233–2235. doi: 10.1093/bioinformatics/btw216
Lachmann, A., Torre, D., Keenan, A. B., Jagodnik, K. M., Lee, H. J., Wang, L., et al. (2018). Massive mining of publicly available RNA-seq data from human and mouse. Nat. Commun. 9:1366. doi: 10.1038/s41467-018-03751-6
Langfelder, P., and Horvath, S. (2008). WGCNA: an R package for weighted correlation network analysis. BMC Bioinformatics 9:559. doi: 10.1186/1471-2105-9-559
Lee, I., Ambaru, B., Thakkar, P., Marcotte, E. M., and Rhee, S. Y. (2010). Rational association of genes with traits using a genome-scale gene network for Arabidopsis thaliana. Nat. Biotechnol. 28, 149–156. doi: 10.1038/nbt.1603
Lee, J., and Hastie, T. (2013). Structure learning of mixed graphical models. Aistats 16 31, 388–396. doi: 10.1080/10618600.2014.900500
Li, T., Wernersson, R., Hansen, R. B., Horn, H., Mercer, J., Slodkowicz, G., et al. (2017). A scored human protein-protein interaction network to catalyze genomic interpretation. Nat. Methods 14, 61–64. doi: 10.1038/nmeth.4083
Li, Y., and Jackson, S. A. (2015). Gene network reconstruction by integration of prior biological knowledge. G3 (Bethesda) 5, 1075–1079. doi: 10.1534/g3.115.018127
Licatalosi, D. D., Mele, A., Fak, J. J., Ule, J., Kayikci, M., Chi, S. W., et al. (2008). HITS-CLIP yields genome-wide insights into brain alternative RNA processing. Nature 456, 464–469. doi: 10.1038/nature07488
Liu, H., Roeder, K., and Wasserman, L. (2010). “Stability approach to regularization selection (StARS) for high dimensional graphical models,” in Neural Information Processing Systems 2010, 1–14.
Liu, L., Liu, C., Quintero, A., Wu, L., Yuan, Y., Wang, M., et al. (2019). Deconvolution of single-cell multi-omics layers reveals regulatory heterogeneity. Nat. Commun. 10:470. doi: 10.1038/s41467-018-08205-7
MacArthur, J., Bowler, E., Cerezo, M., Gil, L., Hall, P., Hastings, E., et al. (2017). The new NHGRI-EBI Catalog of published genome-wide association studies (GWAS Catalog). Nucleic Acids Res. 45, D896–D901. doi: 10.1093/nar/gkw1133
Manatakis, D. V., Raghu, V. K., and Benos, P. V. (2018). piMGM: incorporating multi-source priors in mixed graphical models for learning disease networks. Bioinformatics 34, i848–i856. doi: 10.1093/bioinformatics/bty591
Marbach, D., Costello, J. C., Küffner, R., Vega, N., Prill, R. J., Camacho, D. M., et al. (2012). Wisdom of crowds for robust gene network inference. Nat. Methods 9, 796. doi: 10.1038/NMETH.2016
Marcotte, E. M., Pellegrini, M., Ng, H. L., Rice, D. W., Yeates, T. O., and Eisenberg, D. (1999). Detecting protein function and protein-protein interactions from genome sequences. Science 285, 751–753. doi: 10.1126/science.285.5428.751
Margolin, A. A., Nemenman, I., Basso, K., Wiggins, C., Stolovitzky, G., Dalla Favera, R., et al. (2006). ARACNE: an algorithm for the reconstruction of gene regulatory networks in a mammalian cellular context. BMC Bioinformatics 7(Suppl. 1):S7. doi: 10.1186/1471-2105-7-S1-S7
Meinshausen, N., and Bühlmann, P. (2006). High-dimensional graphs and variable selection with the Lasso. Ann. Stat. 34, 1436–1462. doi: 10.1214/009053606000000281
Meinshausen, N., and Bühlmann, P. (2010). Stability selection. J. R. Stat. Soc. Ser. B Stat. Methodol. 72, 417–473. doi: 10.1111/j.1467-9868.2010.00740.x
Mohammadi, A., Abegaz, F., Heuvel, E. V. D., and Wit, E. C. (2015). Bayesian Gaussian copula graphical modeling for Dupuytren disease. arXiv: 1501.04849 [Preprint].
Mohammadi, A., and Wit, E. C. (2015). Bayesian structure learning in sparse gaussian graphical models. Bayesian Anal. 10, 109–138. doi: 10.1214/14-BA889
Moignard, V., Woodhouse, S., Haghverdi, L., Lilly, A. J., Tanaka, Y., Wilkinson, A. C., et al. (2015). Decoding the regulatory network of early blood development from single-cell gene expression measurements. Nat. Biotechnol. 33, 269–276. doi: 10.1038/nbt.3154
Ocone, A., Haghverdi, L., Mueller, N. S., and Theis, F. J. (2015). Reconstructing gene regulatory dynamics from high-dimensional single-cell snapshot data. Bioinformatics 31, i89–i96. doi: 10.1093/bioinformatics/btv257
Orchard, S., Ammari, M., Aranda, B., Breuza, L., Briganti, L., Broackes-Carter, F., et al. (2014). The MIntAct project–IntAct as a common curation platform for 11 molecular interaction databases. Nucleic Acids Res. 42, D358–D363. doi: 10.1093/nar/gkt1115
Palsson, B., and Zengler, K. (2010). The challenges of integrating multi-omic data sets. Nat. Chem. Biol. 6, 787–789. doi: 10.1038/nchembio.462
Perozzi, B., Kulkarni, V., Chen, H., and Skiena, S. (2017). “Don't Walk, Skip!: online learning of multi-scale network embeddings,” in Proceedings of the 2017 IEEE/ACM International Conference on Advances in Social Networks Analysis and Mining 2017 (ACM), 258–265.
Petralia, F., Wang, P., Yang, J., and Tu, Z. (2015). Integrative random forest for gene regulatory network inference. Bioinformatics 31, i197–i205. doi: 10.1093/bioinformatics/btv268
Piazza, I., Kochanowski, K., Cappelletti, V., Fuhrer, T., Noor, E., Sauer, U., et al. (2018). A map of protein-metabolite interactions reveals principles of chemical communication. Cell 172, 358–372.e23. doi: 10.1016/j.cell.2017.12.006
Pliner, H. A., Packer, J. S., McFaline-Figueroa, J. L., Cusanovich, D. A., Daza, R. M., Aghamirzaie, D., et al. (2018). Cicero predicts cis-regulatory DNA interactions from single-cell chromatin accessibility data. Mol. Cell 71, 858–871.e8. doi: 10.1016/J.MOLCEL.2018.06.044
Ritchie, M. D., Holzinger, E. R., Li, R., Pendergrass, S. A., and Kim, D. (2015). Methods of integrating data to uncover genotype–phenotype interactions. Nat. Rev. Genet. 16, 85–97. doi: 10.1038/nrg3868
Roadmap Epigenomics Consortium (2015). Integrative analysis of 111 reference human epigenomes. Nature 518, 317–330. doi: 10.1038/nature14248
Saha, A., Kim, Y., Gewirtz, A. D. H., Jo, B., Gao, C., McDowell, I. C., et al. (2017). Co-expression networks reveal the tissue-specific regulation of transcription and splicing. Genome Res. 27, 1843–1858. doi: 10.1101/gr.216721.116
Schäfer, J., and Strimmer, K. (2005). An empirical bayes approach to inferring large-scale gene association networks. Bioinformatics 21, 754–764. doi: 10.1093/bioinformatics/bti062
Sedgewick, A. J., Buschur, K., Shi, I., Ramsey, J. D., Raghu, V. K., Manatakis, D. V., et al. (2018). Mixed graphical models for integrative causal analysis with application to chronic lung disease diagnosis and prognosis. Bioinformatics 35, 1204–1212. doi: 10.1093/bioinformatics/bty769
Sedgewick, A. J., Shi, I., Donovan, R. M., and Benos, P. V. (2016). Learning mixed graphical models with separate sparsity parameters and stability-based model selection. BMC Bioinformatics 17:S175. doi: 10.1186/s12859-016-1039-0
Song, L., Langfelder, P., and Horvath, S. (2012). Comparison of co-expression measures: mutual information, correlation, and model based indices. BMC Bioinformatics 13:328. doi: 10.1186/1471-2105-13-328
Stark, C., Breitkreutz, B. J., Reguly, T., Boucher, L., Breitkreutz, A., and Tyers, M. (2006). BioGRID: a general repository for interaction datasets. Nucleic Acids Res. 34, D535–D539. doi: 10.1093/nar/gkj109
Su, C., Tong, J., Zhu, Y., Cui, P., and Wang, F. (2018). Network embedding in biomedical data science. Brief. Bioinform. 1–16. doi: 10.1093/bib/bby117. [Epub ahead of print].
Suhre, K., Arnold, M., Bhagwat, A. M., Cotton, R. J., Engelke, R., Raffler, J., et al. (2017). Connecting genetic risk to disease end points through the human blood plasma proteome. Nat. Commun. 8:14357. doi: 10.1038/ncomms14357
Szklarczyk, D., Franceschini, A., Wyder, S., Forslund, K., Heller, D., Huerta-Cepas, J., et al. (2015). STRING v10: protein-protein interaction networks, integrated over the tree of life. Nucleic Acids Res. 43, D447–D452. doi: 10.1093/nar/gku1003
Tasaki, S., Sauerwine, B., Hoff, B., Toyoshiba, H., Gaiteri, C., and Chaibub Neto, E. (2015). Bayesian network reconstruction using systems genetics data: Comparison of mcmc methods. Genetics 199, 973–989. doi: 10.1534/genetics.114.172619
The ENCODE Project Consortium (2012). An integrated encyclopedia of DNA elements in the human genome. Nature 489, 57–74. doi: 10.1038/nature11247
Thul, P. J., Åkesson, L., Wiking, M., Mahdessian, D., Geladaki, A., Ait Blal, H., et al. (2017). A subcellular map of the human proteome. Science 356:eaal3321. doi: 10.1126/science.aal3321
Van Nostrand, E. L., Pratt, G. A., Shishkin, A. A., Gelboin-Burkhart, C., Fang, M. Y., Sundararaman, B., et al. (2016). Robust transcriptome-wide discovery of RNA-binding protein binding sites with enhanced CLIP (eCLIP). Nat. Methods 13, 508–514. doi: 10.1038/nmeth.3810
Võsa, U., Claringbould, A., Westra, H. J., Bonder, M. J., Deelen, P., Zeng, B., et al. (2018). Unraveling the polygenic architecture of complex traits using blood eQTL meta-analysis. bioRxiv 447367 [Preprint]. doi: 10.1101/447367
Wang, Z., Xu, W., Lucas, F. A., and Liu, Y. (2013). Incorporating prior knowledge into Gene Network Study. Bioinformatics 29, 2633–2640. doi: 10.1093/bioinformatics/btt443
Weinstein, J. N., Collisson, E. A., Mills, G. B., Shaw, K. R., Ozenberger, B. A., Ellrott, K., et al. (2013). The Cancer Genome Atlas Pan-Cancer analysis project. Nat. Genet. 45, 1113–1120. doi: 10.1038/ng.2764
Yilmaz, A., Mejia-Guerra, M. K., Kurz, K., Liang, X., Welch, L., and Grotewold, E. (2011). AGRIS: the Arabidopsis gene regulatory information server, an update. Nucleic Acids Res. 39, D1118–D1122. doi: 10.1093/nar/gkq1120
Yvert, G., Brem, R. B., Whittle, J., Akey, J. M., Foss, E., Smith, E. N., et al. (2003). Trans-acting regulatory variation in Saccharomyces cerevisiae and the role of transcription factors. Nat. Genet. 35, 57–64. doi: 10.1038/ng1222
Zhang, B., and Horvath, S. (2005). A general framework for weighted gene co-expression network analysis. Stat. Appl. Genet. Mol. Biol. 4. doi: 10.2202/1544-6115.1128
Zhu, J., Lum, P., Lamb, J., GuhaThakurta, D., Edwards, S., Thieringer, R., et al. (2004). An integrative genomics approach to the reconstruction of gene networks in segregating populations. Cytogenet. Genome Res. 105, 363–374. doi: 10.1159/000078209
Zhu, J., Wiener, M. C., Zhang, C., Fridman, A., Minch, E., Lum, P. Y., et al. (2007). Increasing the power to detect causal associations by combining genotypic and expression data in segregating populations. PLoS Comput. Biol. 3:e69. doi: 10.1371/journal.pcbi.0030069
Zhu, J., Zhang, B., Drees, B., Brem, R., Kruglyak, L., Bumgarner, R., et al. (2008). Integrating large-scale functional genomic data to dissect the complexity of yeast regulatory networks. Nat. Genet. 40, 854–861. doi: 10.1038/ng.167
Keywords: systems biology, genomics, prior information, machine learning, personalized medicine, data integration, single cell, mixed data
Citation: Hawe JS, Theis FJ and Heinig M (2019) Inferring Interaction Networks From Multi-Omics Data. Front. Genet. 10:535. doi: 10.3389/fgene.2019.00535
Received: 01 April 2019; Accepted: 16 May 2019;
Published: 12 June 2019.
Edited by:
Rob Ewing, University of Southampton, United KingdomReviewed by:
Marco Vanoni, University of Milano-Bicocca, ItalyAndreas Zanzoni, INSERM U1090 Technologies Avancées pour le Génome et la Clinique, France
Copyright © 2019 Hawe, Theis and Heinig. This is an open-access article distributed under the terms of the Creative Commons Attribution License (CC BY). The use, distribution or reproduction in other forums is permitted, provided the original author(s) and the copyright owner(s) are credited and that the original publication in this journal is cited, in accordance with accepted academic practice. No use, distribution or reproduction is permitted which does not comply with these terms.
*Correspondence: Matthias Heinig, matthias.heinig@helmholtz-muenchen.de