 Zhihui Wang
 Dongxin Huai
 Zhaohua ZhangKe ChengYanping Kang
 Liyun WanLiying Yan
 Huifang Jiang
 Yong Lei*
 Boshou Liao*
- Key Laboratory of Biology and Genetic Improvement of Oil Crops, Ministry of Agriculture, Oil Crops Research Institute of the Chinese Academy of Agricultural Sciences, Wuhan, China
High-density genetic maps (HDGMs) are very useful for genomic studies and quantitative trait loci (QTL) mapping. However, the low frequency of DNA polymorphisms in peanut has limited the quantity of available markers and hindered the construction of a HDGM. This study generated a peanut genetic map with the highest number of high-quality SNPs based on specific locus amplified fragment sequencing (SLAF-seq) technology and a newly constructed RIL population (“ZH16” × “sd-H1”). The constructed HDGM included 3,630 SNP markers belonging to 2,636 bins on 20 linkage groups (LGs), and it covers 2,098.14 cM in length, with an average marker distance of 0.58 cM. This HDGM was applied for the following collinear comparison, scaffold anchoring and analysis of genomic characterization including recombination rates and segregation distortion in peanut. For QTL mapping of investigated 14 yield-related traits, a total of 62 QTLs were detected on 12 chromosomes across 3 environments, and the co-localization of QTLs was observed for these traits which were significantly correlated on phenotype. Two stable co-located QTLs for seed- and pod-related traits were significantly identified in the chromosomal end of B06 and B07, respectively. The construction of HDGM and QTL analysis for yield-related traits in this study provide useful information for fine mapping and functional analysis of genes as well as molecular marker-assisted breeding.
Introduction
Peanut (Arachis hypogaea L., 2n = 20) is an economically important oilseed crop that is cultivated worldwide and it is one of the major grain legumes in tropical and subtropical regions. It is widely grown in over 100 countries, and has the global annual production of 42.4 Mt and area of 25.7 Mha in 2014 (http://faostat.fao.org/). However, increased global demand for production presents a challenge for peanut breeders to increase their yield. It is essential to conduct peanut breeding and genetic studies, such as linkage mapping or association analysis-based trait mapping, marker-assisted selection (MAS) breeding, and map-based gene cloning. For these studies, the density of the genetic map is very important because it provides a foundation for quantitative trait loci (QTL) mapping and further identification of genes of interest (Petroli et al., 2012; Song et al., 2012).
Great efforts have been made to construct peanut genetic maps using different types of molecular markers. Initial genetic maps were mainly developed based on the first generation molecular markers including random amplified polymorphic DNA (RAPD) (Hilu and Stalker, 1995), restriction fragment length polymorphism (RFLP) (Halward et al., 1993, 2011) and amplified fragment length polymorphism (AFLP) (He and Prakash, 1997; Tallury et al., 2005). These genetic maps commonly have low marker density with total marker numbers < 200. Subsequently, microsatellite markers have emerged as preferred DNA marker for conducting genetic and genomic studies in cultivated peanut. Varshney et al. (2009) published the first SSR-based genetic linkage map with 135 loci on 22 linkage groups spanning 1,271 cM. Later, Hong et al. (2010) mapped 175 SSR markers in 22 linkage groups developed from three cultivated crosses. Gautami et al. (2012) developed a consensus map with 293 SSR loci covering 2,840.8 cM based on two RIL populations. Qin et al. (2012) constructed two individual genetic maps with 236 and 172 marker loci, respectively, and then integrated them into a consensus map with 324 marker loci covering 1,352 cM genetic distance. Wang et al. (2012) constructed a genetic map with a total of 318 SSR markers covering 1,674.4 cM based on BAC-end sequences (BES). Shirasawa et al. (2012) created the high density SSR-based map of a single population of cultivated peanut, which generated 21 linkage groups covering 2,166.4 cM with 1,114 loci. Recently, Huang et al. (2016) constructed a high density linkage map with 1,219 SSR loci covering total map length of 2,038.75 cM.
Unfortunately, developing molecular markers in peanut has become labor-consuming and time-costing because cultivated peanut inherently has a very low frequency for DNA polymorphisms (Pandey et al., 2012; Varshney et al., 2013). For example, among nearly 10,000 SSR-based molecular markers, only 14.5% were polymorphic and 6.4% were mapped in peanut (Zhao et al., 2012). Therefore, the discovery of a sufficient number of molecular markers in cultivated peanuts is very challenging. SNP markers exhibit advantages in this case as they owned abundant DNA variations used for genetic markers (Brookes, 1999; Liao and Lee, 2010). Nagy et al. (2012) established a HDGM with 1,724 EST-SNP markers spanning 1,081.3 cM over 10 linkage groups in diploid species A. duranensis. Bertioli et al. (2014) used a 1,536 GoldenGate SNP assay in diploid and tetraploid RIL mapping populations, and constructed genetic maps containing 384 SNP markers in diploid and 772 SNP markers in tetraploid peanut. Using double-digest restriction-site-associated DNA sequencing (ddRAD-seq) technique and de novo SNP genotyping, we previously developed a SNP-based HDGM containing 1,685 SNPs covering 1,446.7 cM with an average distance of 0.86 cM between adjacent markers (Zhou et al., 2014). Nevertheless, efforts in identifying SNPs and constructing a HDGM in tetraploid peanut are limited due to few HDGMs existed in tetraploid peanut. The release of the draft genome sequence for both ancestral species of cultivated peanut, namely, A. duranensis (A genome) and A. ipaensis (B genome) in 2016 (Bertioli et al., 2016; Chen X. et al., 2016), has facilitated SNP discovery and genotyping.
Similar to restriction-site-associated DNA sequencing (RAD-seq) (Miller et al., 2007), ddRAD-seq (Peterson et al., 2012) and genotype-by-sequencing (GBS) (Poland et al., 2012), SLAF-seq, combined next-generation sequencing (NGS) with the use of restriction enzymes, are recently developed high-throughput methods for SNP marker discovery and genotyping (Sun et al., 2013). Using this technology, SNP markers have been widely applied for HDGM construction in various plants, such as sesame (Zhang et al., 2013), soybean (Qi et al., 2014), grape (Guo et al., 2014), Mei (Zhang et al., 2015b), cucumber (Zhu et al., 2016), and tetraploid cotton (Zhang et al., 2016). In this study, we successfully applied this technology to construct a HDGM with thousands of SNP markers in tetraploid peanut.
Yield is the most important and complex agronomical traits in crops. The yield traits include plant architecture and the pod- and seed-related traits (Holbrook and Stalker, 2003; Shirasawa et al., 2012). Selvaraj et al. (2009) identified five QTLs associated with differences between bulks for seed length, pod length, number of pods per plant, 100-seed weight. Fonceka et al. (2012) detected a total of 26 QTLs explaining 9.2–20.6% of the yield component traits. Shirasawa et al. (2012) identified a total of 23 significant QTLs explaining the phenotype variance ranged from 4.8 to 28.2% for the 15 investigated traits including pod- and seed-traits. Huang et al. (2015) detected 24 QTLs and each QTL explained 1.69–18.70% of the phenotypic variance for 10 yield traits. (Chen W. et al. 2016) identified 39 QTLs explaining 1.25–26.11% of the phenotypic variations for pod length and width and seed length. For these yield-related QTLs, many of them explained minor or moderate phenotypic variation (Salas et al., 2006; Xu et al., 2011; Niu et al., 2013; Kato et al., 2014), and revealed the underlying complex genetic basis in peanut and other crops (Zuo and Li, 2014; Wang et al., 2015; Peng et al., 2016). However, compared to the comprehensive QTL studies on rice, oilseed rape and soybean (Varshney et al., 2010, 2013; Pandey et al., 2014), our understanding of the genetic basis for these traits in peanut are limited.
In the present study, a recombinant inbred line (RIL) population consisting of 242 individuals was derived from the cross between two tetraploid peanut genotypes, “ZH16” and “sd-H1.” The female parent, “ZH16” (A. hypogaea var. vulgaris), is a cultivar with large-seeded with pink testa and two seeds per pod. The male parent, “sd-H1” (A. hypogaea var. fastigiata), is a germplasm with small-seeded with red testa and three seeds in each pod. The yield-related traits were significantly different between two parents and extensive transgressive segregation in RIL population was observed, which are suitable for QTL mapping based on molecular markers. Here, genotype data were generated and SNP markers were discovered by SLAF-seq of the parents and RILs, and a HDGM of peanut was successfully constructed. To test the utility of this map, QTL mapping of 14 yield-related traits was conducted across 3 environments.
Materials and Methods
Plant Material and Trait Phenotyping
A F6 RIL population including 242 lines was developed from a cross between homozygous cultivars “ZH16” and “sd-H1.” Field experiments including the parents and segregating populations in years 2015 (Wuchang, E 114° 34′/N 30° 59′) and 2016 (Wuchang, E 114° 34′/N 30° 59′ and Yangluo, E 114° 52′/N 30° 59′) were conducted at Oil Crops Research Institute of the Chinese Academy of Agricultural Sciences, Hubei Province, China. The seeds were sown at the end of April of each experimental year. Each accession was planted in a single row, with 8 ± 10 plants in each row and 10-cm intervals between plants within each row, and 30-cm intervals between rows. The parental genotypes were also sown after every 50 rows as the controls. Randomized blocks were arranged, and average 10 individuals for each line in each block were selected for phenotype investigationfor PH, TBN, PL, PW, LWRP, SL, SW, LWRS, HPW, and HSW. The length and width of the two-seeded pods and seeds were measured using a parallel rule. The pods and seeds were also weighed on a digital scale. The PL/PW and SL/SW were calculated using PL and PW and SL and SW.
Statistical Analysis of Broad-Sense Heritability
Broad-sense heritability was calculated using the equation h2 = σg 2/(σg2 +σge2/n +σe2/nr). In the equation, σg2, σge2, and σe 2 were defined as the genetic variance, the interaction variance between genotype and environment, and the residual error variance, respectively. The n and r in the equation were defined as the number of environments and the number of replications, respectively. The general linear model (GLM) was used to estimate each variance component by SAS software. The Pearson's correlation coefficient was calculated for pair-wise comparison matrix of traits across the environments.
Library Construction and High-Throughput Sequencing
The genomic DNA was extracted using young leaves from each accession by a modified CTAB method. Through scanning the restriction endounclease sites on reference genome, the HaeIII endonuclease was chosen to digest the genomic DNA. The details of the SLAF-seq strategy and library construction were previously described (Sun et al., 2013; Zhang et al., 2015b). Finally, DNA fragments belonging to 400–530 bp in size were excised and diluted for paired-end sequencing which was performed on an Illumina HiSeq 2500 system (Illumina, Inc., San Diego, CA, USA). All SLAF-seq raw data from this study have been submitted to the NCBI SRA database (http://www.ncbi.nlm.nih.gov/sra/) under accession no. SRP108694.
Grouping and Genotyping of Sequence Data
The same procedure for read clustering and SNP genotyping was applied according to Sun et al. (2013) and Zhang et al. (2015b). After discarding the low-quality reads, the remaining reads were mapped to the reference genome by BWA software (Li and Durbin, 2009). The two progenitor genome sequences of tetraploid peanut were concatenated as the reference genome for read mapping (Bertioli et al., 2016). Only uniquely mapped reads were considered to identify SLAF markers (SLAFs). The SLAFs with less than four alleles were considered as polymorphic and potential markers. The Bayesian approach was used for genotype scoring, and the markers with >30% of missing data were further filtered out before genetic map construction, as described previously (Zhang et al., 2015b).
Linkage Map Construction
The procedure used for linkage map construction was the same as Zhang et al. (2015b), including ordering of markers by HighMap strategy (Zhang et al., 2015b), error correction by SMOOTH strategy (van Os et al., 2005), and imputation of missing genotypes by k-nearest neighbor algorithm (Huang et al., 2012). The multipoint method of maximum likelihood was applied for adding the skewed markers to the genetic map (Xu and Hu, 2009). The genetic distance between markers was calculated using the Kosambi mapping function, and also compared with the marker orders of each group obtained by MSTMap (Wu et al., 2008). For inconsistent regions of marker orders, we used more rigorous parameters (distance < 20 cM between adjacent markers and P-value < 10−5) to re-calculate and adjust them. A bin is defined as a position on the genetic map containing a clustering of markers showing a genetic distance of zero between each other.
QTL Analysis Using HDGM
The QTLs were detected using the composite interval mapping method in Windows QTL Cartographer 2.5 (Silva Lda et al., 2012). The permutation test was repeated 1000 times using 1.0 cM step and 5 control markers, and the LOD threshold (P < 0.05) were obtained for declaring significant QTLs. QTLs were considered as effective when the LOD scores were between 3.0 and the LOD threshold from the permutation test. Positive and negative additive effects mean that the favorable alleles were derived from parent “ZH16” and “sd-H1,” respectively. The QTL meta-analysis was performed to integrate the QTLs from different environments and traits using BioMeractor 4.2 software (Sosnowski et al., 2012).
Results
SLAF Sequencing and Genotyping
According to the results of pilot experiment, the HaeIII enzyme was selected for SLAF library construction. Considering the low rate of DNA polymorphisms in peanut, we sequenced a high amount of data of the parents and the RIL population to obtain a sufficient number of markers. A total of 524.83 Gb of data containing 2,624.07 M paired-end reads of 100 bp in length were obtained. The Q30 ratio was 90.40% and GC content was 43.25% in average. Of these high-quality data (Supplementary Table S1), 12.60 Gb were from the male parent “sd-H1” with 62,997,078 reads, and 11.59 Gb were from the female parent “ZH16” with 57,928,805 reads. Read numbers for the F6 population ranged from 6,800,354 to 18,885,615 with an average of 10,343,589. The number of SLAFs in male and female parents was 737,780 and 732,877, corresponding to 49,660,470 and 45,483,812 reads, respectively. The average sequencing depth for each SLAF marker was 67.31- and 62.06-fold in male and female parents, respectively. In the F6 population (Supplementary Table S1), the number of SLAFs ranged from 489,875 to 680,491 with an average of 589,904, and the coverage ranged from 9.04 to 27.92-fold with an average of 13.75-fold.
After filtering repetitive SLAFs, 824,866 SLAFs were detected, and 7.6% of these were polymorphic (Table 1). According to the genotype encoding rule, we obtained the number of SLAFs corresponding to eight segregation patterns (ab × cd, ef × eg, hk × hk, lm × ll, nn × np, aa × bb, ab × cc, and cc × ab) (Supplementary Figure S1). 28,720 polymorphic SLAFs containing 31,526 SNPs belonging to aa × bb segregation pattern were used in the following construction of linkage map because the two parents used for the cross are homozygous lines with a genotype of aa or bb. Finally, the low-quality SLAFs were discarded when they are with a parental sequence depth of < 10 × , completeness < 70%, and significant segregation distortion (P < 0.001).
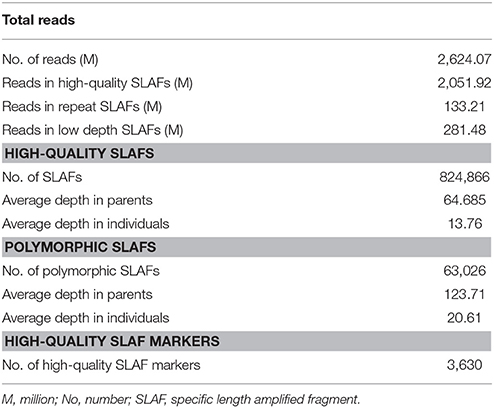
Table 1. SLAF-seq data summary for peanut F6 population.
High-density Genetic Map Construction
The final map included 3,630 markers belonging to 2,636 bins on the 20 linkage groups (LGs) (Figure 1 and Supplementary Figure S2) and was 2,098.14 cM in length with an average inter-marker distance of 0.58 cM. As shown in Table 2, B07 was the largest LG which has 429 markers, with the length of 144.64 cM and an average distance of 0.34 cM. On the contrary, A02 was the smallest LG which has only 43 markers, with the length of 77.58 cM and an average distance of 1.80 cM. The linkage degree between the markers was reflected by “Gap ≤ 5,” which ranged between 93.15 and 100%, and showed an average value of 98.34%. The largest gap on this map was 15.44 cM, which was located on A09, followed by 14.10 cM on A07.
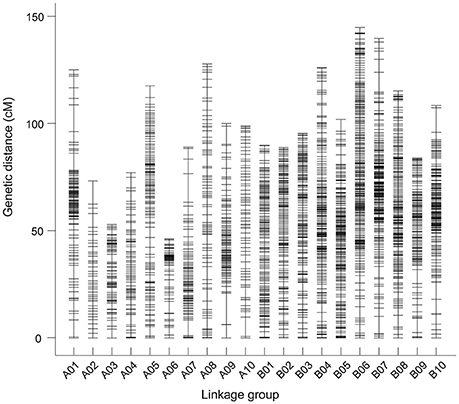
Figure 1. The markers distributed on 20 linkage groups of peanut. Each marker was indicated using a black bar. The x-axis and y-axis represent the number of linkage groups and the genetic distance, respectively.
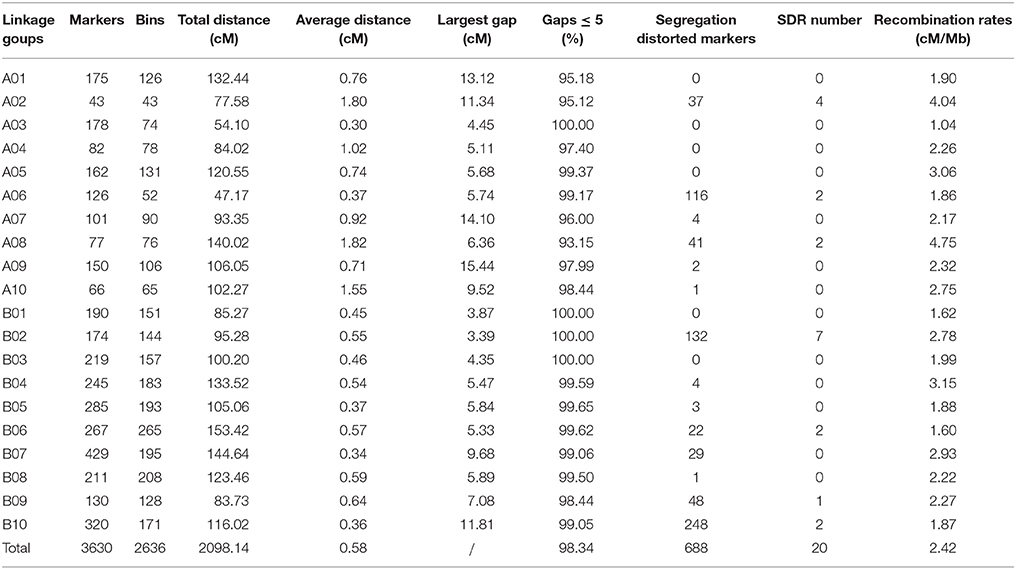
Table 2. Basic characteristics of peanut linkage groups.
There are three different types of markers in genetic map including 3,519 “SNP_only,” 101 “InDel_only,” and 10 “SNP&InDel” markers, accounting for 96.94, 2.78, and 0.28%, respectively (Supplementary Figure S3). Among the 3,519 markers of the “SNP_only” type, 95.28% had a single SNP locus and the others had two or three SNP loci. Two transition types of SNPs, including Y (T/C) and R (A/G), accounted for 36.05 and 35.05% of all markers, respectively. The other four transversion types of SNPs, including S (G/C), M (A/C), K (G/T), and W (A/T), ranged from 3.48 to 11.15% of all of the SNPs (Supplementary Figure S3). To confirm the authenticity of the identified SNPs, 19 out of 20 randomly selected SNPs were confirmed by Sanger sequencing (Supplementary Table S2).
Among the 3,630 markers, chi-square testing revealed that 688 (19%) showed significant segregation distortion, with 337 (49%) favoring the elite “ZH16” allele and 351 (51%) favoring the germplasm sd-H1 allele (Table 2). Segregation distortion regions (SDRs) were defined when at least four skewed markers were clustered. We found 20 SDRs including 688 distorted segregation markers on 7 chromosomes as follows: A02 (37), A06 (116), A08 (41), B02 (132), B06 (22), B09 (48), and B10 (248) (Supplementary Figure S4).
The Collinearity and Evaluation of the Genetic Map
To assess the quality of this genetic map, a haplotype map was generated for each individual of the F6 population (Supplementary Figure S5), which reflects the double crossover and the recombination events (West et al., 2006). We further conducted a comparison between the genetic and physical positions of the markers based on the reference genome. A high collinearity between them indicated that the markers were placed accurately within each LG (Figure 2). A large inversed segment on chromosome A05 (15–45 cM) was found, which was in opposite orientation between genetic and physical positions (Figure 2). Subsequently, the recombination rates along chromosomes were calculated by comparing the genetic distance to the physical distance (Mb) (Supplementary Figure S6). It varied among different chromosomes, ranging from 1.04 centimorgans per megabase (cM/Mb) for chromosome A03 to 4.75 cM/Mb for chromosome A08, and a genome-wide average recombination rate of 2.42 cM/Mb. In addition, we anchored 62 scaffolds accounting for 5.8 Mb of the total length to specific chromosomal positions using genetic markers on scaffolds, which allowed updating of the genome assembly (Supplementary Table S3).
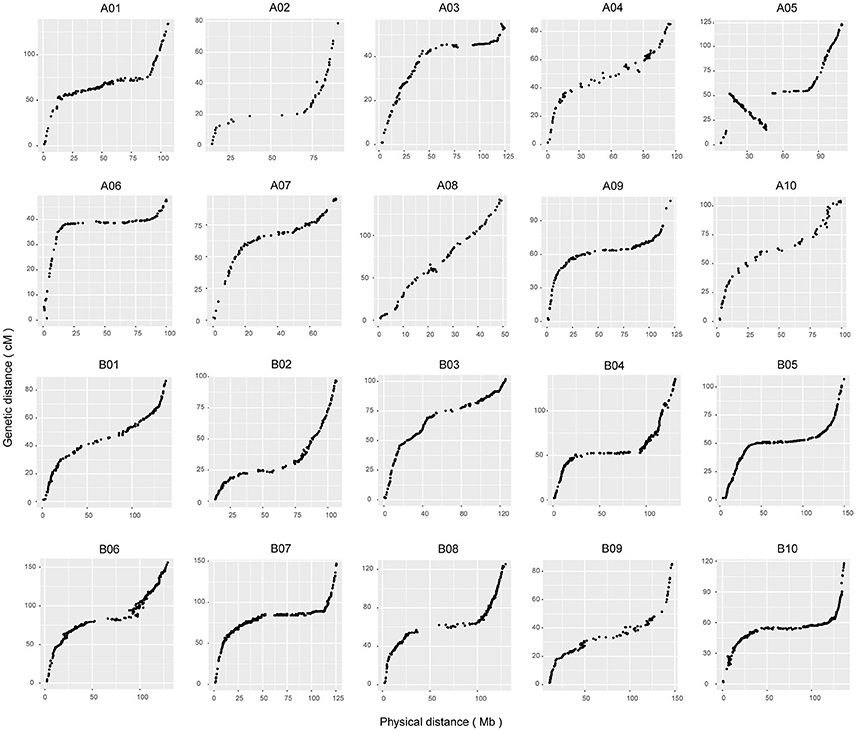
Figure 2. Collinearity analyses of all of the linkage groups with genome sequences. The x-axis scales the physical positions of markers based on reference sequences. The y-axis represents the genetic distance of the markers in centimorgans accordingly.
Yield-Related Phenotypic Traits of the Parents and Individuals
Parent “ZH16” is a high-yield Spanish type cultivar with larger pods and seed size and two seeds in each pod, whereas parent “sd-H1” is a low-yield Valencia type cultivar with smaller pods and seeds and three seeds in each pod. The two parents showed significant differences (P < 0.001) in 14 yield-related traits, which were evaluated in 3 different environments in RILs (Table 3). The traits examined showed approximately the same phenotypic data distribution for all 3 environments (Table 3). A continuous distribution were shown for all traits in RIL population (Figure 3), indicating that these traits were controlled by multiple genes and belonged to a quantitative inheritance pattern.
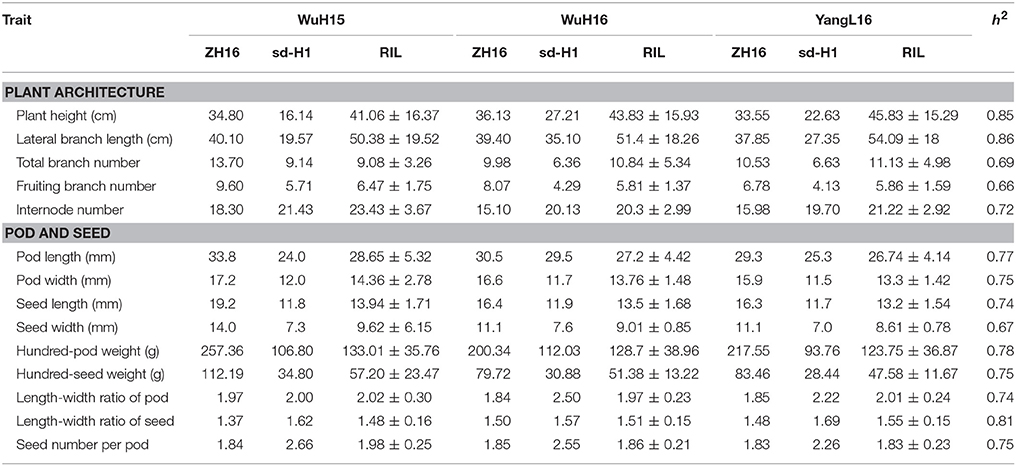
Table 3. Phenotypic variation of “ZH16,” “sd-H1,” and RILs grown in three different environments.
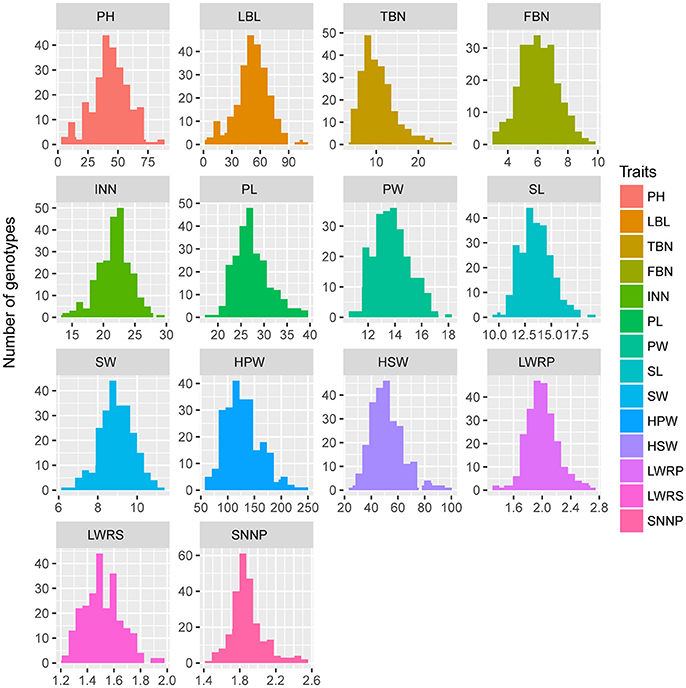
Figure 3. Phenotypic distributions of 14 yield-related traits in the RIL population.
We conducted ANOVA analysis for all 14 traits across the environments, and calculated the effects of genotype (G), environment (E), and genotype-environment interactions (G × E) on the traits (Table 4). They showed high broad-sense heritability, ranging from 65.7 to 86.2%, suggesting a major role of genetic factors in the expression of these traits as well as a considerable proportion of environmental variation affecting these traits. To elucidate their relationships, correlation coefficients (r) between the traits were calculated across the various environments (Figure 4). Plant height (PH) and lateral branch length (LBL) were strongly positively correlated, with a correlation coefficient of 0.97. Significant positive relationships also have been found for internode number (IN) and lateral branch length (LBL) (r = 0.70), Pod length (PL) and pod width (PW) (r = 0.76), PW and seed width (SW) (r = 0.80), hundred-pod weight (HPW) and hundred-seed weight (HSW) (r = 0.71). The significant phenotypic correlations among these traits coincided with the results of QTL co-localization (see next).
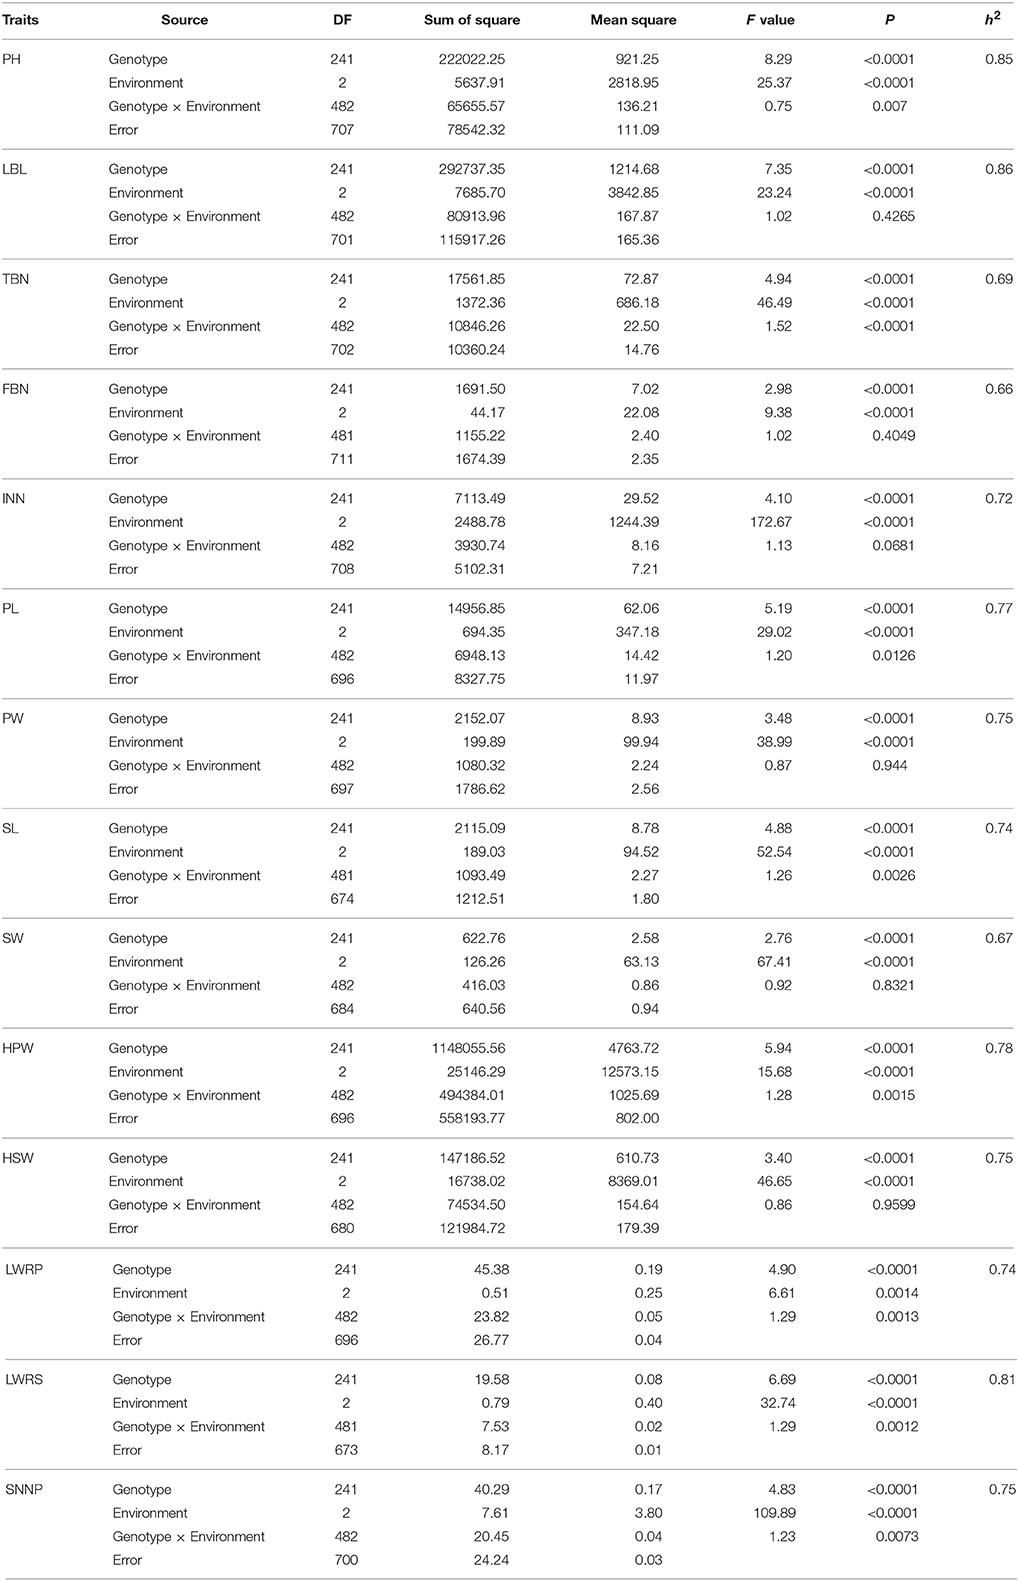
Table 4. The broad-sense heritability for the 14 yield-related traits of RILs.
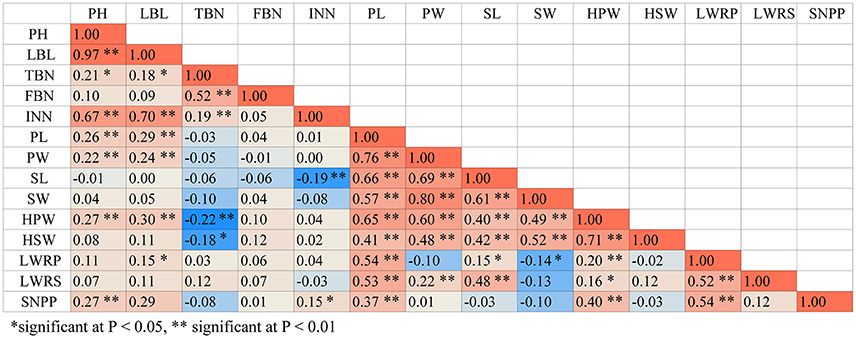
Figure 4. The correlation coefficients between pair-wise trait matrix. The phenotypic values averaged from three environments were used for Pearson's correlation test.
QTL Analysis and Candidate Gene Identification for Agronomic and Yield-Related Traits
A total of 62 QTLs for all of the 14 traits were detected on 12 chromosomes across the 3 environments (“WuH15,” “WuH16,” and “YangL16”), and explained 4.03 to 18.9% of the observed phenotypic variation, respectively (Supplementary Table S4). Furthermore, 33 consensus QTLs were obtained by the trait-by-trait meta-analysis. For the five plant architecture traits, We have detected five QTLs for PH, three QTLs for LBL, four QTLs for total branch number (TBN), five QTLs for fruiting branch number (FBN) and four QTLs for INN, most QTLs for these traits were located on A01, A06, A10, B01, B06, B07, and B10. It is showed that several QTLs for different traits were co-localized, such as one region (41.1–46.0 cM) on A06 for traits PH (qPHA06.1 from “WuH16”) and LBL (qLBLA06 from “WuH16”), one region on A06 (10.2–14.4 cM) for traits FBN (qFBNA06.1 from “WuH15”) and TBN (qTBNA06 from “WuH15”), and one region on B01 (67.5–74.0 cM) for traits FBN (qFBNB01 from “WuH15”) and TBN (qTBNB01 from “WuH15”), respectively.For the pod- and seed-related traits, we have identified three QTLs for PL, six QTLs for PW, four QTLs for length-width ratio of pod (LWRP), six QTLs for HSW, two QTLs for HPW and thirteen QTLs for SL, their identified QTLs were localized to A04, B02, B06, B07, and B08, and co-localized to two genomic regions: B06 (121.5–141.0 cM) and B07 (131.2–142.9 cM) (Figure 5), including qPLB06.1–2, qPWB06.1–3, qSLB06.1–3, qHPWB06, qHSWB06.1-2 from “WuH15”, qPWB07.1–3 from “WuH16” and “YangL16,” qHSWB07.1–2 from “WuH15” and “WuH16”, qSLB07.1–4 and qSWB07.1–4 from “WuH15,” “WuH16” and “YangL16.” These results showed that the pleiotropic QTLs contained multiple tightly linked genes for different traits or the gene that affects multiple traits (Hall et al., 2006).
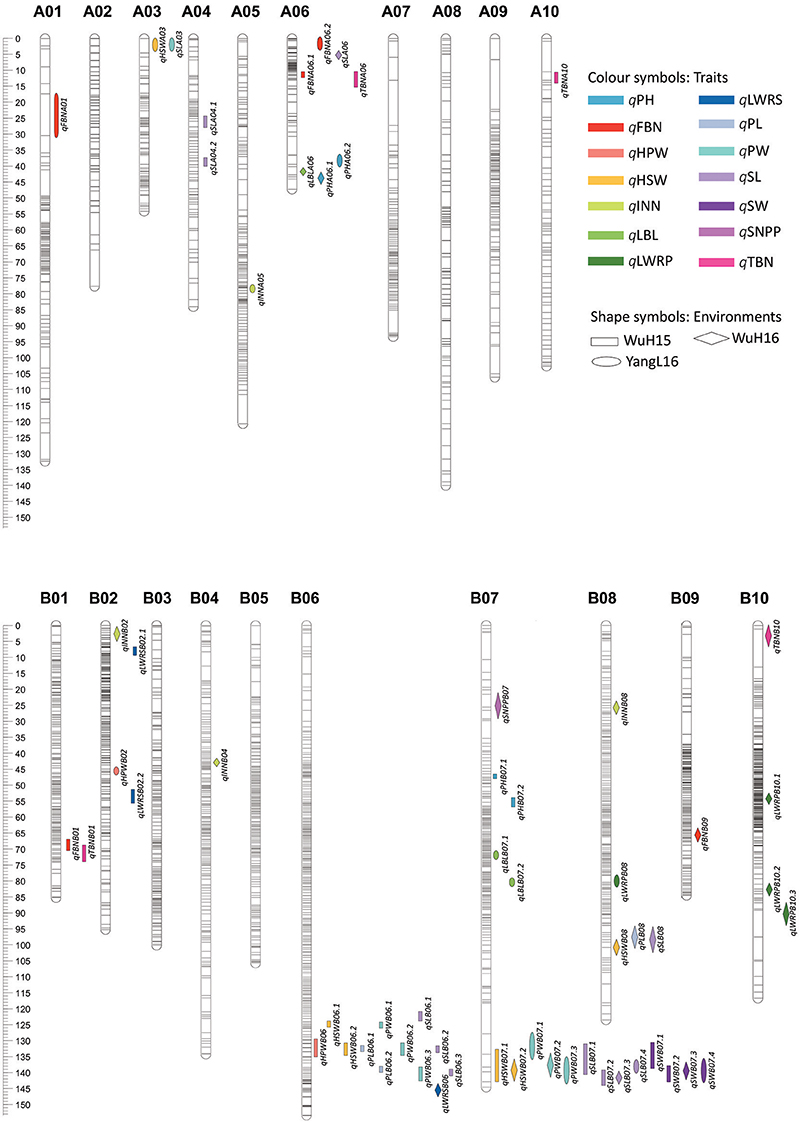
Figure 5. The distribution of significant QTLs on chromosomes.
All these annotated genes were identified underlying predicted QTLs and then blasted to find homologous genes with functional descriptions in A. thaliana (Supplementary Table S5). We conducted GO analysis of these genes, and found that many of these distributed in GO categories, such as “GO:0032502 developmental process,” “GO:0010926 anatomical structure formation,” “GO:0040007 growth,” “GO:0065007 biological regulation,” “GO:0030528 transcription regulator activity” (Supplementary Figure S7). We further checked the functional annotation and description of genes within two obviously co-located QTLs of seed- and pod-related traits in B06 and B07 since these two QTL regions were also confirmed by our following Bulk segregant analysis (BSA) of the trait of interest (Unpublished data). There are 63 and 76 candidate genes in the two regions, respectively, and some candidate genes were found to be associated with yield-related traits based on previous studies. In the pleiotropic QTL on B06, two genes, Araip.10014506 and Araip.10014509, were homologous to AT1G08840 and AT1G80260, respectively, which were reported to be related to embryo development (McElver et al., 2001; Jia et al., 2016). In the pleiotropic QTL on B07, the Araip.10036332 and Araip.10036333, a pair of tandemly duplicated genes, were homologous to aap8 (AMINO ACID PERMEASE 8, AT1G10010). This gene in A. thaliana plays an important role in the regulation of carbon metabolism and transport by sink strength (Santiago and Tegeder, 2016, 2017). Carbon fixation and assimilation as well as sucrose partitioning to siliques were strongly decreased when app8 mutant plants transitioned to the reproductive phase. Based on these results, these candidate genes within QTLs should be further investigated, including gene cloning and functional analysis.
Discussion
Cultivated peanut, an allotetraploid (2n = 4x = 40), is a self-pollinated crop with a large genome (~ 2.8 Gb). Investigations on the genetic diversity of peanut germplasm resources have indicated that cultivated peanut possesses an extremely narrow genetic base (Jiang et al., 2010; Ren et al., 2010; Belamkar et al., 2011; Wang et al., 2011; Mukri et al., 2012; Upadhyaya et al., 2012), which is likely due to its monophyletic origin from a single hybridization event between two ancient diploid species (Burow et al., 2009). The low polymorphism rates have been revealed for a variety of markers in peanut including 6.6% for RAPD (Subramanian et al., 2000), 3.6% for AFLP (He and Prakash, 1997), 10.4% for EST-SSR (Liang et al., 2009), 14.5% for SSR (Zhao et al., 2012), 7.6% for SNPs in this study. Low levels of polymorphisms limit the quantity of available markers and hinder the construction of a HDGM. However, the development of next-generation sequencing has facilitated in obtaining thousands of SNPs in the peanut genome and constructing a HDGM. Using ddRAD-seq technology, we previously reported a HDGM for cultivated peanut that comprises 1,267 bins and 1,685 SNPs, covering 1,446.7 cM with an average distance of 0.86 cM between adjacent markers (Zhou et al., 2014). In this study, we developed a new HDGM using SLAF-seq technology, which includes 2,597 bins and 3,568 markers, spanning 2,098.1 cM with an average inter-marker distance of 0.59 cM. To our knowledge, this genetic map has the highest number of SNPs for cultivated peanut to date.
The success in constructing HDGM is mainly attributed to the mature pipeline on sequencing and analyzing technology of SLAF-seq, the high sequencing depth of the parents (60-fold) and RILs (20-fold), the relatively large population size, and more importantly, the availability of a reference genome. Compared to the de novo method used by Zhou et al. (2014), the reference genome used in this study guarantees the accuracy of mapping, clustering and genotyping for SLAF markers, as well as serves as a tool for the validation of the quality of the genetic map. A highly conserved genome between diploid and tetraploid species of Arachis was revealed by the good collinearity between the genetic and physical map, which may be due to its short evolutionary history after two diploid genomes merged approximately 3,500 years ago (Gary Kochert et al., 1996). On the other hand, the constructed HDGM also could help in determining the genomic distribution of segregation distortion and recombination rates. In this study, we identified 20 SDRs on 7 chromosomes where the genetic selection factors for gametophyte competition probably existed. Further studies investigating the segregation distortion on specific regions can elucidate the mechanism underlying the distorted loci. Furthermore, information on the chromosomal distribution of recombination events will aid in defining the centromere regions as well as the recombination hot and cold spots on various chromosomes.
The constructed HDGM was used to identify QTLs for yield-related traits. Several QTLs explaining moderate phenotypic variation were identified, which is in agreement with the results of previous studies on other crops in which yield-related traits were always controlled by multiple small-effect QTLs (Peiffer et al., 2014; Zhang et al., 2015a). Some identified QTLs in this study were located on the same chromosomes as previously reported for PH, and TBN (Fonceka et al., 2012; Huang et al., 2015), and pod and seed traits (Fonceka et al., 2012; Shirasawa et al., 2012; Pandey et al., 2014; Huang et al., 2015, 2016). Because no markers were shared between our map and these reported maps, we were unable to compare QTL positions among the different maps. However, the known and novel QTLs for yield-related traits should both be detected in our materials, as the genetic basis of these traits was mainly dependent on peanut genotypes. In addition, although the broad-sense heritability was relatively higher in these traits, the stability and accuracy of QTLs are still affected by environmental factors, including the season and climatic conditions. Nevertheless, we detected several stable QTLs that are common across different years and environments as well as several pleiotropic QTLs. The co-localization of QTLs was observed for yield-related traits in this study, which is similar to that in other crops, such as soybean (Xie et al., 2014), rapeseed (Shi et al., 2009; Li et al., 2014; Liu et al., 2015), and rice (Zuo and Li, 2014). The significant pleiotropic QTLs suggest that these traits are influenced by several genes that control different aspects of complex metabolic pathways, and they might have resulted from the artificial selection and rapid evolution of multiple traits in peanut breeding (Yoshizawa et al., 2013). In addition, several genes are associated with yield traits in stable and pleiotropic QTLs, and these play important roles in seed development, sugar transport, and transcriptional regulation. The identified candidate genes in pleiotropic QTLs provide information on the genetic basis of these traits, thereby facilitating the selection of varieties during molecular breeding. Further transcriptomic and gene-directed studies for these candidate genes may facilitate the elucidation of the molecular mechanisms underlying yield-related traits.
Author Contributions
ZW, YL, and BL conceived and designed the experiments, ZW, DH, ZZ, KC, LW, and LY performed the agronomic traits measurements of the plant materials, ZW, analyzed the data and wrote the manuscript, ZW, HJ, YL, and BL revised the manuscript. All authors have read and approved the final version of the manuscript.
Funding
This research was supported by the National Natural Science Foundation of China (nos. 31461143022, 31671734, and 31301256), National High Technology Research and Development Program of China (863 Program, no. 2013AA102602), the Knowledge Innovation Program of Chinese Academy of Agricultural Sciences, Central Public-interest Scientific Institution Basal Research Fund, and Shandong Agricultural industrialization project for new variety development (2014-2016).
Conflict of Interest Statement
The authors declare that the research was conducted in the absence of any commercial or financial relationships that could be construed as a potential conflict of interest.
Acknowledgments
The authors would like to thank Dr. Lei Shi (Henan academy of agricultural sciences, Zhengzhou, China) for assistance with technical aspects of the project.
Supplementary Material
The Supplementary Material for this article can be found online at: https://www.frontiersin.org/articles/10.3389/fpls.2018.00827/full#supplementary-material
Abbreviations
AFLP, amplified fragment length polymorphism; ddRAD-seq, double-digest restriction-site associated DNA sequencing; EST, expressed sequence tag; FBN, Fruiting branch number; GBS, genotype-by-sequencing; HDGM, high-density genetic map; HPW, Hundred-pod weight; HSW, Hundred-seed weight; IN, Internode number; LBL, Lateral branch length; LG, linkage group; LWRP, Length-width ratio of pod; LWRS, Length-width ratio of seed; NGS, next-generation sequencing; PH, Plant height; PL, Pod length; PW, Pod width; QTL, quantitative trait loci; RAPD, random amplified polymorphic DNA; RFLP, restriction fragment length polymorphism; RIL, recombinant inbred line; SDR, segregation distortion region; SLAF-seq, specific locus amplified fragment sequencing; SL, Seed length; SNP, single nucleotide polymorphism; SNPP, Seed number per pod; SSR, simple sequence repeat; SW, Seed width; TBN, Total branch number.
References
Belamkar, V., Selvaraj, M. G., Ayers, J. L., Payton, P. R., Puppala, N., and Burow, M. D. (2011). A first insight into population structure and linkage disequilibrium in the US peanut minicore collection. Genetica 139, 411–429. doi: 10.1007/s10709-011-9556-2
Bertioli, D. J., Cannon, S. B., Froenicke, L., Huang, G., Farmer, A. D., Cannon, E. K., et al. (2016). The genome sequences of Arachis duranensis and Arachis ipaensis, the diploid ancestors of cultivated peanut. Nat. Genet. 48, 438–446. doi: 10.1038/ng.3517
Bertioli, D. J., Ozias-Akins, P., Chu, Y., Dantas, K. M., Santos, S. P., Gouvea, E., et al. (2014). The use of SNP markers for linkage mapping in diploid and tetraploid peanuts. G3-Genes Genomes Genetics 4, 89–96. doi: 10.1534/g3.113.007617
Burow, M. D., Simpson, C. E., Faries, M. W., Starr, J. L., and Paterson, A. H. (2009). Molecular biogeographic study of recently described B- and A-genome Arachis species, also providing new insights into the origins of cultivated peanut. Genome 52, 107–119. doi: 10.1139/G08-094
Chen, W., Jiao, Y., Cheng, L., Huang, L., Liao, B., Tang, M., et al. (2016). Quantitative trait locus analysis for pod- and kernel-related traits in the cultivated peanut (Arachis hypogaea L.). BMC Genet. 17:25. doi: 10.1186/s12863-016-0337-x
Chen, X., Li, H., Pandey, M. K., Yang, Q., Wang, X., Garg, V., et al. (2016). Draft genome of the peanut A-genome progenitor (Arachis duranensis) provides insights into geocarpy, oil biosynthesis, and allergens. Proc. Natl. Acad. Sci. U.S.A. 113, 6785–6790. doi: 10.1073/pnas.1600899113
Fonceka, D., Tossim, H. A., Rivallan, R., Vignes, H., Faye, I., Ndoye, O., et al. (2012). Fostered and left behind alleles in peanut: interspecific QTL mapping reveals footprints of domestication and useful natural variation for breeding. BMC Plant Biol. 12:26. doi: 10.1186/1471-2229-12-26
Gary Kochert, H., Stalker, T., Gimenes, M., Galgaro, L., Lopes, C. R., and Moore, K. (1996). RFLP and cytogenetic evidence on the origin and evolution of allotetraploid domesticated peanut, arachis hypogaea (Leguminosae). Am. J. Bot. 83, 1282–1291. doi: 10.1002/j.1537-2197.1996.tb13912.x
Gautami, B., Pandey, M. K., Vadez, V., Nigam, S. N., Ratnakumar, P., Krishnamurthy, L., et al. (2012). Quantitative trait locus analysis and construction of consensus genetic map for drought tolerance traits based on three recombinant inbred line populations in cultivated groundnut (Arachis hypogaea L.). Mol. Breed. 30, 757–772. doi: 10.1007/s11032-011-9660-0
Guo, Y., Shi, G., Liu, Z., Zhao, Y., Yang, X., Zhu, J., et al. (2014). Using specific length amplified fragment sequencing to construct the high-density genetic map for Vitis (Vitisvinifera L. × Vitis amurensis Rupr.). Front. Plant Sci. 6: 393. doi: 10.3389/fpls.2015.00393
Hall, M. C., Basten, C. J., and Willis, J. H. (2006). Pleiotropic quantitative trait loci contribute to population divergence in traits associated with life-history variation in Mimulus guttatus. Genetics 172, 1829–1844. doi: 10.1534/genetics.105.051227
Halward, T. M., Stalker, H. T., Larue, E. A., and Kochert, G. (2011). Genetic variation detectable with molecular markers among unadapted germ-plasm resources of cultivated peanut and related wild species. Genome 34, 1013–1020. doi: 10.1139/g91-156
Halward, T., Stalker, H. T., and Kochert, G. (1993). Development of an RFLP linkage map in diploid peanut species. Theor. Appl. Genet. 87, 379–384. doi: 10.1007/BF01184927
He, G., and Prakash, C. S. (1997). Identification of polymorphic DNA markers in cultivated peanut (Arachis hypogaea L.). Euphytica 97, 143–149. doi: 10.1023/A:1002949813052
Hilu, K. W., and Stalker, H. T. (1995). Genetic relationships between peanut and wild species of Arachis sect. Arachis (Fabaceae): evidence from RAPDs. Plant Syst. Evol. 198, 167–178. doi: 10.1007/BF00984735
Holbrook, C. C., and Stalker, H. T. (2003). Peanut Breeding and Genetic Resources. Hoboken, NJ: John Wiley & Sons, Inc.
Hong, Y., Chen, X., Liang, X., Liu, H., Zhou, G., Li, S., et al. (2010). A SSR-based composite genetic linkage map for the cultivated peanut (Arachis hypogaea L.) genome. BMC Plant Biol. 10:17. doi: 10.1186/1471-2229-10-17
Huang, L., He, H., Chen, W., Ren, X., Chen, Y., Zhou, X., et al. (2015). Quantitative trait locus analysis of agronomic and quality-related traits in cultivated peanut (Arachis hypogaea L.). Theor. Appl. Genet. 128, 1103–1115. doi: 10.1007/s00122-015-2493-1
Huang, L., Ren, X., Wu, B., Li, X., Chen, W., Zhou, X., et al. (2016). Development and deployment of a high-density linkage map identified quantitative trait loci for plant height in peanut (Arachis hypogaea L.). Sci. Rep. 6:39478. doi: 10.1038/srep39478
Huang, X., Zhao, Y., Wei, X., Li, C., Wang, A., Zhao, Q., et al. (2012). Genome-wide association study of flowering time and grain yield traits in a worldwide collection of rice germplasm. Nat. Genet. 44, 32–39. doi: 10.1038/ng.1018
Jia, N., Liu, X. M., and Gao, H. B. (2016). A DNA2 homolog is required for DNA damage repair, cell cycle regulation, and meristem maintenance in plants. Plant Physiol. 171, 318–333. doi: 10.1104/pp.16.00312
Jiang, H. F., Ren, X. P., Zhang, X. J., Huang, J. Q., Lei, Y., Yan, L. Y., et al. (2010). Comparison of genetic diversity between peanut mini core collections from China and ICRISAT by SSR markers. Acta Agronomica Sinica 36, 1084–1091. doi: 10.1016/S1875-2780(09)60059-6
Kato, S., Sayama, T., Fujii, K., Yumoto, S., Kono, Y., Hwang, T. Y., et al. (2014). A major and stable QTL associated with seed weight in soybean across multiple environments and genetic backgrounds. Theor. Appl. Genet. 127, 1365–1374. doi: 10.1007/s00122-014-2304-0
Li, H., and Durbin, R. (2009). Fast and accurate short read alignment with Burrows-Wheeler transform. Bioinformatics 25, 1754–1760. doi: 10.1093/bioinformatics/btp324
Li, N., Shi, J., Wang, X., Liu, G., and Wang, H. (2014). A combined linkage and regional association mapping validation and fine mapping of two major pleiotropic QTLs for seed weight and silique length in rapeseed (Brassica napus L.). BMC Plant Biol. 14:114. doi: 10.1186/1471-2229-14-114
Liang, X., Chen, X., Hong, Y., Liu, H., Zhou, G., Li, S., et al. (2009). Utility of EST-derived SSR in cultivated peanut (Arachis hypogaea L.) and Arachis wild species. BMC Plant Biol. 9:35. doi: 10.1186/1471-2229-9-35
Liao, P. Y., and Lee, K. H. (2010). From SNPs to functional polymorphism: the insight into biotechnology applications. Biochem. Eng. J. 49, 149–158. doi: 10.1016/j.bej.2009.12.021
Liu, J., Hua, W., Hu, Z., Yang, H., Zhang, L., Li, R., et al. (2015). Natural variation in ARF18 gene simultaneously affects seed weight and silique length in polyploid rapeseed. Proc. Natl. Acad. Sci. U.S.A. 112, E5123–E5132. doi: 10.1073/pnas.1502160112
McElver, J., Tzafrir, I., Aux, G., Rogers, R., Ashby, C., Smith, K., et al. (2001). Insertional mutagenesis of genes required for seed development in Arabidopsis thaliana. Genetics 159, 1751–1763.
Miller, M. R., Dunham, J. P., Amores, A., Cresko, W. A., and Johnson, E. A. (2007). Rapid and cost-effective polymorphism identification and genotyping using restriction site associated DNA (RAD) markers. Genome Res. 17:240. doi: 10.1101/gr.5681207
Mukri, G., Nadaf, H. L., Bhat, R. S., Gowda, M. V. C., Upadhyaya, H. D., and Sujay, V. (2012). Phenotypic and molecular dissection of ICRISAT mini core collection of peanut (Arachis hypogaea L.) for high oleic acid. Plant Breed. 131, 418–422. doi: 10.1111/j.1439-0523.2012.01970.x
Nagy, E. D., Guo, Y., Tang, S., Bowers, J. E., Okashah, R. A., Taylor, C. A., et al. (2012). A high-density genetic map of Arachis duranensis, a diploid ancestor of cultivated peanut. BMC Genomics 13:469. doi: 10.1186/1471-2164-13-469
Niu, Y., Xu, Y., Liu, X. F., Yang, S. X., Wei, S. P., Xie, F. T., et al. (2013). Association mapping for seed size and shape traits in soybean cultivars. Mol. Breed. 31, 785–794. doi: 10.1007/s11032-012-9833-5
Pandey, M. K., Monyo, E., Ozias-Akins, P., Liang, X., Guimaraes, P., Nigam, S. N., et al. (2012). Advances in Arachis genomics for peanut improvement. Biotechnol. Adv. 30, 639–651. doi: 10.1016/j.biotechadv.2011.11.001
Pandey, M. K., Upadhyaya, H. D., Rathore, A., Vadez, V., Sheshshayee, M. S., Sriswathi, M., et al. (2014). Genomewide association studies for 50 agronomic traits in peanut using the ‘reference set' comprising 300 genotypes from 48 countries of the semi-arid tropics of the World. PLoS ONE 9:105228. doi: 10.1371/journal.pone.0105228
Peiffer, J. A., Romay, M. C., Gore, M. A., Flint-Garcia, S. A., Zhang, Z., Millard, M. J., et al. (2014). The genetic architecture of maize height. Genetics 196, 1337–1356. doi: 10.1534/genetics.113.159152
Peng, Y., Hu, Y., Mao, B., Xiang, H., Shao, Y., Pan, Y., et al. (2016). Genetic analysis for rice grain quality traits in the YVB stable variant line using RAD-seq. Mol. Genet. Genomics 291, 297–307. doi: 10.1007/s00438-015-1104-9
Peterson, B. K., Weber, J. N., Kay, E. H., Fisher, H. S., and Hoekstra, H. E. (2012). Double digest RADseq: an inexpensive method for de novo SNP discovery and genotyping in model and non-model species. PLoS ONE 7:e37135. doi: 10.1371/journal.pone.0037135
Petroli, C. D., Sansaloni, C. P., Carling, J., Steane, D. A., Vaillancourt, R. E., Myburg, A. A., et al. (2012). Genomic characterization of DArT markers based on high-density linkage analysis and physical mapping to the Eucalyptus genome. PLoS ONE 7:e44684. doi: 10.1371/journal.pone.0044684
Poland, J. A., Brown, P. J., Sorrells, M. E., and Jannink, J. L. (2012). Development of high-density genetic maps for barley and wheat using a novel two-enzyme genotyping-by-sequencing approach. PLoS ONE 7:e32253. doi: 10.1371/journal.pone.0032253
Qi, Z., Huang, L., Zhu, R., Xin, D., Liu, C., Han, X., et al. (2014). A high-density genetic map for soybean based on specific length amplified fragment sequencing. PLoS ONE 9:e104871. doi: 10.1371/journal.pone.0104871
Qin, H., Feng, S., Chen, C., Guo, Y., Knapp, S., Culbreath, A., et al. (2012). An integrated genetic linkage map of cultivated peanut (Arachis hypogaea L.) constructed from two RIL populations. Theor. Appl. Genet. 124, 653–664. doi: 10.1007/s00122-011-1737-y
Ren, X. P., Zhang, X. J., Liao, B. S., Lei, Y., Huang, J. Q., Chen, Y. N., et al. (2010). Analysis of genetic diversity in ICRISAT mini core collection of peanut (Arachis hypogaea L.) by SSR markers. Sci. Agric. Sin. 43, 2848–2858. doi: 10.3864/j.issn.0578-1752.2010.14.003
Salas, P., Oyarzo-Llaipen, J. C., Wang, D., Chase, K., and Mansur, L. (2006). Genetic mapping of seed shape in three populations of recombinant inbred lines of soybean (Glycine max L. Merr.). Theor. Appl. Genet. 113, 1459–1466. doi: 10.1007/s00122-006-0392-1
Santiago, J. P., and Tegeder, M. (2016). Connecting source with sink: the role of arabidopsis AAP8 in phloem loading of amino acids. Plant Physiol. 171, 508–521. doi: 10.1104/pp.16.00244
Santiago, J. P., and Tegeder, M. (2017). Implications of nitrogen phloem loading for carbon metabolism and transport during Arabidopsis development. J. Integr. Plant Biol. 59, 409–421. doi: 10.1111/jipb.12533
Selvaraj, M. G., Narayana, M., Schubert, A. M., Ayers, J. L., Baring, M. R., and Burow, M. D. (2009). Identification of QTLs for pod and kernel traits in cultivated peanut by bulked segregant analysis. Elect. J. Biotechnol. 12. 1–10. doi: 10.2225/vol12-issue2-fulltext-13
Shi, J., Li, R., Qiu, D., Jiang, C., Long, Y., Morgan, C., et al. (2009). Unraveling the complex trait of crop yield with quantitative trait loci mapping in Brassica napus. Genetics 182, 851–861. doi: 10.1534/genetics.109.101642
Shirasawa, K., Koilkonda, P., Aoki, K., Hirakawa, H., Tabata, S., Watanabe, M., et al. (2012). In silico polymorphism analysis for the development of simple sequence repeat and transposon markers and construction of linkage map in cultivated peanut. BMC Plant Biol. 12:80. doi: 10.1186/1471-2229-12-80
Silva Lda, C., Wang, S., and Zeng, Z. B. (2012). Composite interval mapping and multiple interval mapping: procedures and guidelines for using Windows QTL Cartographer. Methods Mol. Biol. 871, 75–119. doi: 10.1007/978-1-61779-785-9_6
Song, W., Pang, R., Niu, Y., Gao, F., Zhao, Y., Zhang, J., et al. (2012). Construction of high-density genetic linkage maps and mapping of growth-related quantitative trail loci in the Japanese flounder (Paralichthys olivaceus). PLoS ONE 7:e50404. doi: 10.1371/journal.pone.0050404
Sosnowski, O., Charcosset, A., and Joets, J. (2012). BioMercator V3: an upgrade of genetic map compilation and quantitative trait loci meta-analysis algorithms. Bioinformatics 28, 2082–2083. doi: 10.1093/bioinformatics/bts313
Subramanian, V., Gurtu, S., Rao, R. C. N., and Nigam, S. N. (2000). Identification of DNA polymorphism in cultivated groundnut using random amplified polymorphic DNA (RAPD) assay. Genome 43, 656–660. doi: 10.1139/g00-034
Sun, X., Liu, D., Zhang, X., Li, W., Liu, H., Hong, W., et al. (2013). SLAF-seq: an efficient method of large-scale de novo SNP discovery and genotyping using high-throughput sequencing. PLoS ONE 8:e58700. doi: 10.1371/journal.pone.0058700
Tallury, S. P., Hilu, K. W., Milla, S. R., Friend, S. A., Alsaghir, M., Stalker, H. T., et al. (2005). Genomic affinities in Arachis section Arachis (Fabaceae): molecular and cytogenetic evidence. Theor. Appl. Genet. 111, 1229–1237. doi: 10.1007/s00122-005-0017-0
Upadhyaya, H. D., Mukri, G., Nadaf, H. L., and Singh, S. (2012). Variability and stability analysis for nutritional traits in the mini core collection of peanut. Crop Sci. 52, 168–178. doi: 10.2135/cropsci2011.05.0248
van Os, H., Stam, P., Visser, R. G., and van Eck, H. J. (2005). SMOOTH: a statistical method for successful removal of genotyping errors from high-density genetic linkage data. Theor. Appl. Genet. 112, 187–194. doi: 10.1007/s00122-005-0124-y
Varshney, R. K., Bertioli, D. J., Moretzsohn, M. C., Vadez, V., Krishnamurthy, L., Aruna, R., et al. (2009). The first SSR-based genetic linkage map for cultivated groundnut (Arachis hypogaea L.). Theor. Appl. Genet. 118, 729–739. doi: 10.1007/s00122-008-0933-x
Varshney, R. K., Glaszmann, J. C., Leung, H., and Ribaut, J. M. (2010). More genomic resources for less-studied crops. Trends Biotechnol. 28, 452–460. doi: 10.1016/j.tibtech.2010.06.007
Varshney, R. K., Mohan, S. M., Gaur, P. M., Gangarao, N. V. P. R., Pandey, M. K., Bohra, A., et al. (2013). Achievements and prospects of genomics-assisted breeding in three legume crops of the semi-arid tropics. Biotechnol. Adv. 31:1120. doi: 10.1016/j.biotechadv.2013.01.001
Wang, H., Penmetsa, R. V., Yuan, M., Gong, L., Zhao, Y., Guo, B., et al. (2012). Development and characterization of BAC-end sequence derived SSRs, and their incorporation into a new higher density genetic map for cultivated peanut (Arachis hypogaea L.). BMC Plant Biol. 12:10. doi: 10.1186/1471-2229-12-10
Wang, M. L., Sukumaran, S., Barkley, N. A., Chen, Z., Chen, C. Y., Guo, B., et al. (2011). Population structure and marker-trait association analysis of the US peanut (Arachis hypogaea L.) mini-core collection. Theor. Appl. Genet. 123, 1307–1317. doi: 10.1007/s00122-011-1668-7
Wang, S. K., Li, S., Liu, Q., Wu, K., Zhang, J. Q., Wang, S. S., et al. (2015). The OsSPL16-GW7 regulatory module determines grain shape and simultaneously improves rice yield and grain quality. Nat. Genet. 47, 949–954. doi: 10.1038/ng.3352
West, M. A., van Leeuwen, H., Kozik, A., Kliebenstein, D. J., Doerge, R. W., St Clair, D. A., et al. (2006). High-density haplotyping with microarray-based expression and single feature polymorphism markers in Arabidopsis. Genome Res. 16, 787–795. doi: 10.1101/gr.5011206
Wu, Y., Bhat, P. R., Close, T. J., and Lonardi, S. (2008). Efficient and accurate construction of genetic linkage maps from the minimum spanning tree of a graph. PLoS Genet. 4:e1000212. doi: 10.1371/journal.pgen.1000212
Xie, F. T., Niu, Y., Zhang, J., Bu, S. H., Zhang, H. Z., Geng, Q. C., et al. (2014). Fine mapping of quantitative trait loci for seed size traits in soybean. Mol. Breed. 34, 2165–2178. doi: 10.1007/s11032-014-0171-7
Xu, S., and Hu, Z. (2009). Mapping quantitative trait Loci using distorted markers. Int. J. Plant Genomics 2009:410825. doi: 10.1155/2009/410825
Xu, Y., Li, H. N., Li, G. J., Wang, X., Cheng, L. G., and Zhang, Y. M. (2011). Mapping quantitative trait loci for seed size traits in soybean (Glycine max L. Merr.). Theor. Appl. Genet 122, 581–594. doi: 10.1007/s00122-010-1471-x
Yoshizawa, M., O'Quin, K. E., and Jeffery, W. R. (2013). QTL clustering as a mechanism for rapid multi-trait evolution. Commun. Integ. Biol. 6:e24548. doi: 10.4161/cib.24548
Zhang, J., Song, Q., Cregan, P. B., Nelson, R. L., Wang, X., Wu, J., et al. (2015a). Genome-wide association study for flowering time, maturity dates and plant height in early maturing soybean (Glycine max) germplasm. BMC Genomics 16:217. doi: 10.1186/s12864-015-1441-4
Zhang, J., Zhang, Q., Cheng, T., Yang, W., Pan, H., Zhong, J., et al. (2015b). High-density genetic map construction and identification of a locus controlling weeping trait in an ornamental woody plant (Prunus mume Sieb. et Zucc). DNA Res. 22, 183–191. doi: 10.1093/dnares/dsv003
Zhang, Y., Wang, L., Xin, H., Li, D., Ma, C., Ding, X., et al. (2013). Construction of a high-density genetic map for sesame based on large scale marker development by specific length amplified fragment (SLAF) sequencing. BMC Plant Biol. 13:141. doi: 10.1186/1471-2229-13-141
Zhang, Z., Shang, H., Shi, Y., Huang, L., Li, J., Ge, Q., et al. (2016). Construction of a high-density genetic map by specific locus amplified fragment sequencing (SLAF-seq) and its application to Quantitative Trait Loci (QTL) analysis for boll weight in upland cotton (Gossypium hirsutum). BMC Plant Biol. 16:79. doi: 10.1186/s12870-016-0741-4
Zhao, Y., Prakash, C. S., and He, G. (2012). Characterization and compilation of polymorphic simple sequence repeat (SSR) markers of peanut from public database. BMC Res. Notes 5:362. doi: 10.1186/1756-0500-5-362
Zhou, X., Xia, Y., Ren, X., Chen, Y., Huang, L., Huang, S., et al. (2014). Construction of a SNP-based genetic linkage map in cultivated peanut based on large scale marker development using next-generation double-digest restriction-site-associated DNA sequencing (ddRADseq). BMC Genomics 15:351. doi: 10.1186/1471-2164-15-351
Zhu, W. Y., Huang, L., Chen, L., Yang, J. T., Wu, J. N., Qu, M. L., et al. (2016). A high-density genetic linkage map for cucumber (Cucumis sativus L.): based on specific length amplified fragment (SLAF) sequencing and QTL analysis of fruit traits in cucumber. Front. Plant Sci. 7:437. doi: 10.3389/fpls.2016.00437
Keywords: peanut, high-density genetic map, SLAF-seq, QTL analysis, yield
Citation: Wang Z, Huai D, Zhang Z, Cheng K, Kang Y, Wan L, Yan L, Jiang H, Lei Y and Liao B (2018) Development of a High-Density Genetic Map Based on Specific Length Amplified Fragment Sequencing and Its Application in Quantitative Trait Loci Analysis for Yield-Related Traits in Cultivated Peanut. Front. Plant Sci. 9:827. doi: 10.3389/fpls.2018.00827
Received: 18 October 2017; Accepted: 28 May 2018;
Published: 26 June 2018.
Edited by:
Maoteng Li, Huazhong University of Science and Technology, ChinaReviewed by:
Satendra Kumar Mangrauthia, Indian Institute of Rice Research (ICAR), IndiaChunyu Zhang, Huazhong Agricultural University, China
Copyright © 2018 Wang, Huai, Zhang, Cheng, Kang, Wan, Yan, Jiang, Lei and Liao. This is an open-access article distributed under the terms of the Creative Commons Attribution License (CC BY). The use, distribution or reproduction in other forums is permitted, provided the original author(s) and the copyright owner are credited and that the original publication in this journal is cited, in accordance with accepted academic practice. No use, distribution or reproduction is permitted which does not comply with these terms..
*Correspondence: Yong Lei, leiyong@caas.cn
Boshou Liao, lboshou@163.com