Abstract
Background
To evaluate the prognostic value and staging accuracy of the metastatic lymph node ratio (rN) staging system for gastric cancer.
Methods
A total of 1,075 patients with gastric cancer who underwent curative surgery between 2000 and 2009 at our institute were analyzed. Lymph node status was assigned according to the American Joint Committee on Cancer (AJCC) pN system and rN system. Patients with >15 (group 1, n = 691) and ≤15 lymph nodes (group 2, n = 384) retrieved were analyzed separately.
Results
The rN staging system was generated using 0.2 and 0.5 as the cutoff values of lymph node ratio and then compared with AJCC pN stages. A linear regression model revealed that the number of retrieved lymph nodes was related to the number of metastatic lymph nodes, but not with rN. After a median follow-up of 47.66 months, the 5-year survival rates of N0, N1, N2, and N3 patients of group 1 were significantly better than group 2, whereas the differences were not obvious in the rN classification.
Conclusions
The rN category is a better prognostic tool than the AJCC pN category for gastric cancer patients after curative surgery regardless of the number of lymph node examined.
Introduction
Gastric cancer is the fourth most common cancer in the world. More than 70 % of new cases and deaths occur in developing countries, and most cases occur in Eastern Asia [1]. Nowadays, the TNM system has become the principal method for assessing the prognosis of gastric cancer patients. Lymph node metastasis is one of the most important prognostic factors for gastric cancer, and accurate categorization of lymph node metastasis is critical for subsequent therapies after surgery. [2] In the 4th edition of the AJCC pN classification system, pN is classified based on the anatomic location of involved lymph nodes, whereas in the 5th and 6th editions, pN is classified based on the number of involved lymph nodes (LNs). Recently, AJCC revised and published the 7th edition of the TNM classification for gastric cancer [3, 4] According to the 7th TNM classification, the N stage was categorized to N0 (no regional LNs metastasis), N1 (1–2 involved regional LNs), N2 (3–6 involved regional LNs), N3a (7–15 involved regional LNs), and N3b (>15 involved regional LNs). [4].
Up to now, the classification of N stage has still been controversial. When utilizing the N staging system, >15 retrieved lymph nodes are required for optimal staging. In fact, many population-based studies of gastric cancer have found that surgeons and pathologists failed to accomplish even basic lymph node staging [5–7]. Coburn et al. reported that only 29 % of patients with gastric cancer had 16 lymph nodes examined after analyzing 10,807 cases of resected gastric cancer in the Surveillance Epidemiology and End Results database [8].
If the number of retrieved lymph nodes is insufficient, stage migration will be observed in 10–15 % of cases [9, 10]. The stage migration phenomenon, also called Will Rogers phenomenon [11], is used to describe the phenomenon of understaging resulting from examining insufficient lymph nodes. Many reporters believed that the rN staging had significant superiority in minimizing stage migration regardless of the type of lymphadenectomy or the number of LNs retrieved.
The aim of our present study is to identify the best classification of lymph node for improving the survival prediction of gastric cancer patients following curative resection in an Eastern high-volume gastric cancer center.
Patients and methods
A total of 1,337 patients underwent a potentially curative operation for gastric cancer at the Department of General Surgery, the Affiliated Hospital of Qingdao University Medical College, from 2000 to 2009. The standard surgical strategy includes D2 lymphadenectomy for advanced gastric cancer and D1 + beta or more lymphadenectomy for early gastric cancer. Clinical and histopathological data were classified according to the Japanese Classification of Gastric Carcinoma (JCGC) [12].These dissected lymph nodes were classified by surgeons based on the JCGC after surgery. We excluded 21 patients for reasons of recurred or remnant gastric cancer, 145 patients for residual tumor or distant metastasis, 7 patients for synchronous malignancy, 10 patients for missing pathological data, and 4 patients who died within 30 days after operation. Because intramucosal malignancy is fundamentally devoid of metastasis, the authors excluded 75 patients with intramucosal malignancy for analysis. Following these exclusions, a total of 1,075 patients were enrolled into this study. No patients received neoadjuvant chemotherapy. The standard protocols for adjuvant therapy after surgery are 5-FU plus oxaliplatin-based chemotherapy regimens over 6 months.
The patients were reexamined every 3 months for the first 2 years after operation, every 6 months for the following 3 years, and once every year thereafter. The reexamination included gastroscopy, abdominal computed tomography, and detection of CEA, CA199, and CA724. The patients were followed up by telephone, short messages, and outpatient visits, starting from the day they were discharged. Deaths from postoperative complications, recurrence, other disease, or accidents were regarded as censored data.
The database included (1) age at surgery, (2) gender, (3) tumor location, (4) tumor size, (5) histological grade, (6) type of gastrectomy, (7) depth of primary tumor invasion, (8) number of lymph nodes involved, and (9) metastatic lymph node ratio.
According to the number of examined lymph nodes, all reviewed patients were divided into two groups. Group 1 consisted of 691 patients with more than 15 lymph nodes examined, and group 2 consisted of 384 patients with 15 nodes or fewer examined.
Statistical analysis
The survival curves and 95 % confidence intervals were generated from observed survival times using the Kaplan–Meier method. The significance of the difference in the survival rate was determined by the log-rank test. Factors that were deemed of potential importance on univariate analyses (P < 0.05) were included in the multivariate analyses. Multivariate analysis of disease-free survival was performed by means of the Cox proportional hazards model, using the forward logistics regression (LR) stepwise procedure for variable selection.
Spearman’s correlation coefficient with the two-tailed test was used to assess the correlation between the number of LNs retrieved and metastatic lymph node ratio. A linear regression analysis was performed to evaluate the relationship between the number of lymph nodes retrieved and the number involved.
The accepted level of significance was P < 0.05. SPSS statistical software (version 16.0) was used to generate these analyses.
Results
Clinicopathological parameters of patients
Clinical and pathological data of group 1 and group 2 with the 5-year survival rates are summarized in Tables 1 and 2, respectively. The median follow-up after surgery was 47.66 months (range, 0.87–121.36 months) for all patients (n = 1,075). In group 1, the median follow-up was 47.25 months (range, 0.87–120.31 months) for all patients (n = 691). In group 2, the median follow-up was 48.80 months (range, 4–121.36 months) for all patients (n = 384).
Metastatic lymph nodes ratio classification
Figure 1 shows the observed 5-year survival rates with 95 % confidence intervals in relationship to the metastatic lymph node ratio at intervals of 5 %. We separated the population into four subgroups with remarkably different survival rates. The best-fit cutoff values of the rN were set at rN0 (0.00), rN1 (0.01–0.20), rN2 (0.21–0.50), and rN3 (≥0.50). Other cutoff points were also evaluated. However, significant differences in survival rates and the optimal distribution of patients across the four groups were observed only when the aforementioned cutoff points were used.

Observed 5-year survival rates depending on the metastatic lymph node ratio. Error bar shows 95 % confidence intervals
It was calculated that 161 patients (23.3 %) was restaged in group 1 and 56 patients (14.6 %) was restaged in group 2 according to the metastatic lymph nodes ratio classification.
Univariate and multivariate survival analysis
In group 1, with the univariate analysis, nine factors were found to have statistically significant associations with overall survival of gastric cancer patients after curative surgery (Table 1): age at surgery, gender, tumor location, tumor size, histological type, type of gastrectomy, depth of invasion, number of metastatic lymphatic nodes, and metastatic lymph node ratio. In group 2, seven factors were found to have significant associations with overall survival of gastric cancer patients after curative surgery (Table 2): tumor location, tumor size, histological type, type of gastrectomy, depth of invasion, number of metastatic lymphatic nodes, and metastatic lymph node ratio. Multivariate analysis was performed to determine the independent prognostic factors among those that were found by univariate analysis to be significantly associated with survival. When multivariate analysis was performed including the pN and rN staging systems, the best prognostic determinant was rN, and depth of invasion followed by the type of gastrectomy both in group 1 and in group 2.
Correlation analysis between lymph nodes retrieved and rN classification
Of 59 patients classified as T1 category, only 6 patients had lymph node metastasis. Thus, we chose more advanced T2/T3 and T4a patients for the analysis. For T2/T3 and T4a patients (n = 1,001), Spearman correlation analysis showed that the number of retrieved lymph nodes was correlated well with the number of positive lymph nodes (P < 0.001), but there was no correlation with metastatic lymph node ratio (P = 0.221 and 0.980, respectively). With all the patients included, the linear regression analysis showed that the number of metastatic lymph nodes increased with the number of retrieved lymph nodes (slope coefficient = −0.263, P < 0.001) (Fig. 2a). However, the pattern of the rN stage scatter graph according to the number of retrieved lymph nodes uncovered the nonlinear relationship between the number of retrieved lymph nodes and rN. The distribution of rN classification was relatively constant (slope coefficient = 0.069, P = 0.039) (Fig. 2b). Nevertheless, R 2 (goodness-of-fit) indicators of both Fig. 2a and Fig. 2b were fairly low.

a Linear regression plotted for the number of analyzed and metastatic nodes in all patients (R = −0.263; P ≤ 0.001). b Linear regression plotted for the number of analyzed and metastatic LN ratio in all patients (R = 0.049; P = 0.131)
Prognosis analysis according to number-based and ratio-based lymph node classification
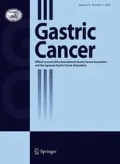
Because the N0 classification is identical in the AJCC pN and proposed rN stage system, we selected the lymph node-positive patients for prognostic evaluation using the two staging systems. In survival analysis of T2/T3 patients according to the pN system, the survival rates of group 1 were significantly different from those of group 2 in subgroup N1 (76.0 % vs. 59.0 %, P = 0.035), N2 (69 % vs. 43 %, P = 0.06), and N3 classification (29 % vs. 17 %, P = 0.01). However, the rN system could discriminate subsets of patients with similar prognosis. The differences between group 1 and group 2 in rN1, rN2, and rN 3 classifications were not significant (P = 0.182, 0.494, and 0.235, respectively). The phenomenon could also be observed in T4a patients, except for rN2 in T4a patients (P = 0.045) (Table 3). The AJCC published the 7th edition TNM classification for gastric cancer last year, but there has still been controversy about the cutoff value of the pN staging [13, 14]. Thus, we included both the 6th and 7th edition pN classifications for the analysis. Figure 3 shows the observed 5-year survival rates with 95 % confidence intervals for patients in AJCC pN categories in comparison with those of the rN classification; overlapping was observed in the pN categories (both 6th and 7th editions). In contrast, no overlapping could be observed in the rN category.

Comparisons of observed 5-year survival rates between traditional AJCC pN classification and proposed rN classification. Error bars show 95 % confidence intervals
Discussion
Accurate staging of gastric cancer is of great importance in clinical practice, especially when adjuvant treatment is considered. With an insufficient number of lymph nodes retrieved, the prognosis of the patient will be underestimated because of inappropriate staging in the AJCC N staging system. It was estimated that 23.3 % and 14.6 % would be restaged in group 1 and group 2, respectively.
In the present study, we investigated the prognostic value of the rN staging system in the patients who underwent curative resection for gastric cancer. The Cox multivariate analysis showed that rN has a prognostic value independent of the extent of lymphadenectomy. Many previous reports used Cox multivariate examinations, including both pN stage and rN stage, for proving the superiority of the LN ratio system [9, 15–20]. The pN and rN systems, two definitions of classifications for staging lymph node status, were highly correlated. When there are two highly correlated variables in the same model, there is a strong probability that one would be excluded from stepwise analysis because of multicollinearity, not superiority [21].
According to linear regression analysis of all the patients, the number of metastatic lymph nodes increased with the number of lymph nodes removed (slope = −0.263, P < 0.001) (Fig. 2a). Thus, some patients classified as N0 stage would have turned out to be lymph node positive and N1 stage would have turned out to be N2 or even N3 if more lymph nodes had been examined. This finding indicated that a minimum number of lymph nodes should be retrieved to ensure appropriate staging according to pN classification. If not, downstaging might occur as a result of positive node residuals.
In survival analysis, when the number of patients with 15 nodes or fewer retrieved was compared with that of patients with more than 15 nodes, the differences of survival rates were significant in the AJCC pN system, but not in the rN staging system. This finding indicated if an insufficient number of lymph nodes was examined, the prognostic power of the AJCC pN system would be greatly affected.
More than 15 nodes are required for the adoption of the current numeric AJCC N staging system in previous reports. However, a retrospective survival analysis of prospectively collected data of 8,949 patients who underwent R0 resection of gastric cancer in Seoul indicated that the minimum of 16 LNs required cannot be enough for accurate staging because the proportion of advanced N stage cases substantially increases as the number of retrieved LNs increases [10]. It may be that the standardization of surgery and the effort to find all the possible LNs are necessary for accurate pN staging.
To evaluate the rN staging system, some previous reports excluded patients with fewer than 16 LNs retrieved [16, 20, 22]; some researchers preferred the patients treated by limited lymphadenectomy, [9, 10, 18, 23]; and some centers evaluated the rN system as an independent prognostic factor in gastric cancer regardless of the type of lymphadenectomy, or in both >15 and ≤15 LNs examined [17, 19, 24, 25], as we did in our report. All the reports indicated that the rN staging system has superiority in prognosis assessment compared with the traditional AJCC pN system.
However, there is much controversy regarding the most appropriate cutoff ratio because the ratios differ among investigators. The following cutoff values have been proposed: 0, 0.20, 0.50 [10, 24], 0, 0.30, 0.60 [15, 25], 0, 0.10, 0.25 [9, 16, 20], 0, 0.30, 0.70 [17], 0, 0.015, 0.40 [23], 0, 0.10, 0.25 [19], 0, 0.25, 0.50 [18], and 0, 0.10, 0.40 [22]. The cutoff values showed great variety in different countries, even in different centers in the same country. These discrepancies can be explained by small patient populations, variety in the percentage of early to advanced stage, differences in the selection of patients, and also differences in the histopathological methods of lymph node examination. Thus, the effort to find the optimal cutoff value is necessary to popularize the global usage of the rN system.
The current study is based on the data of a retrospective study with standardized surgical resection, standardized histopathological evaluation of the specimens, and strict eligibility criteria. It was discovered that the metastatic lymph node ratio remained constant whether the number of lymph nodes retrieved did or did not meet the criteria required. The best cutoffs for the rN staging system would be 0.2 and 0.5. The prognosis in patients classified by number of LNs involved was lack of homogeneity. The cumulative survival rates were highly homogeneous in patients classified by the metastatic lymph node ratio.
In the present study, there are certain limitations. First, the defined rN3 subclassification had only 11.4 % of patients in this study. In addition, R-square indicators of Fig. 2a, b were fairly low. Thus, the conclusions still need further study with an analysis of a large group of patients. Second, the authors proposed the rN staging classification. Unfortunately, we did not validate our proposed classification system with another dataset. Third, for reasons of cost, micrometastasis was not routinely investigated in the present study.
In the presence of divergence between Eastern and Western gastric cancer centers, the proposed rN classification is superior to the AJCC pN classification in minimizing stage migration. Thus, the application of ratio classification in the prognostic assessment in gastric cancer patients is strongly recommended for global usage.
References
Jemal A, Bray F, Melissa M, Ferlay J, Ward E, Forman D. Global cancer statistics 2011. CA Cancer J Clin. 2011;61:69–90.
Manfe AZ, Segalina P, Maffei Faccioli A. Prognostic factors in gastric cancer. Our experience and review of the literature. Minerva Chir. 2000;55:299–305.
Greene FL, Page DL, Fleming ID. AJCC cancer staging manual: TNM classification of malignant tumors. 6th ed. New York: Springer; 2002.
Edge SB, Byrd DR, Compton CC. AJCC cancer staging handbook. 7th ed. New York: Springer; 2010.
Estes NC, MacDonald JS, Touijer K, Benedetti J, Jacobson J. Inadequate documentation and resection for gastric cancer in the United States: a preliminary report. Am Surg. 1998;64:680–5.
Macdonald JS, Smalley SR, Benedetti J, Hundahl SA, Estes NC, Stemmermann GN, et al. Chemoradiotherapy after surgery compared with surgery alone for adenocarcinoma of the stomach or gastroesophageal junction. N Engl J Med. 2001;345:725–30.
Kooby DA, Suriawinata A, Klimstra DS, Brennan MF, Karpeh MS. Biologic predictors of survival in node-negative gastric cancer. Ann Surg. 2003;237:828–35.
Coburn NG, Swallow CJ, Kiss A, Law C. Significant regional variation in adequacy of lymph node assessment and survival in gastric cancer. Cancer (Phila). 2006;107:2143–51.
Bando E, Yonemura Y, Taniguchi K, Fushida S, Fujimura T, Miwa K. Outcome of ratio of lymph node metastasis in gastric carcinoma. Ann Surg Oncol. 2002;9:775–84.
Kong SH, Lee HJ, Ahn HS, Kim JW, Kim WH, Lee KU, et al. Stage migration effect on survival in gastric cancer surgery with extended lymphadenectomy. Ann Surg. 2011;00:1–9.
Feinstein AR, Sosin DM, Wells CK. The Will Rogers phenomenon. Stage migration and new diagnostic techniques as a source of misleading statistics for survival in cancer. N Engl J Med. 1985;312:1604–8.
Ahn HS, Lee HJ, Hahn S, Kim WH, Lee KU, Sano T, et al. Evaluation of the seventh American Joint Committee on Cancer/International Union Against Cancer Classification of gastric adenocarcinoma in comparison with the sixth classification. Cancer (Phila). 2010;11:5592–8.
Jung H, Lee HH, Song KY, Jeon HM, Park CH. Validation of the seventh edition of the American joint committee on cancer TNM staging system for gastric cancer. Cancer (Phila) 2011 (Epub ahead of print).
Japanese Gastric Cancer Association. Japanese classification of gastric carcinoma, 2nd English edition. Gastric Cancer. 1998;1:10–24.
Kim CY, Yang DH. Adjustment of N stages of gastric cancer by the ratio between the metastatic and examined lymph nodes. Ann Surg Oncol. 2009;16:1868–74.
Xu DZ, Geng QR, Long ZJ, Zhan YQ, Li W, Zhou ZW, et al. Long positive lymph node ratio is an independent prognostic factor in gastric cancer after D2 resection regardless of the examined number of lymph nodes. Ann Surg Oncol. 2009;16:319–26.
Maduekwe UN, Lauwers GY, Fernandez-Del-Castillo C, Berger DL, Ferguson CM, Rattner DW, Yoon SS. New metastatic lymph node ratio system reduces stage migration in patients undergoing D1 lymphadenectomy for gastric adenocarcinoma. Ann Surg Oncol. 2010;17:1267–77.
Inoue K, Nakane Y, Iiyama H, Sato M, Kanbara T, Nakai K, et al. The superiority of ratio-based lymph node staging in gastric carcinoma. Ann Surg Oncol. 2002;1:27–35.
Marchet A, Mocellin S, Ambrosi A, Morgagni P, Garcea D, Marrelli D, et al. The ratio between metastatic and examined lymph nodes (N ratio) is an independent prognostic factor in gastric cancer regardless of the type of lymphadenectomy. Ann Surg. 2007;245:543–52.
Pedrazzani C, Sivins A, Ancans G, Marrelli D, Corso G, Krumins V, et al. Ratio between metastatic and examined lymph nodes (N ratio) may have low clinical utility in gastric cancer patients treated by limited lymphadenectomy: results from a single-center experience of 526 patients. World J Surg. 2010;34:85–91.
Wang X, Wan F, Wang J. A common misuse of stepwise regression in studies of ratio of metastatic lymph nodes for gastric cancer. Ann Surg Oncol. 2008;15:1805–6.
Kulig J, Sierzega M, Kolodziejczyk P, Popiela T. Ratio of metastatic to resected lymph nodes for prediction of survival in patients with inadequately staged gastric cancer. Br J Surg. 2009;96:910–8.
Persiani R, Rausei S, Antonacci V, Biondi A, Casella F, Ciccoritti L, et al. Metastatic lymph node ratio: a new staging system for gastric cancer. World J Surg. 2009;33:2106–11.
Sun Z, Zhu GL, Lu C, Guo PT, Huang BJ, Li K, et al. The impact of N-ratio in minimizing stage migration phenomenon in gastric cancer patients with insufficient number or level of lymph node retrieved: results from a Chinese mono-institutional study in 2159 patients. Ann Oncol. 2009;20:897–905.
Wang W, Xu DZ, Li YF, Guan YX, Sun XW, Chen YB, et al. Tumor-ratio-metastasis staging system as an alternative to the 7th edition UICC TNM system in gastric cancer after D2 resection—results of a single institution study of 1343 Chinese patients. Ann Oncol. 2011;22:2049–56.
Acknowledgments
We gratefully thank Prof. Xiao-bing Zhou for statistical analysis assistance.
Conflict of interest
The authors have nothing to disclose.
Author information
Authors and Affiliations
Corresponding author
Rights and permissions
About this article
Cite this article
Zhou, Y., Zhang, J., Cao, S. et al. The evaluation of metastatic lymph node ratio staging system in gastric cancer. Gastric Cancer 16, 309–317 (2013). https://doi.org/10.1007/s10120-012-0190-1
Received:
Accepted:
Published:
Issue Date:
DOI: https://doi.org/10.1007/s10120-012-0190-1