

Detection of the Severity Level of Depression Signs in Text Combining a Feature-Based Framework with Distributional Representations


Intelligent Systems Group, Telematic Systems Engineering Department, Universidad Politécnica de Madrid, Avenida Complutense 30, 28040 Madrid, Spain
*
Author to whom correspondence should be addressed.
Appl. Sci. 2023, 13(21), 11695; https://doi.org/10.3390/app132111695
Submission received: 15 August 2023
/
Revised: 29 September 2023
/
Accepted: 23 October 2023
/
Published: 26 October 2023
(This article belongs to the Special Issue Novel Approaches for Natural Language Processing)
Abstract
:Depression is a common and debilitating mental illness affecting millions of individuals, diminishing their quality of life and overall well-being. The increasing prevalence of mental health disorders has underscored the need for innovative approaches to detect and address depression. In this context, text analysis has emerged as a promising avenue. Novel solutions for text-based depression detection commonly rely on deep neural networks or transformer-based models. Although these approaches have yielded impressive results, they often come with inherent limitations, such as substantial computational requirements or a lack of interpretability. This work aims to bridge the gap between substantial performance and practicality in the detection of depression signs within digital content. To this end, we introduce a comprehensive feature framework that integrates linguistic signals, emotional expressions, and cognitive patterns. The combination of this framework with distributional representations contributes to fostering the understanding of language patterns indicative of depression and provides a deeper grasp of contextual nuances. We exploit this combination using traditional machine learning methods in an effort to yield substantial performance without compromising interpretability and computational efficiency. The performance and generalizability of our approach have been assessed through experimentation using multiple publicly available English datasets. The results demonstrate that our method yields throughput on par with more complex and resource-intensive solutions, achieving F1-scores above 70%. This accomplishment is notable, as the proposed method simultaneously preserves the virtues of simplicity, interpretability, and reduced computational overhead. In summary, the findings of this research contribute to the field by offering an accessible and scalable solution for the detection of depression in real-world scenarios.
1. Introduction
Depression is a persistent and pressing challenge within contemporary society that presents itself as a significant public health concern. The prevalence of this mental illness continues to increase, exerting profound effects on individuals and communities alike [1].
According to the World Health Organization (WHO) [2], around 280 million people of all ages suffer from depression worldwide. Depressive disorder encompasses a wide array of distressing symptoms that can profoundly impact an individual’s well-being and functioning. These symptoms can involve persistent sadness, fatigue, difficulty concentrating, and feelings of hopelessness, among others [3]. Such symptoms lead to a heavy burden that includes reduced productivity, impaired social functioning, increased healthcare costs, and a higher risk of comorbidity. Furthermore, depression is one of the leading causes of disability and is associated with a higher risk of suicide [4].
The far-reaching impact of depression underscores the urgent need for innovative and effective approaches to its comprehensive detection and treatment. This has become an essential priority and has increased mental health promotion initiatives focused on detecting, preventing, and treating depression [5]. However, self-denial and poor recognition of the problem may cause a significant number of individuals to remain undiagnosed or avoid seeking timely treatment [6]. Depression assessment has traditionally relied on self-report measures [7,8] to measure individuals’ depressive symptoms and severity. Although these methods have shown validity, their frequent delay in diagnosis and inherent bias caused by their subjectivity and dependence on subjects’ recall usually become notable limitations [9].
Remarkable progress in the field of artificial intelligence presents a promising avenue to overcome these drawbacks and enhance the accuracy and efficacy of depression detection and monitoring [10]. Popular approaches that benefit from this progress include the analysis of physiological signals [11], facial expression [12], or speech [13,14]. Although the reliability of these methods has been proven [15], their implementation in real-life settings often requires costly and obtrusive sensing equipment.
This challenge has encouraged research on more economical and unobtrusive solutions. Text analysis and natural language processing (NLP) technologies have created numerous opportunities to detect depression by taking advantage of the vast amounts of textual data generated through digital platforms and online communication [16]. These platforms serve as a rich source of freely shared thoughts and feelings, allowing researchers to explore diverse dimensions of psychological concerns and human behavior [17].
The use of digital content to identify people with depression has potential applications in disease surveillance and the provision of timely expert support [18]. The most popular approaches in the literature are based on the use of feature extraction methodologies to represent texts as vectors in a feature space [19]. These vectors are then fed into machine learning algorithms to classify the text. However, the difficulty in identifying appropriate sets of characteristics coupled with generalization problems prevalent in traditional machine learning algorithms led to the use of more complex methods [20]. Novel approaches, such as the use of deep neural networks and transformer-based models, have emerged to overcome these limitations. While these methods offer huge potential, they pose challenges such as the need for large amounts of data or increased computational demands [21]. Additionally, its black-box nature may raise concerns about model interpretability and transparency [20], which are crucial considerations in applications related to mental health promotion [22].
The ongoing research efforts aim to strike a balance between the advantages of traditional and modern methodologies, capitalizing on their respective strengths. The aim of this paper is to advance the field of text depression detection with an approach that yields remarkable performance while preserving explainability and low computational costs. To this aim, we propose a method based on traditional machine learning methods that exploit a combination of lexicon-based features and distributional representations. Therefore, we focus on the following research questions (RQs) concerning the task of detecting depression from text:
- RQ1: Can traditional machine learning methods achieve substantial performance and demonstrate robust generalizability when evaluated on multiple corpora?
- RQ2: Which types of lexicon-based features provide better insights into key language patterns indicative of depression?
- RQ3: What is the most effective combination of distributional representation techniques and lexicon-based features?
Motivated by these research questions, we introduce a comprehensive lexicon-based feature framework for the detection of depression in text. Such a framework facilitates the organization of textual characteristics, integrating linguistic signals, emotional expressions, and cognitive patterns to provide a holistic understanding of language indicators associated with depression. To this end, a vast number of features were extracted and organized into four sets: affective, syntactic, social, and topic-related. Furthermore, our research delves into the exploration of various distributional representation methods, seeking to identify the most practical combination of word embeddings with lexicon-based features to optimize depression detection performance. We thoroughly investigate widely adopted techniques such as FastText and recent approaches such as transformer-based word embeddings.
The proposed approaches are evaluated and compared with state-of-the-art methods through experimentation using two public English datasets. The results reveal that combining the presented framework with distributional representations exhibits a performance comparable to transformer-based models such as BERT or MentalBERT, showcasing the effectiveness and competitiveness of our approach. Additionally, the relevance of our experiments is further confirmed through a statistical study, allowing us to comprehensively analyze the performance of our solution.
The remainder of the paper is structured as follows. Section 2 provides an overview of the relevant literature in the field of depression detection from textual data. In Section 3, we detail the datasets used, the proposed feature framework, and the depression detection models. The experimental setup to evaluate the proposed models is described in Section 4, along with the presentation of the results obtained. Section 5 offers a comprehensive discussion of the main findings of this study. Finally, we conclude the paper in Section 6, presenting the conclusions drawn from our work and highlighting the potential avenues for future research.
2. Related Work
The rapid growth in the number of social media users, coupled with notable advances in natural language processing (NLP) and text mining technologies, has opened up new opportunities for mental health analysis [23,24]. Social media platforms serve as valuable sources of large-scale and real-time data, offering insight into individuals’ mental well-being, emotional states, and experiences [25]. Researchers have increasingly turned their attention to the wealth of textual data shared on these platforms to automatically detect signs of mental health issues such as depression, anxiety, and stress [26,27]. These automated approaches have the potential to complement traditional methods of mental health evaluation, providing timely and cost-effective ways to identify people at risk and offer the necessary support and interventions. This has ignited significant research interest in exploring novel and innovative approaches to analyze textual data for signs of depression [28].
The detection of depression from textual data can be framed as a text classification problem, aiming to differentiate texts based on the presence or absence of signs of depression. Depression detection methods have predominantly approached the task as a binary classification problem, that is, determining whether users are depressed or not [29]. However, the nature of depression is diverse, with varying severity levels that encompass minimal, mild, moderate, and severe cases [7]. This has increased the research on novel data collection and approaches that consider the multifaceted nature of depression [30,31]. In recent years, the number of works that aim to capture the varying degrees of intensity in depression is increasing consistently [20,32,33,34].
Regarding the techniques used, early approaches relied on lexicon-based feature extraction to capture specific linguistic patterns associated with depressive language [35]. These features are extracted from posts and then used to train traditional machine learning algorithms [36,37]. Although these methods provide valuable insights, they face challenges related to lexicon coverage, language nuances, and generalizability. The advent of word embeddings brought significant improvements to address these challenges. Word embeddings, such as Word2Vec [38], Global Vectors for Word Representation (GloVe) [39] and FastText [40] represent words as dense and continuous vectors in a high-dimensional space that capture semantic and syntactic relationships. Researchers have leveraged these representations to develop more robust and context-aware models to identify depression [41]. These techniques provided a more nuanced and context-aware representation of words, enhancing the ability to identify subtle variations in language associated with depression. However, they do not take advantage of the individual affective or social value of words.
Combining word embeddings with lexicon-based features helps to address this limitation, producing more robust and comprehensive representations of textual data [42]. This fusion benefits from domain-specific insights and interpretability from lexicon-based features while retaining the underlying semantic and contextual information provided by word embeddings. Moreover, traditional machine-learning approaches have gradually been surpassed by more sophisticated techniques. Deep neural networks such as the recurrent neural network (RNN) [43], long–short-term memory (LSTM) [44,45], and bidirectional gated recurrent unit (BGRU) [46] have shown notable performance in the detection of depression.
More recently, the field has witnessed a significant shift towards transformer-based models, especially with the introduction of models such as bidirectional encoder representations from transformers (BERT) [47]. These models can contextually encode the entire post, capturing the interaction of words and their meanings, resulting in more accurate and nuanced predictions in various Natural Language Processing (NLP) tasks, including depression detection [33]. Such models have also been used to extract emotional linguistic indicators and evaluate their strength as predictors of depression [48]. Furthermore, domain-specific language models have emerged that introduce domain-related knowledge for mental healthcare, such as MentalBERT [49]. Despite the enormous potential these methods have, they often require extensive datasets and increased computational resources [21]. Moreover, its inherent black-box nature can raise concerns about the interpretability and transparency of models [20], which are vital aspects to consider in applications related to the promotion of mental health [22].
Our work aims to strike a balance between the advantages of traditional and modern methodologies, capitalizing on their respective strengths. To this aim, we propose an approach using traditional machine learning methods to exploit the combination of lexicon-based features with transformer-based word embeddings. Transformer-based word embeddings enable the generation of context-aware distributional representations, generating distinct embeddings for the same word depending on the context in which it appears [50]. We expect the combination of these embeddings with lexicon-based features to result in a robust and interpretable model that retains low computational requirements. Therefore, our work advances the state of the art in the detection of severity signs of depression in textual data through: (i) a comprehensive lexicon-based feature framework that facilitates the organization and characterization of textual features incorporating affective, syntactic, social, and topic-related features; (ii) three distinct machine learning models that leverage the comprehensive feature framework and its combination with context-aware distributional representations; and (iii) the evaluation of the proposed models through experimentation using two publicly available English datasets.
3. Materials and Methods
This section presents the proposed approach along with the data utilized in this work. First, we describe the datasets used for the depression detection task. Second, we introduce the proposed feature framework aimed at capturing key aspects of textual data related to depression. Finally, we elaborate on the depression detection models.
3.1. Data
For the evaluation phase, we used two publicly available English-language datasets dedicated to the detection of the severity of depression. These datasets, namely, the depression severity dataset (DsD) [30] and the depression signs detection dataset (DepSign) [31], were collected from the Reddit social network. In the following lines, we provide detailed descriptions of these datasets and pertinent statistics drawn from their respective contents.
- Depression severity dataset. This dataset was constructed by augmenting a publicly available Reddit dataset [51]. Each post was annotated by two annotators using the depressive DDA scheme [52] and then categorized into one depression severity level following the depression rating scale [53]. The dataset results in 3553 posts in four depression severity levels: minimal (2587 posts), mild (290 posts), moderate (394 posts), and severe forms of depression (282 posts).
- Depression signs detection dataset. This dataset comprises English posts from the depression and mental health Reddit subgroups. Two domain experts annotated the data based on signs of depression, assigning each post one of three severity levels. The authors of [32] eliminated duplicates to create the final dataset utilized in this article, which consists of 10,251 posts in three depression severity levels: not depressed (3503 posts), moderate depression (5780 posts), and severe depression (968 posts).
The same pre-processing procedures were employed in all datasets: expansion of contractions (e.g., It’s, we’ll), conversion of chat words (e.g., AFAIK, ASAP), and spell checking. Table 1 provides an overview of the datasets used in this study, including a concise summary of the key statistics.
The datasets differ notably in terms of size, textual characteristics, and label distribution. Posts in DsD have an average word count of 88 words and an average character count of 442 characters per post. On the other hand, DepSign posts feature a higher average word count of 171 words and an average character count of 840 characters per post. These differences in text length could affect the task of depression detection, as longer posts on DepSign might contain more detailed and subtle expressions of emotions and thoughts. Furthermore, the distribution of labels in DsD spans four levels of severity of depression, while DepSign has only three distinct labels with varying post counts for each category.
3.2. A Feature Framework for Depression Detection from Text
In this section, we describe a feature framework designed to facilitate the systematic organization and characterization of textual characteristics for the purpose of detecting depression. This framework is based on a previously designed stress framework [26] but was extended and adapted for its use in the depression detection context.
To build a comprehensive framework that facilitates the identification of appropriate feature sets, we have used established lexicons and text analysis methodologies to extract a vast amount of features from the text. Most of these features were extracted from a set of distinct lexicons using SEANCE [54]. This tool enables the automatic analysis of affective and social values in text using the following lexicons: General Inquirer (GI) [55], Lasswell [56], Geneva Affect Label Coder (GALC) [57], Affective Norms for English Words (ANEW) [58], EmoLex [59], SenticNet [60], Valence Aware Dictionary for Sentiment Reasoning (VADER) [61], and Hu-Liu [62].
Furthermore, the proposed framework incorporates Linguistic Inquiry and Word Count (LIWC) [63], a widely recognized lexicon-based tool that provides comprehensive scores for psychologically relevant categories, including, but not limited to, joy, sadness, and specific cognitive processes. Finally, a broad set of readability measures were incorporated using the Python Readability library [64]. This library offers traditional readability measures (that is, Automated Readability Index (ARI) [65] and Simple Measure of Gobbledygook (SMOG) [66] indexes) based on the number of words, syllables, and sentences.
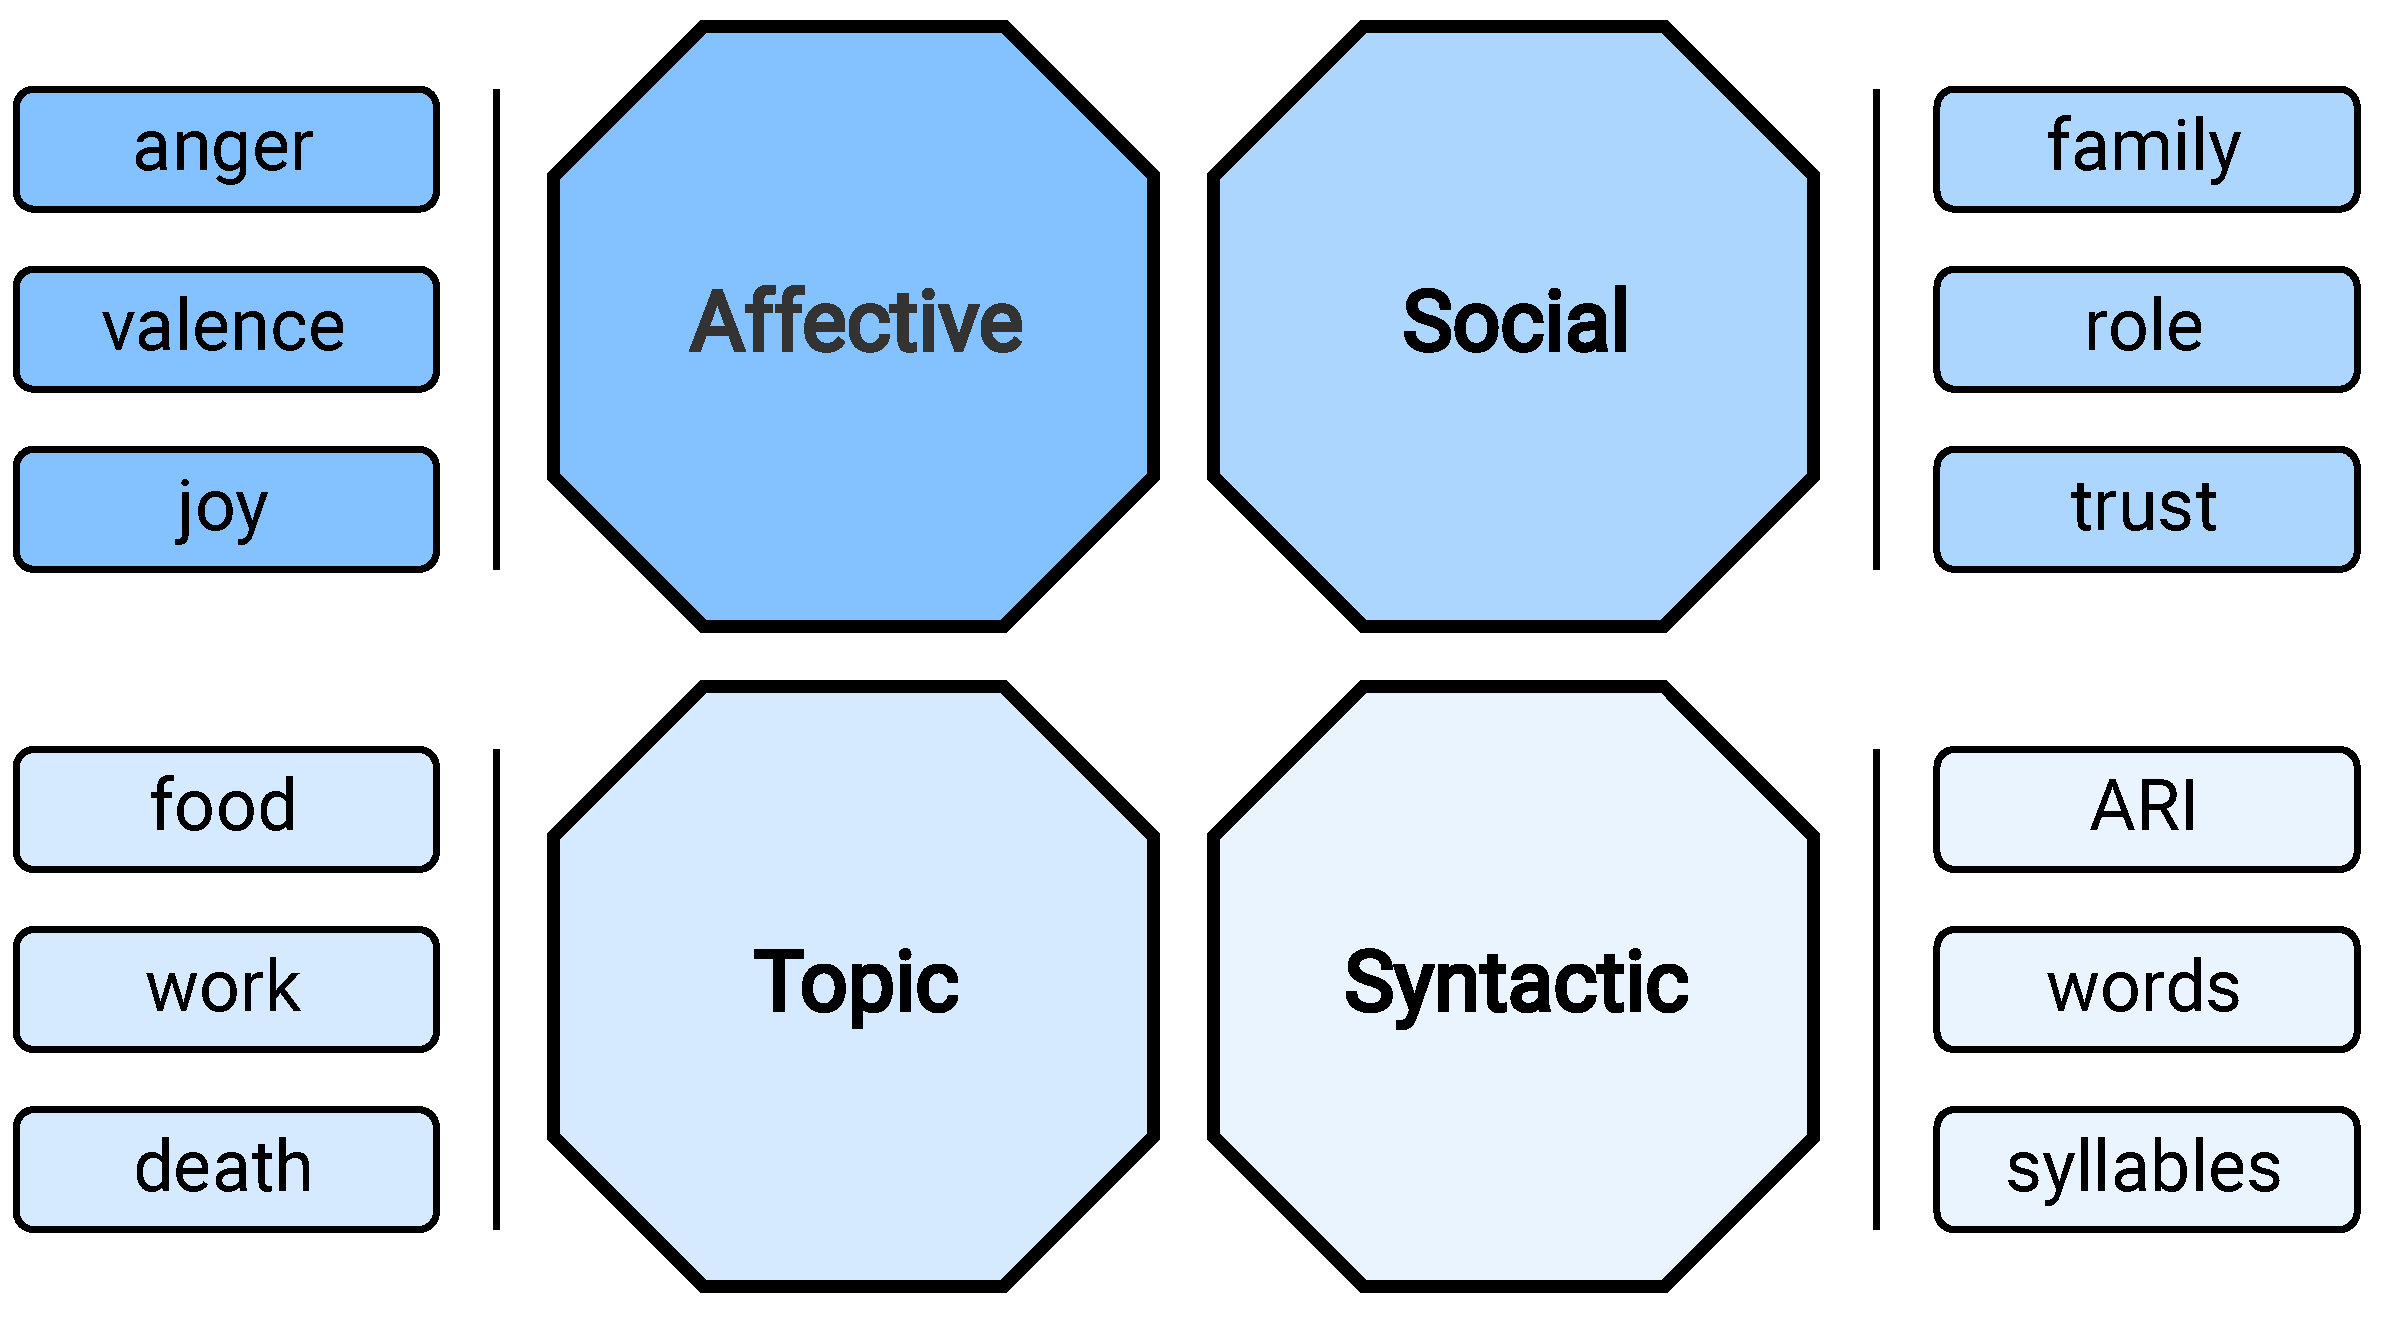
As a result, a comprehensive set of nearly 400 distinct features is obtained that encompass various types and characteristics. To effectively examine the impact of these characteristics based on their respective attributes, we have partitioned them into four distinct sets: affective, social, syntactic, and topic-related. The affective set encompasses those characteristics related to sentiments (positive, negative, or neutral), emotions (e.g., surprise, happiness, sadness), and moods (e.g., distress, attention, unease). All considered lexicons contribute to this set, providing a total of 113 features, including fear, anxiety, and arousal, among others. The social set contains characteristics related to interpersonal relationships, such as trust, deception, and gratitude. Extracted from LIWC, GALC, GI, Laswell, and EmoLex, the social set comprises 52 characteristics. The syntactic set incorporates 90 features related to stylistic aspects, including tone, self-reference, and writing fluency, to shed light on how the text was constructed and structured. These features are extracted mainly from the Readability Python library but also include some features provided by the LIWC and GI lexicons. Finally, the set of topics consists of 143 features that identify different themes within the text. Features such as horror, aggression, and work are derived from the LIWC, Laswell, and GI dictionaries, providing a comprehensive view of the various topics prevalent in the text.
An overview of these feature sets, along with some examples of each, is given in Figure 1. The proposed categorization allows us to discern and analyze the unique contributions of each type of characteristic, providing valuable information on their roles in the context of text-based depression detection.
For this purpose, we conducted a study computing the information gain of the different feature sets. Information gain is a well-established machine learning measure that quantifies the reduction in uncertainty achieved after the best split driven by a particular feature has been performed. This metric allows us to assess how much each category of features contributes to the discrimination between different classes. Considering a feature denoted as F and a class labeled as C, we can represent the entropy of the class as and the conditional entropy of the class given the feature F as . Then, the information gain can be computed as
The minimum value of the information gain arises when , indicating that the feature F and the class C are independent. On the contrary, the maximum information gain is achieved when a feature F exclusively appears in a particular class C, highlighting its discriminative potential in distinguishing between different classes.
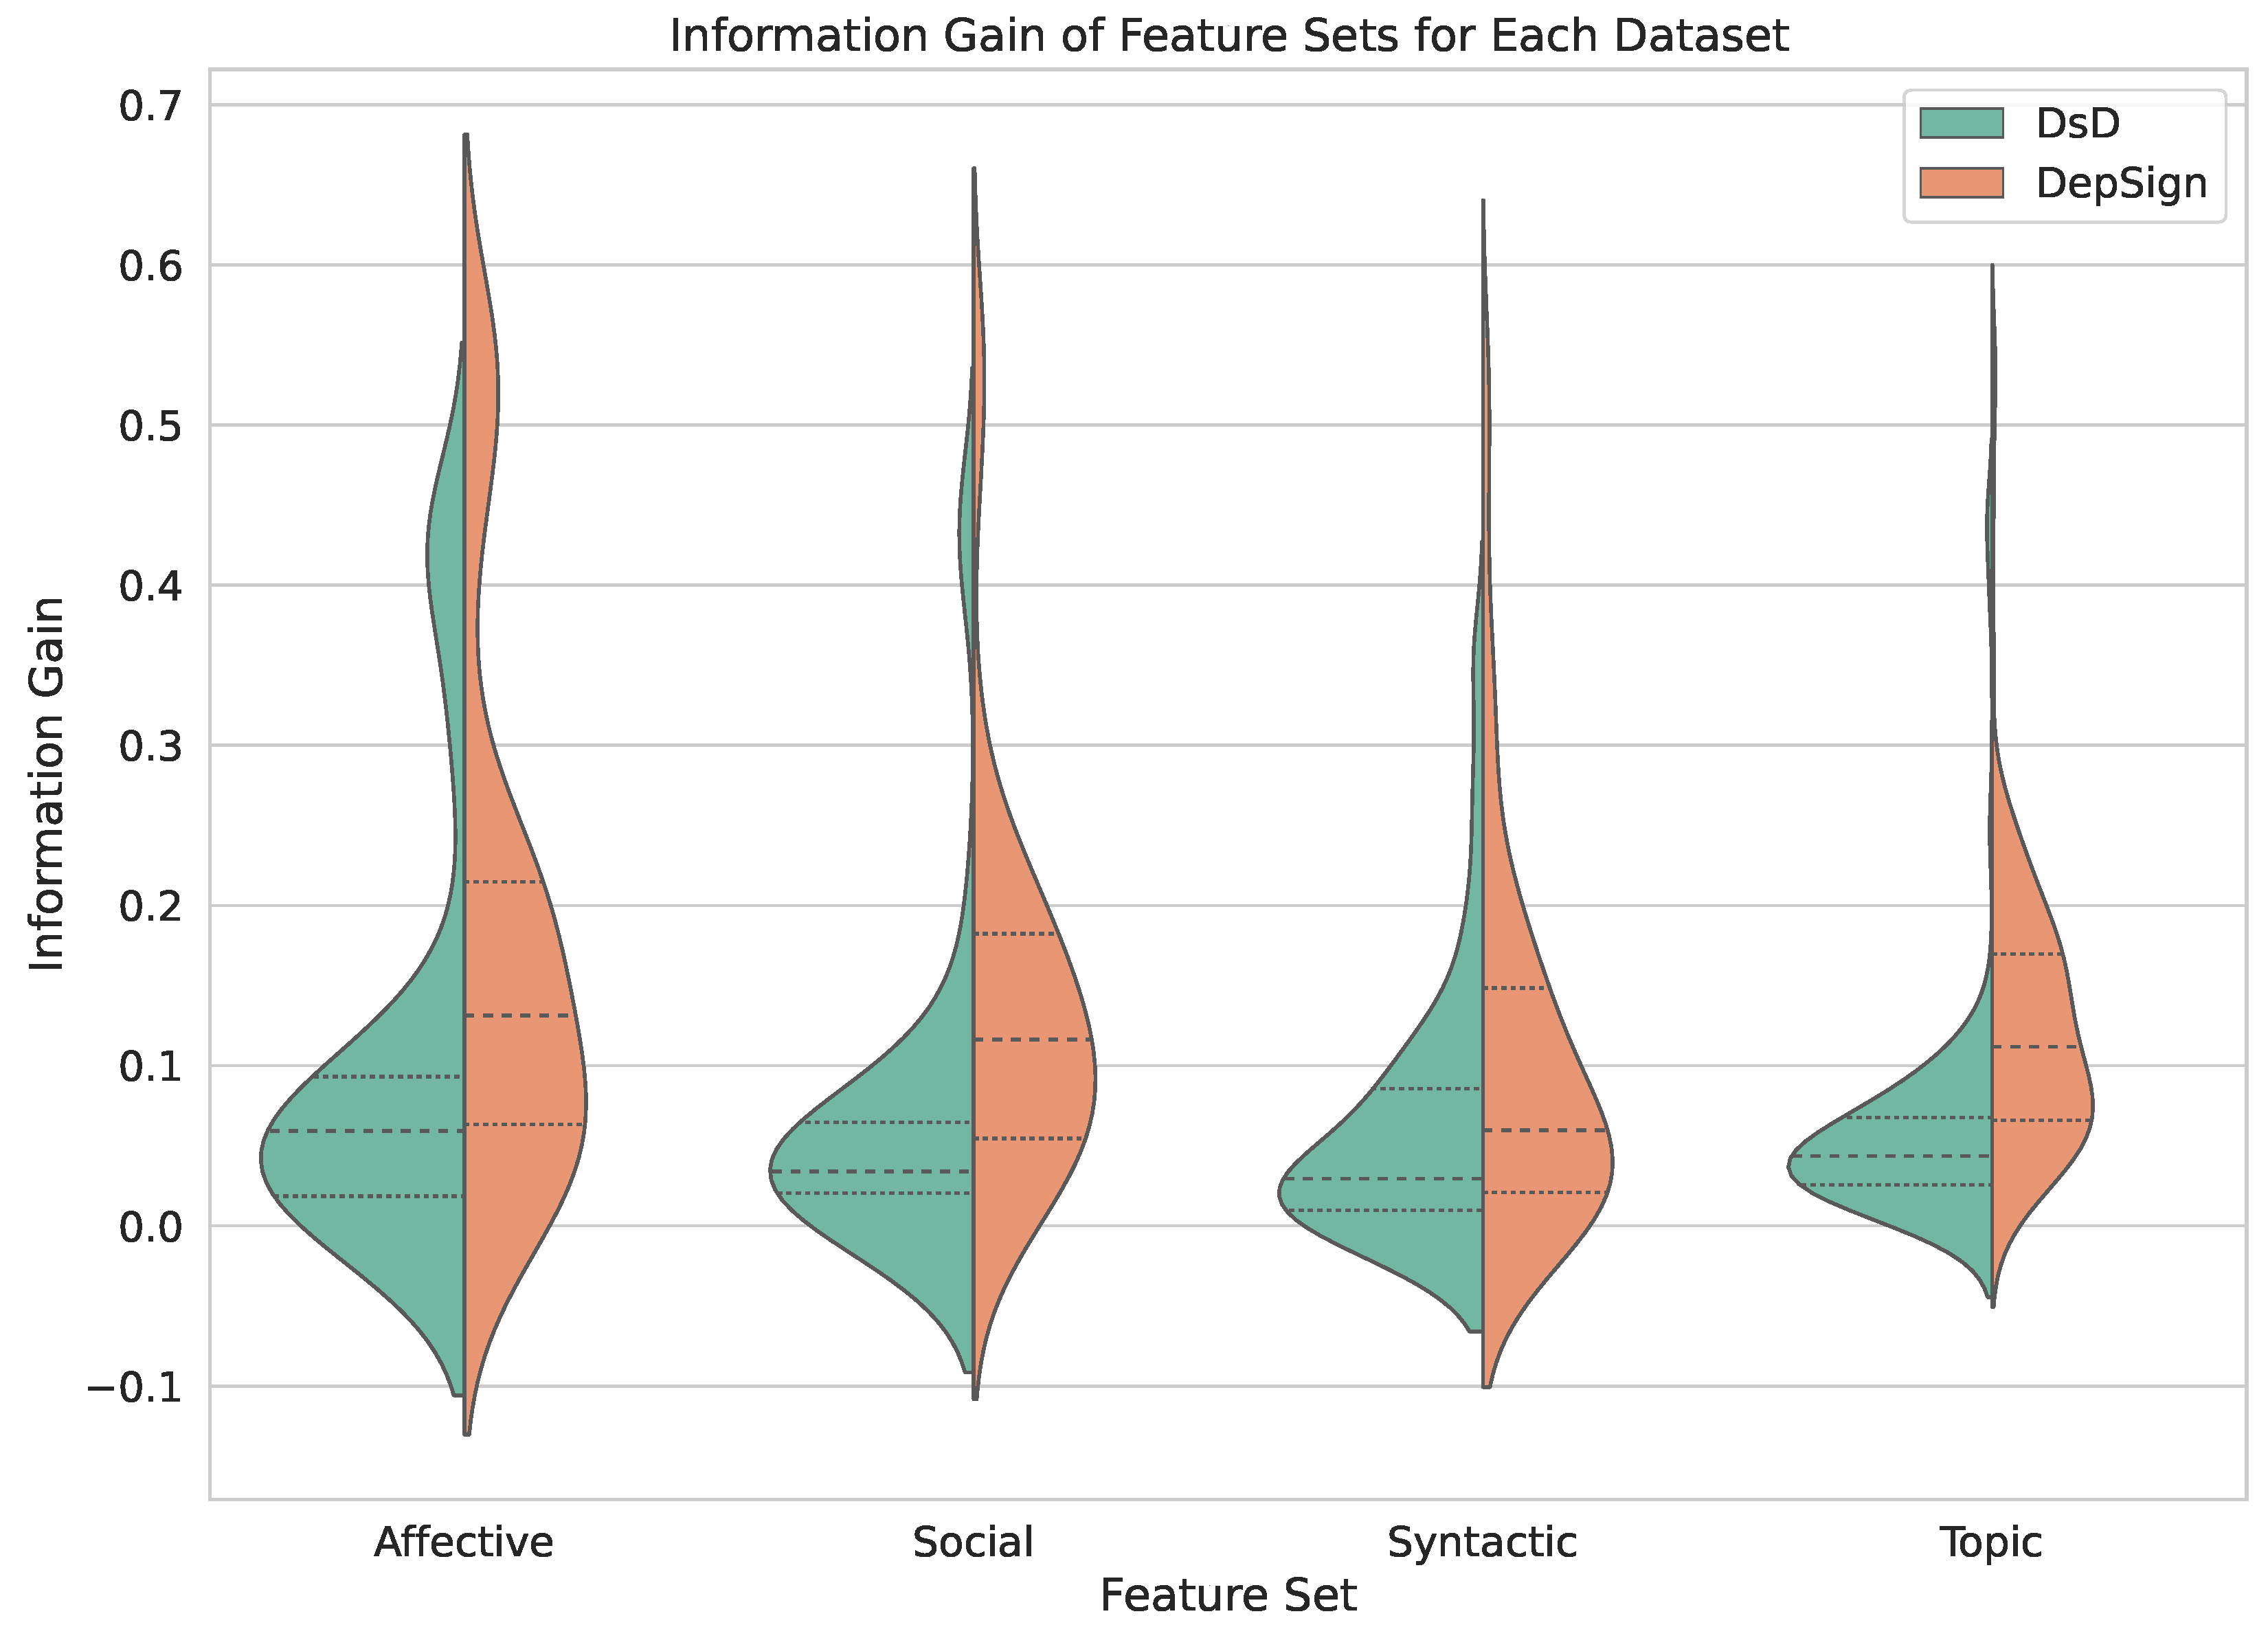
Figure 2 shows the distribution of the information gain values attained for each set of characteristics. The substantial portion of the information gain values clustering around 0 suggests a considerable number of features that do not contribute significantly to the classification task. However, the presence of an extended tail in the distribution for all feature sets suggests the existence of features that have the potential to impact the classification model’s performance positively. Upon closer examination, we observe wider sections for high information-gain values within the affective set, indicating a greater abundance of features with substantial information gain in this category. In contrast, the topic set displays a narrower tail in the DsD dataset, suggesting fewer topic-related features with notable information gain. However, while for the DsD dataset, the distribution is substantially flattened around the lower values, for the DepSign dataset, it is distributed towards the middle values. This suggests that a priori this set of features has more potential in the DepSign dataset.
Additionally, upon further comparing the datasets, we can appreciate that the tails of the distributions are distinctly shorter and narrower in the DsD dataset. This observation suggests that the feature sets, regardless of their nature, contain a more significant number of features with discriminative potential in the context of the DepSign dataset. One plausible explanation for this phenomenon lies in the length differences in the posts. The longer and potentially more diverse posts in the DepSign dataset may contribute to a higher number of features with substantial information gain values.
In general, it can be observed that the feature framework provides valuable insights for the task of detecting depression. In particular, the analysis highlights the importance of affective features (RQ2), as they demonstrate promising information gain. The substantial information gain achieved by the features within this set underlines their potential utility in capturing essential patterns related to depression detection.
3.3. Depression Detection Model
After analyzing the feature framework, our next objective is to take advantage of it in the development of a machine-learning model capable of detecting the intensity of depressive symptoms in the textual data. The problem to be solved is the detection of the depression severity level expressed in a post . According to the datasets considered (see Section 3.1), for the DsD dataset, and for the DepSign dataset. To achieve this, we propose an ensemble model [67] that combines lexicon-based features with distributional representations. An overview of the proposed approach can be seen in Figure 3.
Specifically, this model combines the lexicon-based feature vector derived from each post instance () with the vector that contains the distributional representation of it. Concatenation of both vectors results in a unified vector that encapsulates pertinent information from both lexicon-based features and distributional representations.
The lexicon-based feature vector is derived from the framework elucidated in Section 3.2, which contains features from different categories: affective, social, syntactic, and topic-related. Given the set of categories considered , we can define the set of features included in our framework as follows:
where , , , and are the set of features included in the affective, social, syntactic, and topic categories, correspondingly, and is the number of features included in each category. Accordingly, given a post under analysis and the total set of features F, an annotation vector is extracted. This vector contains the numeric annotations that express the intensity of each feature in that post; that is, .
The construction of the feature vector is shown in Algorithm 1. For each category (c) of the framework, the set of features that compound it () is extracted. The annotation of the post for each feature of that category is extracted through the annotation function. Finally, the annotations of all features are concatenated through the concat function, resulting in the annotation vector . This vector encloses the linguistic signals, emotional expressions, and cognitive patterns present in the post.
| Algorithm 1 Feature extraction algorithm |
|
To compute the distributional representation of the post, word embedding techniques are used [38]. Word embeddings encompass a form of computing distributed text representation, facilitating the assignment of similar representations to words with similar meanings. The process of obtaining this representation varies depending on the specific word embedding method. While context-independent methods (i.e., GloVe, FastText) employ neural networks or co-occurrence matrix factorization to learn word representations that are unique and distinct for each word without considering its context, context-dependent methods generate distinct embeddings for the same word depending on the context in which it appears. In this work, building on the results obtained in previous work on the detection of mental disorders in text [26], we explore the use of FastText [40] and compare it with cutting-edge approaches based on transformer models [68]. Thus, the post is converted into a numerical representation , whose length is determined by the dimensionality D of the word embeddings obtained by the chosen method. This numerical representation encapsulates valuable syntactic and semantic information from the post.
The feature vector and the embedding vector are combined into a unified vector , which includes information from both lexicon-based features and word embeddings:
In this way, for each post , a vector is computed. This comprehensive vector fuses semantic and contextual insights from word embeddings with affective and lexical information conveyed through the lexicon-based features. This combination of information has the potential to enable a broader knowledge, thus, empowering more informed and accurate depression detection in the textual data. The resulting vector is then fed into the machine learning classifier, which returns a prediction of the depression severity level expressed in the post.
Moreover, we seek to identify the most practical combination of word embedding models and lexicon-based features (RQ3). To this aim, we propose two additional models: a lexicon-based feature model and a distributional representation model. The first model relies solely on linguistic cues and emotional expressions of lexicon-based features; that is, it uses only the vector to perform the prediction . The second model emphasizes contextual information and semantic relationships captured by distributional representations, using only the vector to predict the depression severity level . Exploring these models allows us to identify the specific features and word embedding techniques that lead to better performance.
4. Experimentation
To assess the effectiveness of the proposed approach in detecting depression, we have designed an experimental study. This experiment is also intended to provide information on which techniques perform better in detecting the intensity of depressive signs in different textual corpora. To achieve this, we frame the problem as a multiclass classification task, where the goal is to detect the intensity of depressive signs in the text. The depression detection process operates at the post level, where posts are classified based on the severity of depressive signs.
4.1. Design
The methodology followed to design the evaluation was guided by the research questions outlined in Section 1. First, the evaluation was carried out using two public datasets in English to assess the performance of the proposed approach in various corpora (RQ1). Additionally, to investigate the effectiveness of different characteristics for depression detection (RQ2), a series of experiments was conducted, categorizing them according to the characteristic framework presented in Section 3.2. Finally, the three models proposed in Section 3.3 are evaluated separately and compared with related works to investigate the performance of the different methods (RQ3). These models are denoted as: the lexicon-based feature model (), the distributional representations model (), and the ensemble model ().
We evaluated the proposed approaches using two distinct machine learning classifiers implemented with Python’s Scikit-learn library [69]: support vector machines (SVM) and logistic regression. Moreover, RandomizedSearchCV was used to find the optimal hyper-parameters. Given that the best results were consistently obtained using a linear support vector machine (SVM), only metrics corresponding to this classifier were included. More details can be found in the source code (https://github.com/gsi-upm/depression-sl-text, accessed on 16 August 2023).
Following the previous research [20], we utilized a 5-fold validation and weighted F1-score as the performance metric. Some actions were taken into account to address the class imbalance problem of the used datasets. The subsets were split using stratified sampling through Scikit-learn StratifiedKFold. This technique guarantees that each data fold preserves the same class distribution as the original dataset. In addition, to further analyze how the class imbalance affects the performance of our method, we performed a random undersampling of the datasets. This technique allowed us to create modified datasets where each class is evenly represented. The performances in these balanced datasets were compared with those obtained when using the original, imbalanced datasets.
Finally, a Friedman statistical test [70] was performed further to explore the performance and impact of the proposed methods.
4.2. Results
To begin with, we evaluate the model to explore which specific features lead to better performance. An initial experiment was conducted using all the features of each set. Features exhibiting a strong correlation (greater than 0.95) with other features were removed, and all values were scaled using Scikit-learn MinMaxScaler. The results of this experiment are shown in Table 2.
We can see that the best performance for both datasets was achieved using the combination of all feature sets, resulting in an F1-score of 71.12% and 60.80% for the DsD and DepSign datasets. This indicates that incorporating diverse lexicon-based features allows the model to capture various aspects of depression-related linguistic patterns, leading to more informed and accurate depression detection.
However, it is reasonable to consider that not all extracted features are equally valuable for depression detection and that some may even negatively impact the accuracy of the classification. A feature selection process was conducted to investigate and improve our model. Thus, we have used recursive feature elimination (RFE) with cross-validation to identify the most relevant features among all the feature sets. The results improved slightly using this technique, reaching a 71.89% and 61.29% F1-score for each dataset. A significant reduction in the dimensionality of the features accompanies this performance improvement. Of the 376 features in the proposed framework, only 61 and 114 were selected for the DsD and DepSign datasets, respectively. The selection of a more significant number of features in the DepSign dataset is consistent with the conclusions drawn from the information gain analysis described in Section 3.2. That analysis showed a more significant number of features with a high information gain in this dataset.
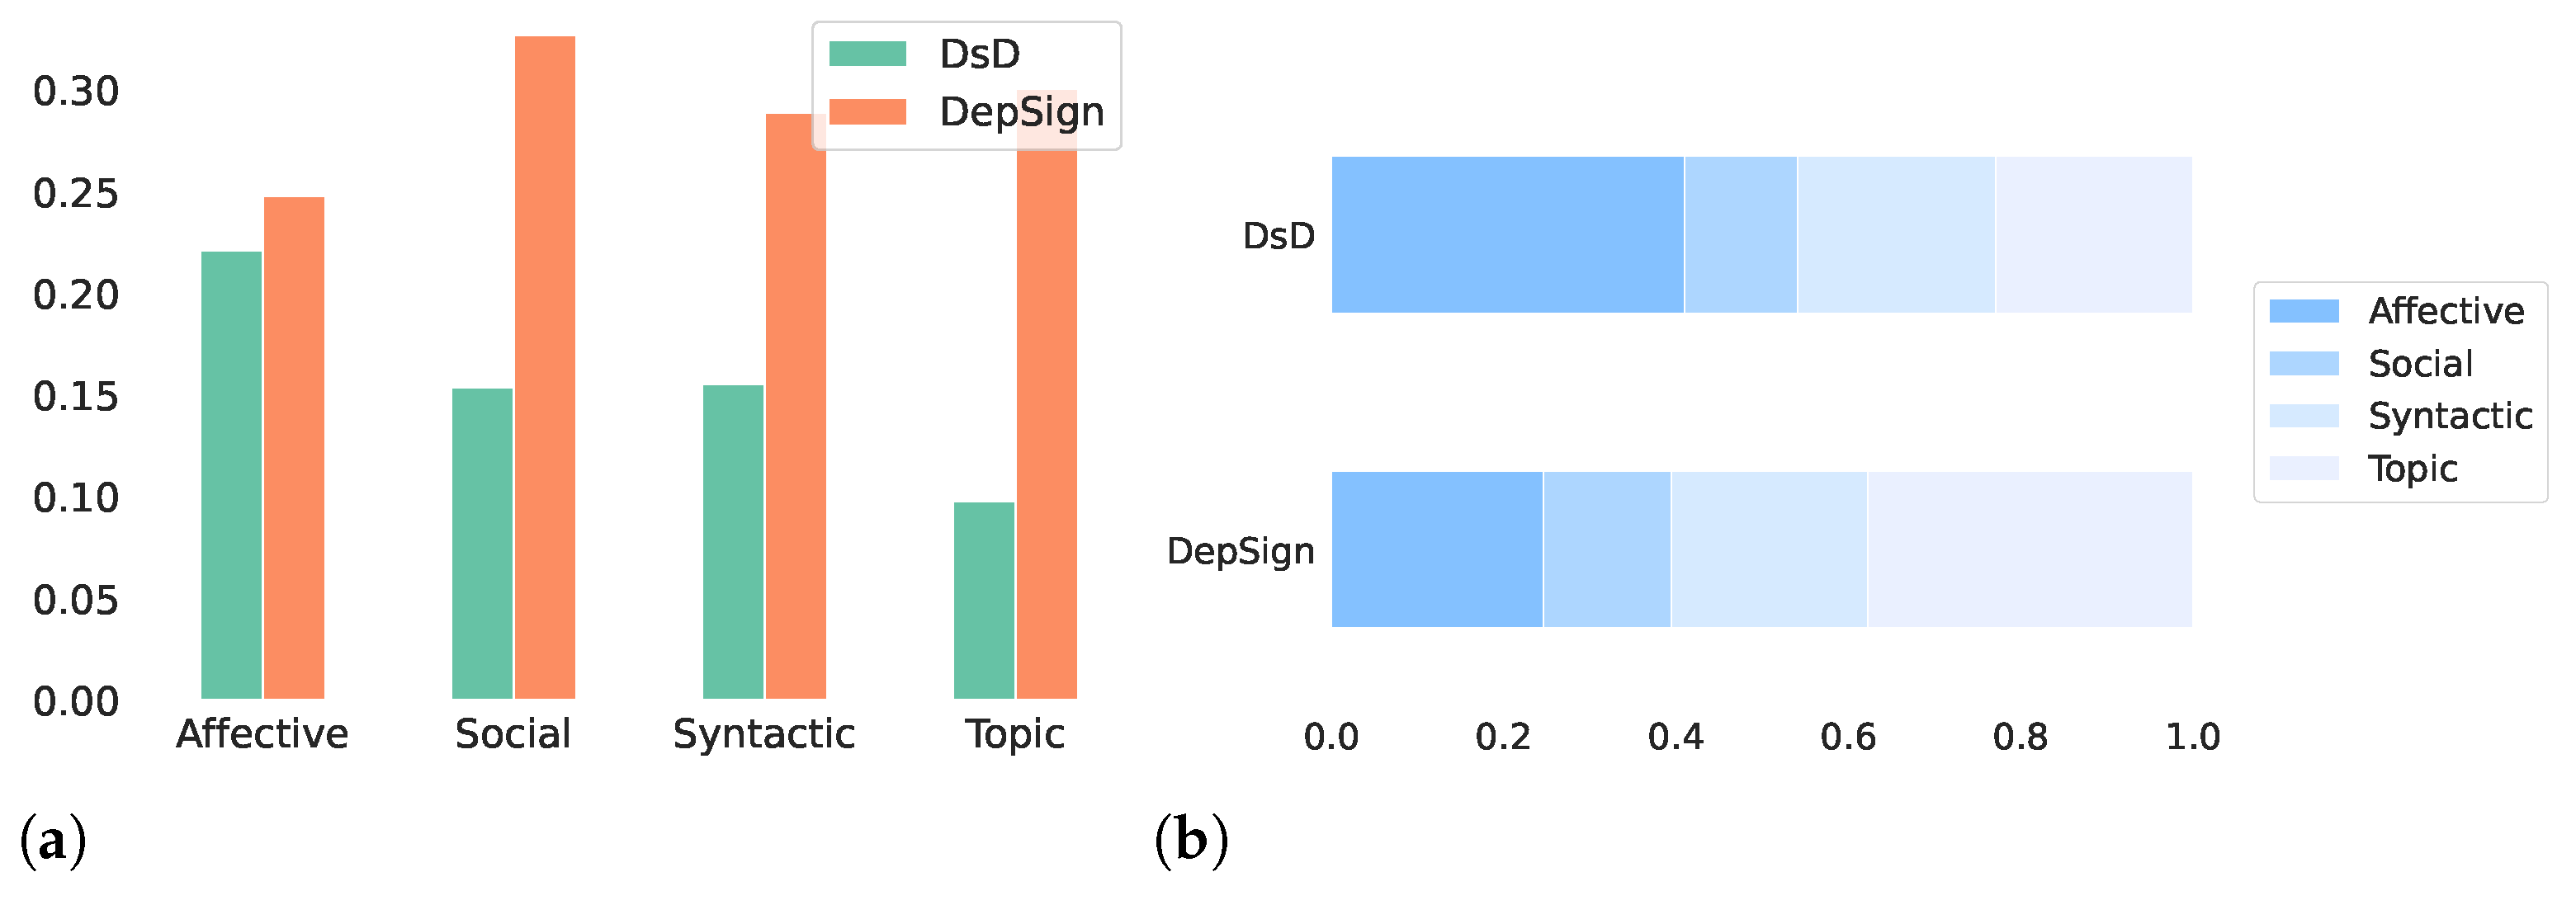
Upon examining the performance of different types of characteristics, we can observe that affective and syntactic features yield the best results (RQ2). On the contrary, social characteristics exhibited the lowest performance in both datasets. Further information on this matter is depicted in Figure 4. These figures illustrate the percentage of features that were selected from a specific category (Figure 4a) and the distribution of the feature sets among the specified features (Figure 4b) for each dataset.
We can see that for both datasets, affective features are consistently among the top-selected categories. Figure 4a shows that approximately 22% to 24% of the total set are selected for each dataset, while Figure 4b shows that this set is the one with more representation in the DsD dataset and the second one in the DepSign dataset. This suggests that emotional expressions and sentiment-related content are crucial in detecting depression. Furthermore, the syntactic features are consistently represented in both datasets. In contrast, social characteristics are less represented among the selected features. It is worth mentioning, however, that this is the set with a smaller size.
After obtaining the results for the model, our focus shifts to evaluating the distributional representation model (). To conduct this evaluation, we experimented using various word embedding techniques, including FastText and transformer-based embeddings. For the latter, we specifically used two different pre-trained models using the SentenceTransformers Python framework [68]: all-mpnet-base-v2 and all-distilroberta-v1 [71]. This library exploits an approach using siamese and triplet networks to generate sentence embeddings for each sentence.
According to the results obtained, shown in Table 3, the model performs slightly better than the model. Regarding comparing word embedding techniques, we can observe that transformer-based embeddings yield better performance. Specifically, the best results are obtained with all-mpnet-base-v2 embeddings in the DsD dataset and all-distilroberta-v1 in the DepSign dataset. As described in Section 2, this can be explained by the fact that transformer-based embeddings can capture intricate relationships between words, contextual information, and semantic meanings, resulting in more comprehensive and contextually rich representations of textual data.
After separately analyzing the results obtained from the distributional representation and the models based on lexicons, our focus shifted to examining their combination, represented by the model . To conduct this experiment, we selected the features that demonstrated the most promising performance for each dataset and integrated them with word embeddings. The better results obtained with context-aware embeddings motivated us to select it as a word embedding technique in the model. Specifically, we selected all-distilroberta-v1, as it obtained a higher result than all-mpnet-base-v2 in the DepSign dataset, is very similar in DsD, and also has a smaller size, which reduces its computational expense. Thus, we constructed the model combining the best-performing characteristics selected from with all-distilroberta-v1 embeddings.
In addition, we aim to compare the results obtained with the methods proposed in this paper with those obtained using transformer-based models. For this purpose, we utilized two widely used pre-trained transformer models: BERT and MentalBERT. BERT is a powerful language representation model that has shown effectiveness in numerous NLP applications. MentalBERT is a specialized adaptation of BERT fine-tuned specifically for mental health-related tasks. It incorporates domain-specific knowledge and context, making it particularly suitable for detecting depression in the textual data.
Table 4 presents the best results achieved with three different models: , , and , along with the results obtained with BERT and MentalBERT [20,32].
The results show that the model achieved the highest F1-score in both datasets: 73.35% for DsD and 63.81% for DepSign. These results suggest that combining linguistic cues and emotional expressions from lexicon-based features with contextual information and semantic relationships captured from word embeddings leads to improved performance and more informative depression detection models. Furthermore, such results affirm that the proposed approach for detecting depression severity signs in the textual data exhibits substantial performance across different datasets (RQ1).
To delve deeper into the effectiveness and influence of the proposed models, we performed a Friedman statistical test [70]. This test was employed to determine whether there are significant differences between classification methods based on the sample results. The Friedman test ranks the methods according to their performance on different datasets. A lower ranking indicates that a specific method outperforms the others, demonstrating its superior effectiveness in the classification task. The Friedman test evaluates the average ranks of the methods, denoted as follows:
where represents the rank of the algorithm jth in the dataset ith, k is the number of methods, and n is the number of datasets. It tests the null hypothesis, which assumes that given all algorithms are equal, they have equal ranks. The Friedman statistic under this null hypothesis, with degrees of freedom, is given by
Additionally, Iman and Davenport [72] proposed a more robust statistic based on the F-distribution. This statistic, denoted as , is calculated with and degrees of freedom:
The Friedman statistical test was performed with specific parameters: an value of 0.1, (representing the number of methods analyzed) and (indicating the number of datasets). The computed values resulted in and , while the critical value . Given that , the null hypothesis of the Friedman test was rejected, indicating the statistical significance of the results. To simplify the presentation of the best-performing methods based on their ranks from the Friedman test, Table 5 displays the best five approaches.
The results of Friedman’s test support the effectiveness of combining lexicon-based features with distributional representations as the most successful approach (RQ3). Additionally, the results show that the proposed method outperforms more complex transformer-based models, often requiring a higher computational overhead.
After identifying the best-performing model, we conducted additional experiments to gain deeper insights into the performance of the approach. Specifically, our goal was to understand how the class imbalance within the dataset influences the effectiveness of our system. To achieve this, we employed random undersampling techniques [73] on both datasets, creating a more balanced representation of classes by randomly removing instances from the majority classes. This strategic sampling approach helps address the issue of imbalanced data distribution, ensuring that the model does not become overly biased toward predicting the majority class.
The confusion matrices obtained using the model for each dataset, both with and without undersampling, are presented in Figure 5. On close examination of these matrices, some notable insights emerge. When we do not employ undersampling, the class imbalance significantly affects the model’s predictions. It tends to be more inclined to predict the majority class, which results in higher accuracy for that class but considerably lower accuracy for minority classes. However, when random undersampling is applied, we observe a shift in the behavior of the model. It becomes less biased toward the majority class and demonstrates improved performance in recognizing minority classes.
Additionally, Table 6 presents a comprehensive analysis of model performances regarding the two undersampling strategies. It also showcases F-scores, precision, and recall, along with their standard deviations. It can be appreciated that undersampling leads to a decrease in average performances that can be attributed to the loss of valuable information derived from the reduction in dataset size. This decrease is higher in the DsD dataset, as the information loss is higher in this dataset given the limited number of samples in the minority class. However, the standard deviation of the performances for each class also decreases, suggesting a more consistent performance. These findings emphasize the importance of addressing class imbalance when working with the considered datasets.
To conclude, we compare the results of our proposed approach with the best-performing methods found in the literature for each dataset. Table 7 shows the outcomes of this comparison. Regarding the DsD dataset, one of the most prominent approaches is the one proposed by Ilias et al. [20]. The authors in this work inject extra-linguistic information into transformer-based models and employ a multimodal adaptation gate for creating the combined embeddings, which are then fed to a MentalBERT model. Applying label smoothing, they yield a maximum weighted F1-score of 73.16%, which is slightly lower than the outcome obtained by our approach. For the DepSign dataset, Poswiata et al. [32] proposed an ensemble of various fine-tuned transformer-based models, achieving a macro F1-score of 63.70%. To compare, we have computed the macro average F1-score for our approach using the splits described in their article. The results reveal that our method does not surpass the performance of the transformers ensemble model. A closer examination of these results, in conjunction with the class distribution of the data and Figure 5, suggests that our approach exhibits higher sensitivity to the class imbalance of the dataset. However, a compelling advantage of our method lies in its simplicity, making it less susceptible to reduced data availability. Thus, there is potential to enhance the performance of our approach by employing specialized techniques to address class imbalance, even if they result in data reduction.
Furthermore, in Table 7, we have incorporated two additional metrics to provide a more comprehensive evaluation: precision and recall. These metrics allow us to assess the correctness and sensitivity of our approach. A key observation is that the proposed method exhibits substantial results for both metrics. This implies that our model is competent at correctly identifying the intensity of depression signs and still maintains good sensitivity. In addition, the proposed method surpasses or remains competitive with the existing state-of-the-art methods. For the DepSign dataset, the transformer-based ensemble model achieves a higher precision than ours, although the recall values are comparable between the two methods. This suggests that our approach has a slightly less accurate identification of depression signs when they are present but maintains a similar level of sensitivity in detecting depression signs. However, our approach presents some advantages regarding simplicity, interpretability, and reduced computational overhead. These results reinforce the potential of traditional machine learning techniques in effectively detecting the intensity of depression signs in the textual data.
5. Discussion
In Section 1, we outlined three key research questions that guided our work. The primary focus of the first question (RQ1) was to investigate the effectiveness of traditional machine learning methods in achieving robust performance and generalizability across multiple datasets for depression severity detection. The prior research has showcased the efficacy of more complex models, such as deep neural networks or transformer-based architectures. However, these often demand significant computational resources, suffer from prolonged inference times, and lack interpretability [74]. Our approach, in contrast, strikes a compelling balance between performance and computational demands since it is based on simple features. We have evaluated two public English datasets and observed favorable performance metrics on both, outperforming more complex models such as BERT or MentalBERT. In addition, the comparison with the previous works shows that the proposed method remains competitive with the existing state-of-the-art methods. To our knowledge, this study is the first to propose a traditional machine-learning-based method that achieves commendable results comparable to those obtained by novel approaches. Furthermore, our approach demonstrates promising results and offers a more practical and interpretable alternative to the computationally intensive methods commonly used in this domain.
The second research question (RQ2) revolved around comparing various types of lexicon-based features in terms of their performance in depression detection. To address this, we introduced a feature framework leveraging multiple established lexicons to identify and categorize features into four distinct sets: affective, topic, social, and syntactic. The outcomes of our investigation indicate that affective features exhibit superior performance in text classification for depression detection. Nevertheless, including social, syntactic, and topic-related features enhances the performance.
Finally, in our final research question (RQ3), we delved into determining the most effective method for detecting the severity of depression signs. To this end, we presented and evaluated three distinct classification models: a lexicon-based features model, a distributional representation model, and an ensemble model that combines lexicon-based features with distributional representations. The evaluation in terms of the F1-score revealed that the ensemble approach consistently outperforms the other models in both datasets, exhibiting remarkable performance. The enhancement in performance is more significant in the DsD dataset. In this dataset, the F1-score achieved by the model represents an increase of 2 percentage points compared to and nearly 3 points compared to . This 3-point improvement between the model and the model is also revealed in the DepSign dataset. However, the enhancement achieved by compared to is less pronounced. The Friedman test confirmed the statistical significance of these results. Furthermore, our analysis expanded to explore the impact of different word embedding techniques on depression detection performance, including a traditional context-independent technique such as FastText and more novel context-aware solutions based on transformers (all-distilroberta-v1 and all-mpnet-base-v2). The results identified context-aware distributional representations as the top-performing distributional representation technique, with few differences between the two models.
In this way, the findings of this work provide valuable insights into the field of detection of depression severity from text. These findings lay the groundwork for further advancements in mental health promotion and early intervention through affordable and interpretable text-based analysis. Nevertheless, it is essential to acknowledge certain methodological limitations. First, our reliance on publicly available datasets from social media platforms introduces inherent biases in the data that can affect the generalizability of our findings to broader populations. Additionally, the unbalanced distribution of samples among different categories within these datasets may impact the model’s performance, as seen in the experimental study. Additionally, the datasets considered consist of English-language text, and the applicability of our approach to other languages and cultural contexts may pose additional challenges. Finally, depression is a multifaceted mental health condition influenced by numerous factors. Our feature engineering process may not capture the full complexity of depression, leaving room for improvement in feature selection. Addressing these limitations and refining our approach will be crucial for its continued development and effectiveness in practical applications.
6. Conclusions
This study proposes a method to detect signs of depression within digital content. The proposed approach is based on traditional machine learning algorithms to yield substantial performance without compromising interpretability and computational efficiency. To this aim, we introduce a comprehensive feature framework that organizes features into four distinct sets: affective, topic, social, and syntactic. Such a framework is combined with distributional representations that capture semantic information from the text. Specifically, context-dependent word embeddings (utilizing all-distilroberta-v1 and all-mpnet-base-v2 models) and context-independent word embeddings (FastText) are used to assess their impact on performance. The effectiveness of the proposed approach is evaluated with an experimental study using two public English datasets from social media platforms. The experiments demonstrate that the proposed approach enables traditional classifiers to yield substantial depression detection performance, with an F1-score of 74.38% in the DsD dataset and 63.94% in the DepSign dataset. These results are comparable to those obtained using more complex methods such as deep neural networks and transformer-based models. In addition, the relevance of these outcomes is confirmed by a statistical analysis.
The advances presented here hold potential for the early detection of depression. One of the key strengths of our approach lies in its ability to strike a balance between performance and computational resources, owing to its reliance on simple yet effective features. Additionally, the interpretability of our approach enables a better understanding of the influence of social, personal, and affective factors on depression, leading to the identification of appropriate regulatory measures.
Based on the encouraging results obtained, our research opens several research directions. First, our existing solution demonstrates the potential for seamless deployment in real-world environments, offering substantial performance without high computational resources. This aspect could be exploited by developing a user-friendly tool that integrates our approach to aid in the early detection of depression in text. Furthermore, as part of our future work, we intend to explore the expansion of the feature framework to incorporate other types of features that have shown promising results in various classification tasks, such as moral values [75]. Finally, we see potential in extending the applicability of our method to other languages, broadening its scope and impact.
Author Contributions
Conceptualization, S.M. and C.Á.I.; methodology, S.M. and C.Á.I.; software, S.M.; writing—original draft preparation, S.M.; writing—review and editing, S.M. and C.Á.I.; visualization, S.M.; project administration, C.Á.I.; funding acquisition, C.Á.I. All authors have read and agreed to the published version of the manuscript.
Funding
This work is partially supported by AROMA, a subproject of the MIRATAR project (TED2021-132149B-C4), funded by Spanish Ministry of Science and Innovation and by the European Union with NextGeneration EU funds (AEI/10.13039/501100011033/); and by project AMOR, funded by Spanish Ministry of Economic Affairs and Digital Transformation through the program UNICO I+D Cloud in the framework of the Recovery, Transformation and Resilience Plan (RTRP) and by the European Union NextGeneration EU funds within the Recovery and Resilience Facility (RRF).
Institutional Review Board Statement
Not applicable.
Informed Consent Statement
Not applicable.
Data Availability Statement
The code and data are available at https://github.com/gsi-upm/depression-sl-text, accessed on 16 August 2023.
Acknowledgments
Conflicts of Interest
The authors declare no conflict of interest. The funders had no role in the study’s design; in the collection, analyses, or interpretation of data; in the writing of the manuscript; or in the decision to publish the results.
Abbreviations
The following abbreviations are used in this manuscript:
| ANEW | Affective Norms for English Words |
| BERT | Bidirectional encoder representations from transformers |
| DsD | Depression severity dataset |
| GALC | Geneva Affect Label Coder |
| GI | General Inquirer |
| GloVe | Global Vectors for Word Representation |
| LIWC | Linguistic Inquiry and Word Count |
| LSTM | Long–short-term memory |
| NLP | Natural language processing |
| RFE | Recursive feature elimination |
| SMOG | Simple Measure of Gobbledygook |
| SVM | Support vector machine |
| VADER | Valence Aware Dictionary for Sentiment Reasoning |
References
- Fried, E.I.; Flake, J.K.; Robinaugh, D.J. Revisiting the theoretical and methodological foundations of depression measurement. Nat. Rev. Psychol. 2022, 1, 358–368. [Google Scholar] [CrossRef]
- World Health Organization. Depressive Disorder (Depression). 2023. Available online: https://www.who.int/news-room/fact-sheets/detail/depression (accessed on 21 July 2023).
- American Psychiatric Association. Diagnostic and Statistical Manual of Mental Disorders: DSM-5; American Psychiatric Association: Washington, DC, USA, 2013; Volume 5. [Google Scholar]
- Sartorius, N. The economic and social burden of depression. J. Clin. Psychiatry 2001, 62, 8–11. [Google Scholar]
- Weitzman, C.; Wegner, L. Promoting optimal development: Screening for behavioral and emotional problems. Pediatrics 2015, 135, 384–395. [Google Scholar] [CrossRef] [PubMed]
- Olfson, M.; Blanco, C.; Marcus, S.C. Treatment of adult depression in the United States. JAMA Intern. Med. 2016, 176, 1482–1491. [Google Scholar] [CrossRef] [PubMed]
- Beck, A.T.; Ward, C.; Mendelson, M.; Mock, J.; Erbaugh, J. Beck depression inventory (BDI). Arch Gen Psychiatry 1961, 4, 561–571. [Google Scholar] [CrossRef]
- Kroenke, K.; Spitzer, R.L.; Williams, J.B. The PHQ-9: Validity of a brief depression severity measure. J. Gen. Intern. Med. 2001, 16, 606–613. [Google Scholar] [CrossRef]
- Huang, Y.P.; Huang, C.Y.; Liu, S.I. Hybrid intelligent methods for arrhythmia detection and geriatric depression diagnosis. Appl. Soft Comput. 2014, 14, 38–46. [Google Scholar] [CrossRef]
- Zucco, C.; Calabrese, B.; Cannataro, M. Sentiment analysis and affective computing for depression monitoring. In Proceedings of the 2017 IEEE International Conference on Bioinformatics and Biomedicine (BIBM), Kansas City, MO, USA, 13–16 November 2017; pp. 1988–1995. [Google Scholar]
- Chiang, H.S.; Chen, M.Y.; Liao, L.S. Cognitive depression detection cyber-medical system based on EEG analysis and deep learning approaches. IEEE J. Biomed. Health Inform. 2022, 27, 608–616. [Google Scholar] [CrossRef]
- Shangguan, Z.; Liu, Z.; Li, G.; Chen, Q.; Ding, Z.; Hu, B. Dual-stream multiple instance learning for depression detection with facial expression videos. IEEE Trans. Neural Syst. Rehabil. Eng. 2022, 31, 554–563. [Google Scholar] [CrossRef]
- Lin, Y.; Liyanage, B.N.; Sun, Y.; Lu, T.; Zhu, Z.; Liao, Y.; Wang, Q.; Shi, C.; Yue, W. A deep learning-based model for detecting depression in senior population. Front. Psychiatry 2022, 13, 1016676. [Google Scholar] [CrossRef]
- Marriwala, N.; Chaudhary, D. A hybrid model for depression detection using deep learning. Meas. Sens. 2023, 25, 100587. [Google Scholar]
- Highland, D.; Zhou, G. A review of detection techniques for depression and bipolar disorder. Smart Health 2022, 24, 100282. [Google Scholar] [CrossRef]
- Hassan, A.U.; Hussain, J.; Hussain, M.; Sadiq, M.; Lee, S. Sentiment analysis of social networking sites (SNS) data using machine learning approach for the measurement of depression. In Proceedings of the 2017 International Conference on Information and Communication Technology Convergence (ICTC), Jeju, Republic of Korea, 18–20 October 2017; pp. 138–140. [Google Scholar]
- Mishra, V.; Garg, T. A systematic study on predicting depression using text analytics. J. Fundam. Appl. Sci. 2018, 10, 2. [Google Scholar]
- Skaik, R.; Inkpen, D. Using social media for mental health surveillance: A review. ACM Comput. Surv. (CSUR) 2020, 53, 1–31. [Google Scholar] [CrossRef]
- Fang, C.; Dianatobing, G.; Atara, T.; Edbert, I.S.; Suhartono, D. Feature Extraction Methods for Depression Detection Through Social Media Text. In Proceedings of the 2022 6th International Conference on Informatics and Computational Sciences (ICICoS), Semarang, Indonesia, 28–29 September 2022; pp. 117–121. [Google Scholar]
- Ilias, L.; Mouzakitis, S.; Askounis, D. Calibration of Transformer-Based Models for Identifying Stress and Depression in Social Media. In IEEE Transactions on Computational Social Systems; IEEE: Piscataway, NJ, USA, 2023; pp. 1–12. [Google Scholar]
- Dewangan, D.; Selot, S.; Panicker, S. Deep Learning Techniques for Detecting Depression Signs from Text Messages: A Review. IUP J. Comput. Sci. 2022, 16, 21–45. [Google Scholar]
- Burdisso, S.G.; Errecalde, M.; Montes-y Gómez, M. A text classification framework for simple and effective early depression detection over social media streams. Expert Syst. Appl. 2019, 133, 182–197. [Google Scholar] [CrossRef]
- Le Glaz, A.; Haralambous, Y.; Kim-Dufor, D.H.; Lenca, P.; Billot, R.; Ryan, T.C.; Marsh, J.; Devylder, J.; Walter, M.; Berrouiguet, S.; et al. Machine learning and natural language processing in mental health: Systematic review. J. Med. Internet Res. 2021, 23, e15708. [Google Scholar] [CrossRef]
- Ríssola, E.A.; Losada, D.E.; Crestani, F. A survey of computational methods for online mental state assessment on social media. ACM Trans. Comput. Healthc. 2021, 2, 1–31. [Google Scholar] [CrossRef]
- Wongkoblap, A.; Vadillo, M.A.; Curcin, V. Social media big data analysis for mental health research. In Mental Health in a Digital World; Elsevier: Amsterdam, The Netherlands, 2022; pp. 109–143. [Google Scholar]
- Muñoz, S.; Iglesias, C.A. A text classification approach to detect psychological stress combining a lexicon-based feature framework with distributional representations. Inf. Process. Manag. 2022, 59, 103011. [Google Scholar] [CrossRef]
- Zhang, T.; Schoene, A.M.; Ji, S.; Ananiadou, S. Natural language processing applied to mental illness detection: A narrative review. NPJ Digit. Med. 2022, 5, 46. [Google Scholar] [CrossRef]
- William, D.; Suhartono, D. Text-based depression detection on social media posts: A systematic literature review. Procedia Comput. Sci. 2021, 179, 582–589. [Google Scholar] [CrossRef]
- Chiong, R.; Budhi, G.S.; Dhakal, S.; Chiong, F. A textual-based featuring approach for depression detection using machine learning classifiers and social media texts. Comput. Biol. Med. 2021, 135, 104499. [Google Scholar] [CrossRef] [PubMed]
- Naseem, U.; Dunn, A.G.; Kim, J.; Khushi, M. Early identification of depression severity levels on reddit using ordinal classification. In Proceedings of the ACM Web Conference 2022, Lyon, France, 29 April 2022; pp. 2563–2572. [Google Scholar]
- Sampath, K.; Durairaj, T. Data set creation and empirical analysis for detecting signs of depression from social media postings. In Proceedings of the International Conference on Computational Intelligence in Data Science; Springer: Berlin/Heidelberg, Germany, 2022; pp. 136–151. [Google Scholar]
- Poświata, R.; Perełkiewicz, M. OPI@LT-EDI-ACL2022: Detecting Signs of Depression from Social Media Text using RoBERTa Pre-trained Language Models. In Proceedings of the Second Workshop on Language Technology for Equality, Diversity and Inclusion, Dublin, Ireland, 27 May 2022; pp. 276–282. [Google Scholar]
- Oh, J.; Kim, M.; Park, H.; Oh, H. Are You Depressed? Analyze User Utterances to Detect Depressive Emotions Using DistilBERT. Appl. Sci. 2023, 13, 6223. [Google Scholar] [CrossRef]
- Zhang, T.; Yang, K.; Ananiadou, S. Sentiment-guided Transformer with Severity-aware Contrastive Learning for Depression Detection on Social Media. In Proceedings of the The 22nd Workshop on Biomedical Natural Language Processing and BioNLP Shared Tasks, Toronto, ON, Canada, 13 July 2023; pp. 114–126. [Google Scholar]
- Joshi, M.L.; Kanoongo, N. Depression detection using emotional artificial intelligence and machine learning: A closer review. Mater. Today Proc. 2022, 58, 217–226. [Google Scholar] [CrossRef]
- Islam, M.R.; Kabir, M.A.; Ahmed, A.; Kamal, A.R.M.; Wang, H.; Ulhaq, A. Depression detection from social network data using machine learning techniques. Health Inf. Sci. Syst. 2018, 6, 1–12. [Google Scholar] [CrossRef]
- Chiong, R.; Budhi, G.S.; Dhakal, S. Combining sentiment lexicons and content-based features for depression detection. IEEE Intell. Syst. 2021, 36, 99–105. [Google Scholar] [CrossRef]
- Mikolov, T.; Sutskever, I.; Chen, K.; Corrado, G.S.; Dean, J. Distributed representations of words and phrases and their compositionality. In Proceedings of the Advances in Neural Information Processing Systems, Lake Tahoe, NV, USA, 5–10 December 2013; pp. 3111–3119. [Google Scholar]
- Pennington, J.; Socher, R.; Manning, C.D. Glove: Global vectors for word representation. In Proceedings of the 2014 Conference on Empirical Methods in Natural Language Processing (EMNLP), Doha, Qatar, 25–29 October 2014; pp. 1532–1543. [Google Scholar]
- Joulin, A.; Grave, E.; Bojanowski, P.; Douze, M.; Jégou, H.; Mikolov, T. Fasttext. zip: Compressing text classification models. arXiv Prepr. 2016, arXiv:1612.03651. [Google Scholar]
- Tejaswini, V.; Babu, K.S.; Sahoo, B. Depression Detection from Social Media Text Analysis using Natural Language Processing Techniques and Hybrid Deep Learning Model. ACM Trans. Asian -Low-Resour. Lang. Inf. Process. 2022. [Google Scholar] [CrossRef]
- Fu, X.; Yang, J.; Li, J.; Fang, M.; Wang, H. Lexicon-enhanced LSTM with attention for general sentiment analysis. IEEE Access 2018, 6, 71884–71891. [Google Scholar] [CrossRef]
- Amanat, A.; Rizwan, M.; Javed, A.R.; Abdelhaq, M.; Alsaqour, R.; Pandya, S.; Uddin, M. Deep learning for depression detection from textual data. Electronics 2022, 11, 676. [Google Scholar] [CrossRef]
- Shah, F.M.; Ahmed, F.; Joy, S.K.S.; Ahmed, S.; Sadek, S.; Shil, R.; Kabir, M.H. Early depression detection from social network using deep learning techniques. In Proceedings of the 2020 IEEE Region 10 Symposium (TENSYMP), Dhaka, Bangladesh, 5–7 June 2020; pp. 823–826. [Google Scholar]
- Lin, L.; Chen, X.; Shen, Y.; Zhang, L. Towards automatic depression detection: A BiLSTM/1D CNN-based model. Appl. Sci. 2020, 10, 8701. [Google Scholar] [CrossRef]
- Yadav, U.; Sharma, A.K. A novel automated depression detection technique using text transcript. Int. J. Imaging Syst. Technol. 2023, 33, 108–122. [Google Scholar] [CrossRef]
- Kenton, J.D.M.W.C.; Toutanova, L.K. BERT: Pre-training of Deep Bidirectional Transformers for Language Understanding. In Proceedings of the NAACL-HLT, Minneapolis, MN, USA, 2–7 June 2019; pp. 4171–4186. [Google Scholar]
- Burkhardt, H.; Pullmann, M.; Hull, T.; Areán, P.; Cohen, T. Comparing emotion feature extraction approaches for predicting depression and anxiety. In Proceedings of the Eighth Workshop on Computational Linguistics and Clinical Psychology, Seattle, WA, USA, 15 July 2022; pp. 105–115. [Google Scholar]
- Ji, S.; Zhang, T.; Ansari, L.; Fu, J.; Tiwari, P.; Cambria, E. MentalBERT: Publicly Available Pretrained Language Models for Mental Healthcare. In Proceedings of the Thirteenth Language Resources and Evaluation Conference, Luxemburg, 21–23 June 2022; pp. 7184–7190. [Google Scholar]
- Miaschi, A.; Dell’Orletta, F. Contextual and non-contextual word embeddings: An in-depth linguistic investigation. In Proceedings of the 5th Workshop on Representation Learning for NLP, Online, 9 July 2020; pp. 110–119. [Google Scholar]
- Turcan, E.; Mckeown, K. Dreaddit: A Reddit Dataset for Stress Analysis in Social Media. In Proceedings of the Tenth International Workshop on Health Text Mining and Information Analysis (LOUHI 2019), Hong Kong, China, 3 November 2019; pp. 97–107. [Google Scholar]
- Mowery, D.L.; Bryan, C.; Conway, M. Towards developing an annotation scheme for depressive disorder symptoms: A preliminary study using twitter data. In Proceedings of the 2nd Workshop on Computational Linguistics and Clinical Psychology: From Linguistic Signal to Clinical Reality, Denver, CO, USA, 5 June 2015; pp. 89–98. [Google Scholar]
- Zimmerman, M.; Martinez, J.H.; Young, D.; Chelminski, I.; Dalrymple, K. Severity classification on the Hamilton depression rating scale. J. Affect. Disord. 2013, 150, 384–388. [Google Scholar] [CrossRef] [PubMed]
- Crossley, S.A.; Kyle, K.; McNamara, D.S. Sentiment Analysis and Social Cognition Engine (SEANCE): An automatic tool for sentiment, social cognition, and social-order analysis. Behav. Res. Methods 2017, 49, 803–821. [Google Scholar] [CrossRef]
- Stone, P.J.; Dunphy, D.C.; Smith, M.S. The General Inquirer: A Computer Approach to Content Analysis; MIT Press: Cambridge, MA, USA, 1966. [Google Scholar]
- Lasswell, H.D.; Namenwirth, J.Z. The Lasswell Value Dictionary; New Haven Publishing: New Haven, CT, USA, 1969; pp. 1–3. [Google Scholar]
- Martin, L.; Pu, P. Prediction of helpful reviews using emotions extraction. In Proceedings of the AAAI Conference on Artificial Intelligence, Palo Alto, CA, USA, 21 June 2014; Volume 28, pp. 1551–1557. [Google Scholar]
- Bradley, M.M.; Lang, P.J. Affective Norms for English Words (ANEW): Instruction Manual and Affective Ratings; Technical Report; The Center for Research in Psychophysiology: Gainesville, FL, USA, 1999. [Google Scholar]
- Mohammad, S.; Turney, P. Emotions evoked by common words and phrases: Using mechanical turk to create an emotion lexicon. In Proceedings of the NAACL HLT 2010 Workshop on Computational Approaches to Analysis and Generation of Emotion in Text, Los Angeles, CA, USA, 1–6 June 2010; pp. 26–34. [Google Scholar]
- Cambria, E.; Liu, Q.; Decherchi, S.; Xing, F.; Kwok, K. SenticNet 7: A commonsense-based neurosymbolic AI framework for explainable sentiment analysis. In Proceedings of the LREC 2022, Marseille, France, 20–25 June 2022. [Google Scholar]
- Gilbert, E.; Hutto, C.J. Vader: A parsimonious rule-based model for sentiment analysis of social media text. In Proceedings of the Eighth International Conference on Weblogs and Social Media (ICWSM-14), Ann Arbor, MI, USA, 1–4 June 2014; Volume 81, p. 82. [Google Scholar]
- Liu, Y.D.; Zeng, H.Q.; Li, R.L.; Hu, Y.F. Polarity text filtering based on semantic analysis. J.-China Inst. Commun. 2004, 25, 78–85. [Google Scholar]
- Pennebaker, J.W.; Francis, M.E.; Booth, R.J. Linguistic inquiry and word count: LIWC 2001. Mahway Lawrence Erlbaum Assoc. 2001, 71, 2001. [Google Scholar]
- van Cranenburgh, A. Python Readability Library. 2022. Available online: https://pypi.org/project/readability/ (accessed on 12 May 2023).
- Senter, R.; Smith, E.A. Automated Readability Index; Aerospace Medical Research Laboratories, Aerospace Medical Division, Air Force Systems Command: Lansing, MI, USA, 1967; Volume 66, p. 220. [Google Scholar]
- Mc Laughlin, G.H. SMOG grading-a new readability formula. J. Read. 1969, 12, 639–646. [Google Scholar]
- Araque, O.; Corcuera-Platas, I.; Sánchez-Rada, J.F.; Iglesias, C.A. Enhancing deep learning sentiment analysis with ensemble techniques in social applications. Expert Syst. Appl. 2017, 77, 236–246. [Google Scholar] [CrossRef]
- Reimers, N.; Gurevych, I. Sentence-BERT: Sentence Embeddings using Siamese BERT-Networks. In Proceedings of the 2019 Conference on Empirical Methods in Natural Language Processing and the 9th International Joint Conference on Natural Language Processing (EMNLP-IJCNLP). Association for Computational Linguistics, Hong Kong, China, 9 November 2019. [Google Scholar]
- Pedregosa, F.; Varoquaux, G.; Gramfort, A.; Michel, V.; Thirion, B.; Grisel, O.; Blondel, M.; Prettenhofer, P.; Weiss, R.; Dubourg, V.; et al. Scikit-learn: Machine Learning in Python. J. Mach. Learn. Res. 2011, 12, 2825–2830. [Google Scholar]
- Demšar, J. Statistical comparisons of classifiers over multiple data sets. J. Mach. Learn. Res. 2006, 7, 1–30. [Google Scholar]
- Sanh, V.; Debut, L.; Chaumond, J.; Wolf, T. DistilBERT, a distilled version of BERT: Smaller, faster, cheaper and lighter. arXiv 2019, arXiv:1910.01108. [Google Scholar]
- Iman, R.L.; Davenport, J.M. Approximations of the critical region of the Friedman statistic. Commun.-Stat.-Theory Methods 1980, 9, 571–595. [Google Scholar] [CrossRef]
- Lemaître, G.; Nogueira, F.; Aridas, C.K. Imbalanced-learn: A Python Toolbox to Tackle the Curse of Imbalanced Datasets in Machine Learning. J. Mach. Learn. Res. 2017, 18, 1–5. [Google Scholar]
- Yang, Z.; Shou, L.; Gong, M.; Lin, W.; Jiang, D. Model compression with two-stage multi-teacher knowledge distillation for web question answering system. In Proceedings of the 13th International Conference on Web Search and Data Mining, Houston, TX, USA, 3–7 February 2020; pp. 690–698. [Google Scholar]
- Liscio, E.; Araque, O.; Gatti, L.; Constantinescu, I.; Jonker, C.; Kalimeri, K.; Murukannaiah, P.K. What does a Text Classifier Learn about Morality? An Explainable Method for Cross-Domain Comparison of Moral Rhetoric. In Proceedings of the 61st Annual Meeting of the Association for Computational Linguistics (Volume 1: Long Papers), Toronto, ON, Canada, 9–14 July 2023; pp. 14113–14132. [Google Scholar]
Figure 1.
Overview of the proposed feature framework.

Figure 2.
The distribution of the information gain value for features within each set is examined for both datasets.
Figure 2.
The distribution of the information gain value for features within each set is examined for both datasets.

Figure 3.
General architecture representation of the proposed model.

Figure 4.
Feature set representation after running the Recursive feature elimination (RFE) method for each dataset. (a) shows the percentage of features that were selected from a certain category. (b) shows the distribution of features from each category between the selected features.
Figure 4.
Feature set representation after running the Recursive feature elimination (RFE) method for each dataset. (a) shows the percentage of features that were selected from a certain category. (b) shows the distribution of features from each category between the selected features.

Figure 5.
Normalized confusion matrices illustrating the performance of the model.


Table 1.
Statistics of the used datasets.
| DsD | DepSign | |
|---|---|---|
| No. posts | 3553 | 10,251 |
| Avg. word count | 88 | 171 |
| Avg. char count | 442 | 840 |
| Labels | minimal (2587), mild (290), moderate (394), severe (282) | not depressed (3503), moderate (5780), severe (968) |
Table 2.
Best performances achieved with the model for each feature set and dataset. Best results are indicated by bold numbers.
Table 2.
Best performances achieved with the model for each feature set and dataset. Best results are indicated by bold numbers.
| Dataset | DsD | DepSign | |||||
|---|---|---|---|---|---|---|---|
| Model | Feature Set | F1-Score | Precision | Recall | F1-Score | Precision | Recall |
| Affective | 0.6873 | 0.6763 | 0.7053 | 0.5661 | 0.5648 | 0.5817 | |
| Social | 0.6673 | 0.6552 | 0.6842 | 0.5477 | 0.5544 | 0.5758 | |
| Syntactic | 0.6765 | 0.6766 | 0.6800 | 0.5902 | 0.5883 | 0.6018 | |
| Topic | 0.6762 | 0.6631 | 0.6952 | 0.5547 | 0.5811 | 0.5844 | |
| All | 0.7112 | 0.7117 | 0.7123 | 0.6080 | 0.6086 | 0.6154 | |
| All (RFE) | 0.7189 | 0.7172 | 0.7233 | 0.6129 | 0.6136 | 0.6223 | |
Table 3.
Best performances (F1-score, precision, and recall) attained by the model for each word embedding method and dataset. Best results are indicated by bold numbers.
Table 3.
Best performances (F1-score, precision, and recall) attained by the model for each word embedding method and dataset. Best results are indicated by bold numbers.
| Dataset | DsD | DepSign | |||||
|---|---|---|---|---|---|---|---|
| Model | Embeddings | F | P | R | F | P | R |
| FastText | 0.7041 | 0.6767 | 0.7079 | 0.6040 | 0.6034 | 0.6224 | |
| all-mpnet-base-v2 | 0.7238 | 0.7221 | 0.7256 | 0.6322 | 0.6289 | 0.6397 | |
| all-distilroberta-v1 | 0.7211 | 0.7244 | 0.7230 | 0.6325 | 0.6399 | 0.6335 | |
Table 4.
Best performances (F1-score) achieved with the model and comparisons of these results with those obtained using transformer-based models and the rest of the models proposed in this article. Best results are indicated by bold numbers.
Table 4.
Best performances (F1-score) achieved with the model and comparisons of these results with those obtained using transformer-based models and the rest of the models proposed in this article. Best results are indicated by bold numbers.
| Method | DsD | DepSign |
|---|---|---|
| BERT | 0.7100 | 0.5990 |
| MentalBERT | 0.7167 | 0.6094 |
| 0.7194 | 0.6117 | |
| 0.7238 | 0.6325 | |
| 0.7438 | 0.6394 |
Table 5.
Friedman rank for the top-5 methods.
| Method | Rank |
|---|---|
| 1.0 | |
| (all-distilroberta-v1) | 2.5 |
| (all-mpnet-base-v2) | 2.5 |
| 4.0 | |
| MentalBERT | 5.0 |
Table 6.
Complete performances (F1-score, precision, and recall averaged and with standard deviations for each class) obtained by each model for each dataset.
Table 6.
Complete performances (F1-score, precision, and recall averaged and with standard deviations for each class) obtained by each model for each dataset.
| Dataset | DsD | DepSign | |||||
|---|---|---|---|---|---|---|---|
| Undersampling | Model | F | P | R | F | P | R |
| No | 0.72 ± 0.23 | 0.72 ± 0.22 | 0.72 ± 0.24 | 0.61 ± 0.13 | 0.61 ± 0.06 | 0.62 ± 0.19 | |
| 0.72 ± 0.22 | 0.72 ± 0.21 | 0.72 ± 0.22 | 0.63 ± 0.09 | 0.64 ± 0.07 | 0.63 ± 0.11 | ||
| 0.74 ± 0.21 | 0.75 ± 0.21 | 0.74 ± 0.20 | 0.64 ± 0.08 | 0.64 ± 0.06 | 0.64 ± 0.10 | ||
| Yes | 0.48 ± 0.07 | 0.49 ± 0.03 | 0.49 ± 0.14 | 0.52 ± 0.11 | 0.53 ± 0.04 | 0.54 ± 0.18 | |
| 0.48 ± 0.10 | 0.49 ± 0.02 | 0.49 ± 0.18 | 0.59 ± 0.09 | 0.60 ± 0.04 | 0.60 ± 0.15 | ||
| 0.55 ± 0.05 | 0.56 ± 0.01 | 0.56 ± 0.10 | 0.61 ± 0.09 | 0.61 ± 0.05 | 0.62 ± 0.13 | ||
Table 7.
Best performances achieved with the model and comparisons of these results with the best-performing approaches found in the literature. Best results are indicated by bold numbers.
Table 7.
Best performances achieved with the model and comparisons of these results with the best-performing approaches found in the literature. Best results are indicated by bold numbers.
| Dataset | Method | Precision | Recall | F1-Score |
|---|---|---|---|---|
| DsD | Ilias et al. [20] | 0.7374 | 0.7323 | 0.7316 |
| 0.7512 | 0.7388 | 0.7438 | ||
| DepSign | Poswiata et al. [32] | 0.663 | 0.621 | 0.637 |
| 0.5870 | 0.6138 | 0.5867 |
Disclaimer/Publisher’s Note: The statements, opinions and data contained in all publications are solely those of the individual author(s) and contributor(s) and not of MDPI and/or the editor(s). MDPI and/or the editor(s) disclaim responsibility for any injury to people or property resulting from any ideas, methods, instructions or products referred to in the content. |
© 2023 by the authors. Licensee MDPI, Basel, Switzerland. This article is an open access article distributed under the terms and conditions of the Creative Commons Attribution (CC BY) license (https://creativecommons.org/licenses/by/4.0/).
Share and Cite
MDPI and ACS Style
Muñoz, S.; Iglesias, C.Á. Detection of the Severity Level of Depression Signs in Text Combining a Feature-Based Framework with Distributional Representations. Appl. Sci. 2023, 13, 11695. https://doi.org/10.3390/app132111695
AMA Style
Muñoz S, Iglesias CÁ. Detection of the Severity Level of Depression Signs in Text Combining a Feature-Based Framework with Distributional Representations. Applied Sciences. 2023; 13(21):11695. https://doi.org/10.3390/app132111695
Chicago/Turabian StyleMuñoz, Sergio, and Carlos Á. Iglesias. 2023. "Detection of the Severity Level of Depression Signs in Text Combining a Feature-Based Framework with Distributional Representations" Applied Sciences 13, no. 21: 11695. https://doi.org/10.3390/app132111695
Note that from the first issue of 2016, this journal uses article numbers instead of page numbers. See further details here.