
Exploration of the effects of a degS mutant on the growth of Vibrio cholerae and the global regulatory function of degS by RNA sequencing
- Published
- Accepted
- Received
- Academic Editor
- Sandhya Visweswariah
- Subject Areas
- Genomics, Microbiology
- Keywords
- Vibrio cholerae, DegS, Growth, RNA sequencing
- Copyright
- © 2019 Huang et al.
- Licence
- This is an open access article distributed under the terms of the Creative Commons Attribution License, which permits unrestricted use, distribution, reproduction and adaptation in any medium and for any purpose provided that it is properly attributed. For attribution, the original author(s), title, publication source (PeerJ) and either DOI or URL of the article must be cited.
- Cite this article
- 2019. Exploration of the effects of a degS mutant on the growth of Vibrio cholerae and the global regulatory function of degS by RNA sequencing. PeerJ 7:e7959 https://doi.org/10.7717/peerj.7959
Abstract
Background
DegS is a periplasmic serine protease that is considered to be the initiator of the σE stress response pathway, and this protein plays an important role in the regulation of the stress response in E. coli. However, knowledge of the biological function and global regulatory network of DegS in Vibrio cholerae remains limited. In this study, we aimed to characterize the molecular functions and further investigate the regulatory network of degS in V. cholerae.
Methods
A deletion mutant of degS was constructed in the V. cholerae HN375 strain. Bacterial colony morphology was observed by a plate-based growth experiment, and bacterial growth ability was observed by a growth curve experiment. High-throughput RNA sequencing (RNA-Seq) technology was used to analyze the differential transcriptomic profiles between the wild-type and degS mutant strains. Gene ontology (GO), pathway analysis and Gene-Act-network analysis were performed to explore the main functions of the differentially expressed genes. Quantitative real-time PCR (qRT-PCR) was performed to validate the reliability and accuracy of the RNA-Seq analysis. The complementation experiments were used to test the roles of degS and ropS in the small colony degS mutant phenotype.
Results
When degS was deleted, the degS mutant exhibited smaller colonies on various media and slower growth than the wild-type strain. A total of 423 differentially expressed genes were identified, including 187 genes that were upregulated in the degS mutant compared to the wild-type strain and 236 genes that were relatively downregulated. GO categories and pathway analysis showed that many differentially expressed genes were associated with various cellular metabolic pathways and the cell cycle. Furthermore, Gene-Act network analysis showed that many differentially expressed genes were involved in cellular metabolic pathways and bacterial chemotaxis. The cAMP-CRP-RpoS signaling pathway and the LuxPQ signal transduction system were also affected by the degS mutant. The expression patterns of nine randomly selected differentially expressed genes were consistent between the qRT-PCR and RNA-seq results. The complementation experiments showed that the small colony degS mutant phenotype could be partially restored by complementation with the pBAD24-degS or pBAD24-rpoS plasmid.
Discussion
These results suggest that the degS gene is important for normal growth of V. cholerae. Some of the differentially expressed genes were involved in various cellular metabolic processes and the cell cycle, which may be associated with bacterial growth. Several new degS-related regulatory networks were identified. In addition, our results suggested that the cAMP-CRP-RpoS signaling pathway may be involved in the small colony degS mutant phenotype. Overall, we believe that these transcriptomic data will serve as useful genetic resources for research on the functions of degS in V. cholerae.
Introduction
Vibrio cholerae is the pathogen that causes cholera. According to statistical data from the World Health Organization, there are approximately 1.4–4.3 million cases of acute diarrheal diseases worldwide per year, including 28,000–142,000 deaths (Ali et al., 2012). At present, more than 200 serotypes of V. cholerae have been identified based on the different O antigenic lipopolysaccharides (Chatterjee & Chaudhuri, 2003). Only the O1 and O139 serogroups are associated with epidemic and pandemic cholera (Mutreja et al., 2011), while non-O1/non-O139 serogroups can cause sporadic local cholera outbreaks, mild and transient gastrointestinal diseases and extraintestinal infections (Aydanian et al., 2015). However, there have been increasing reports of non-O1 and non-O139 diseases in recent years, and there have even been reports of death in extreme cases (Petsaris et al., 2010; Trubiano et al., 2014; Hao et al., 2015). Knowledge regarding the pathogenic mechanism of non-O1/non-O139 V. cholerae remains limited. Hence, a wide range of studies on both the biological characteristics and pathogenesis of non-O1/non-O139 V. cholerae is important.
DegS is an important molecular stress sensor in the periplasm of bacteria that strictly controls the σE-dependent stress response pathway (Zeth, 2004). In E. coli, many misfolded proteins are produced when the bacteria are exposed to stress. These misfolded proteins can bind to the PDZ domain of DegS, leading to the activation of DegS, which cleavage of RseA initiates proteolytic cascade processes, resulting in release of σE that ultimately activates transcription of stress response genes (Walsh et al., 2003; De Regt, Baker & Sauer, 2015). DegS is required for the growth of E. coli. When degS was depleted in E. coli MC1061 strain, the cells failed to grow on M9 complete minimal media at 30 and 37 °C (Alba et al., 2001). Furthermore, DegS plays an important role in the virulence of extraintestinal E. coli infections, including sepsis, meningitis and urinary tract infections (Redford, Roesch & Welch, 2003). There is growing concern regarding the roles of DegS in E. coli, but our knowledge of the roles of this protein in V. cholerae remains limited. In V. cholerae, OmpU interact with the PDZ-domain of DegS and further activate σE signaling pathway to resist antimicrobial peptides (Mathur, Davis & Waldor, 2007). Additionally, recent studies have shown that ToxR, a virulence regulator, is also a substrate for degS (Lembke et al., 2018). In the present study, we showed that the degS deletion mutant significantly impaired the growth of non-O1/non-O139 V. cholerae. The degS deletion of V. cholerae exhibited smaller colonies and slower growth than the wild-type strain. However, the molecular mechanisms remain unknown. To uncover the potential roles of degS in V. cholerae growth and further investigate the global regulatory role of degS in V. cholerae, a comparative transcription analysis was performed in the non-O1/non-O139 V. cholerae wild-type and degS deletion mutant strains using high-throughput RNA sequencing (RNA-Seq) to identify the differentially expressed genes. Gene ontology (GO), pathway analysis and Gene-Act-network analysis were performed to explore the main functions of the differentially expressed genes. We aimed to identify genes that may be involved in degS regulation for bacterial growth and guide future studies on the function and regulatory network of degS.
Materials and Methods
Strain cultivation and DNA manipulation
The V. cholerae HN375 strain is a non-O1/non-O139 strain collected by the China Center for Type Culture Collection with accession number CCTCC AB209168 (Luo et al., 2011). This strain was used as the wild-type strain in this study. V. cholerae was cultured in Luria Bertani (LB) liquid medium with shaking or on LB agar plates at 37 °C. The degS in-frame deletion mutants were generated by the suicide vector pWM91 as described previously (Metcalf et al., 1996). To complement the expression of degS and rpoS in degS mutant strains, the degS gene and rpoS gene fragments were amplified and then ligated into the expression vector pBAD24 (Guzman et al., 1995). The pBAD24-degS and pBAD24-rpoS plasmid were transformed into the V. cholerae degS mutant, respectively. Subsequently, these strains were cultured in LB medium supplemented with 0.1% arabinose to induce gene expression.
Bacterial growth experiments
The V. cholerae HN375 wild-type and degS deletion mutant strains were cultured on Columbia blood agar plates for 16 h at 37 °C. For the plate-based growth experiment, bacteria were picked and inoculated onto blood agar, thiosulfate citrate bile salts sucrose (TCBS) agar, MacConkey agar and LB agar plates using the sectional streak method, and the bacterial morphology was observed after 24 h. The complement strains cultured in LB medium supplemented with 0.1% arabinose, the plate-based growth experiment was performed as described above. Colony size was measured by image J software. The significant differences in the colony diameters were performed with independent-sample t-tests using GraphPad Prism 5.0 software (GraphPad Software, San Diego, CA, USA). For the growth curve experiment, a 0.5 McFarland’s standard of fresh bacterial suspension was prepared. The 100-μl bacterial suspensions were seeded into 100 ml of fresh LB liquid medium with shaking at 37 °C, and the OD600 values were recorded once per hour. Three technical replicates were performed for each strain. The above experiments were repeated independently three times. The significant differences in the growth curve assays were determined with two-way ANOVA using GraphPad Prism 5.0 software (GraphPad Software, San Diego, CA, USA).
RNA-Seq data analysis
For in vitro RNA preparation, the wild-type and degS deletion mutant strains were grown to mid-exponential phase (OD600 of ~0.6) in LB liquid medium. Total RNA was extracted from the wild-type and degS deletion mutant using TRIzol reagent (Takara, Dalian, China). After quality control, the cDNA libraries were prepared, and sequencing was performed by NovelBio Bio-Pharm Technology Co. Ltd. (Shanghai, China). Raw reads were generated and filtered. The clean reads were used for mapping to the V. cholerae N16961 reference genome (RefSeq accession numbers NC_002505 and NC_002506) using Misplacing software (Wang et al., 2010). Gene expression was determined and normalized using the reads per kilobase per million (Mortazavi et al., 2008). Differential expression between the degS deletion mutant and wild-type strains was identified by the DEseq package (Audic & Claverie, 1997). After statistical analysis, the differentially expressed genes were defined according to fold change >1.5 or fold change <0.667 and the false discovery rate (FDR) threshold (FDR < 0.05).
Gene ontology and pathway analyses
To analyze the main functions of the differentially expressed genes, the differentially expressed genes corresponding to GO terms in the GO database were mapped using the GO-Term Finder tool (Boyle et al., 2004). The differentially expressed genes were annotated in the following three main categories based on the database analysis: biological processes, molecular functions and cellular components. Significantly enriched GO terms were limited to categories with P-value < 0.05.
To identify significantly enriched pathways, pathway annotations of the differentially expressed genes were performed according to the Kyoto Encyclopedia of Genes and Genomes (KEGG) database (Aoki-Kinoshita & Kanehisa, 2007). The significantly enriched pathways were selected based on Fisher’s exact test and were defined as having P-value < 0.05.
Gene-Act network
The Gene-Act network was established according to the gene–gene relationships in the KEGG database, including activation, binding, expression, inhibition and compound (Binder & Schumacher, 2008; Wang et al., 2013), which helped identify the main signaling pathways and key regulatory genes.
Validation of RNA-Seq data by qRT-PCR
To validate the RNA-Seq data, Quantitative real-time PCR (qRT-PCR) was performed to determine the mRNA expression level. Briefly, total RNA from the wild-type and degS deletion mutant strains was used for cDNA synthesis using the PrimeScript RT Reagent Kit (Takara, Dalian, China). The qRT-PCR assays were performed using the CFX Connect Real-Time System (Bio-Rad, Hercules, CA, USA) and SYBR Premix Ex Taq Kit (Takara, Dalian, China). The 16s RNA was used as an endogenous reference gene, and the relative changes in gene expression were calculated based on the 2−ΔΔCt method. The primer sequences used are shown in Table S1. Comparisons among groups were performed with independent-sample t-tests using GraphPad Prism 5.0 software (GraphPad Software, San Diego, CA, USA).
Results
The degS gene is important for normal growth of V. cholerae
To explore the biological functions of degS in V. cholerae, we constructed a deletion mutant of degS in the V. cholerae HN375 strain. The colonies of the degS mutant on blood agar, TCBS agar, MacConkey agar and LB agar plates were consistently smaller than those of the wild-type strain (Figs. 1A–1I). Next, we compared the bacterial growth curves of the degS mutant and wild-type strains. The degS mutant has a longer log phase than the wild-type strain (Fig. 1J). After entering the exponential growth phase, the wild-type and degS mutant have similar growth rate, while in the stationary phase, the density of degS mutant was lower than that of the wild-type strain. Together, these results suggest that degS is important for normal growth of V. cholerae.
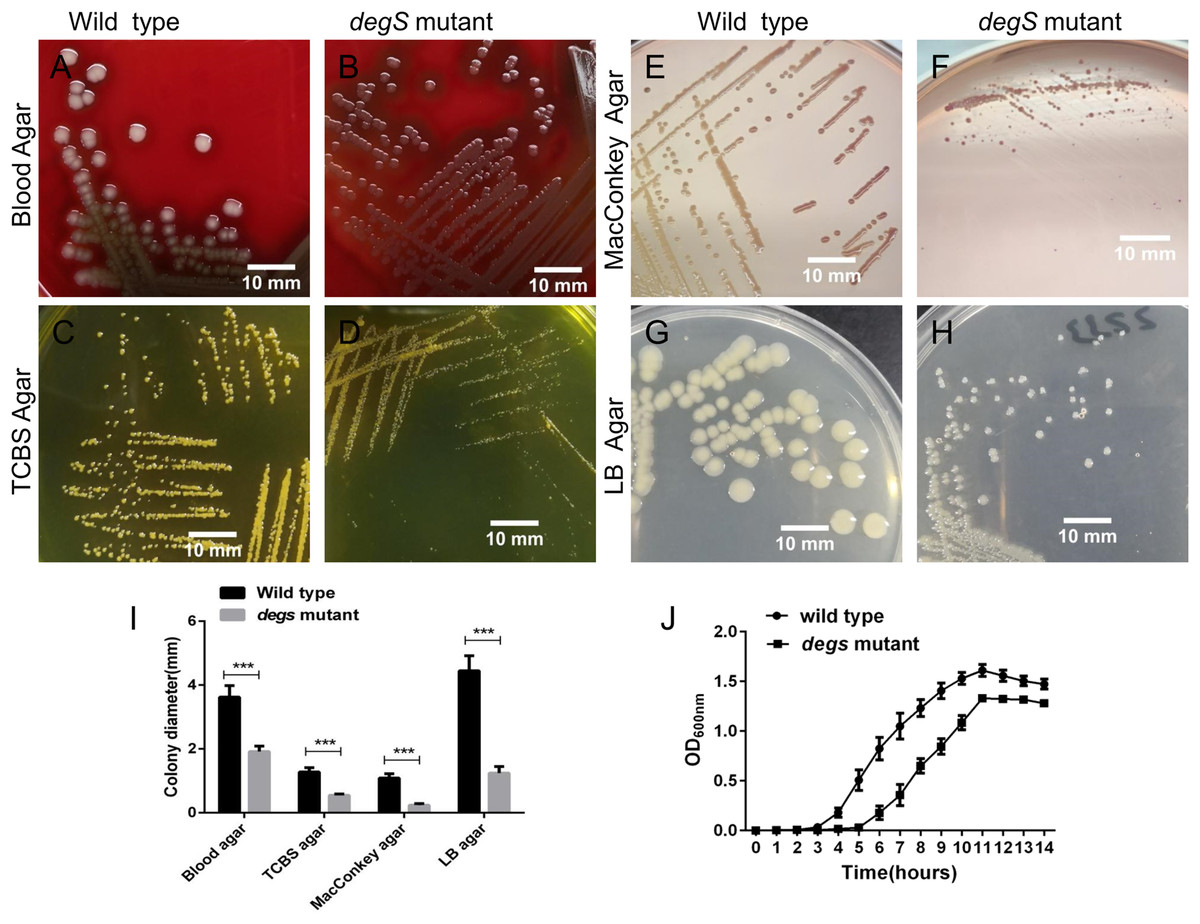
Figure 1: The degS deletion affects the colony size and growth curves of V. cholerae.
(A–H) The small colony phenotype of the degS mutant on blood agar, TCBS agar, MacConkey agar and LB agar plates after 24 h of cultivation. (I) Colony diameters. Shown is the average colony diameter of the degS mutant and wild-type strains. Error bars represent the standard deviation (SD) of the mean of 10 colonies. ***P < 0.001. (J) Growth curves of the degS mutant and wild-type strains. The bacterial densities in LB liquid medium were determined by measuring the absorbance at the indicated time points. The values represent the mean with SD of three independent experiments.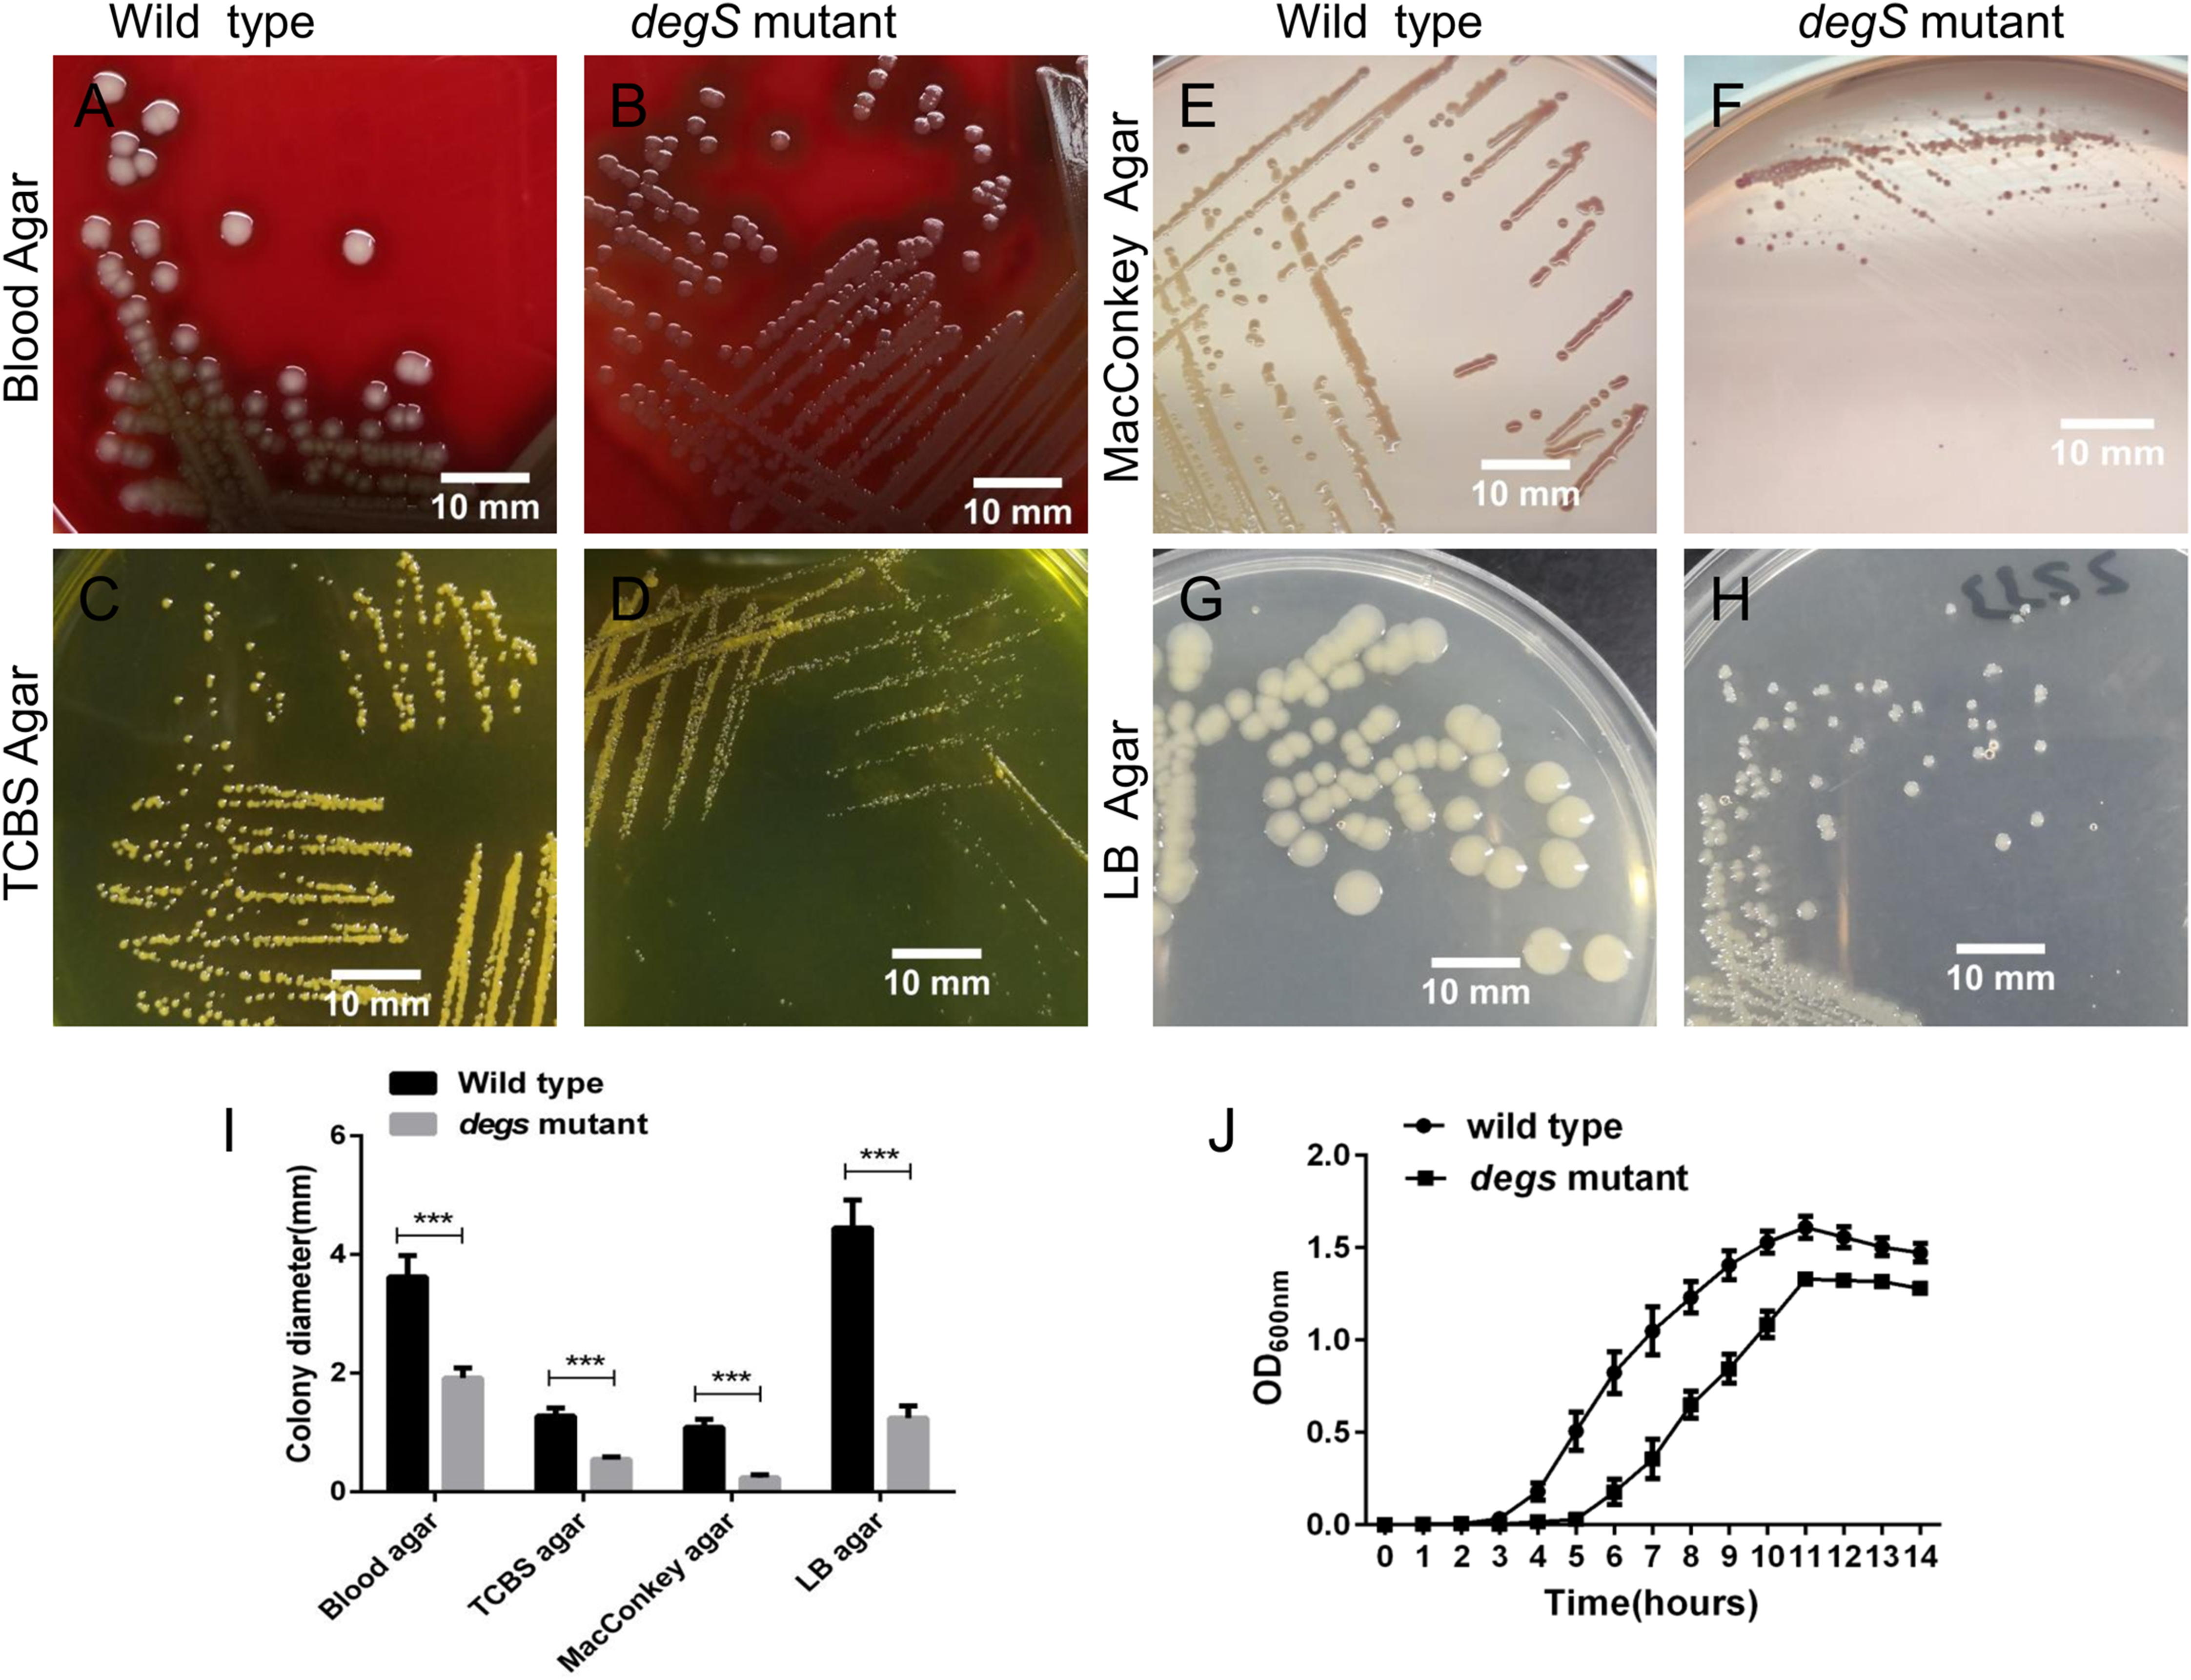
Analysis of differential gene expression
To explore the molecular changes in the response to the degS deletion mutant in V. cholerae, we performed a comparative gene expression analysis between the degS deletion mutant and wild-type strains using RNA-Seq. After sequencing and data analysis, the differentially expressed genes were identified using the following criteria: fold change in expression >1.5 or <0.667 and FDR < 0.05. In total, 423 differentially expressed genes were identified (Fig. 2A), including 187 upregulated genes and 236 downregulated genes (Fig. 2B; Table S2). To our knowledge, some of the genes associated with energy metabolism and cell division were also found in this analysis, such as VC0485 (pyruvate kinase), VC2738 (phosphoenolpyruvate carboxykinase), VCA0843 (glyceraldehyde-3-phosphate dehydrogenase) and murB, which may affect bacterial growth. Together, our results show distinct gene profiles between the wild-type and degS mutant strains, suggesting that the degS deletion mutant can produce unique gene profiles that may be associated with V. cholerae growth.
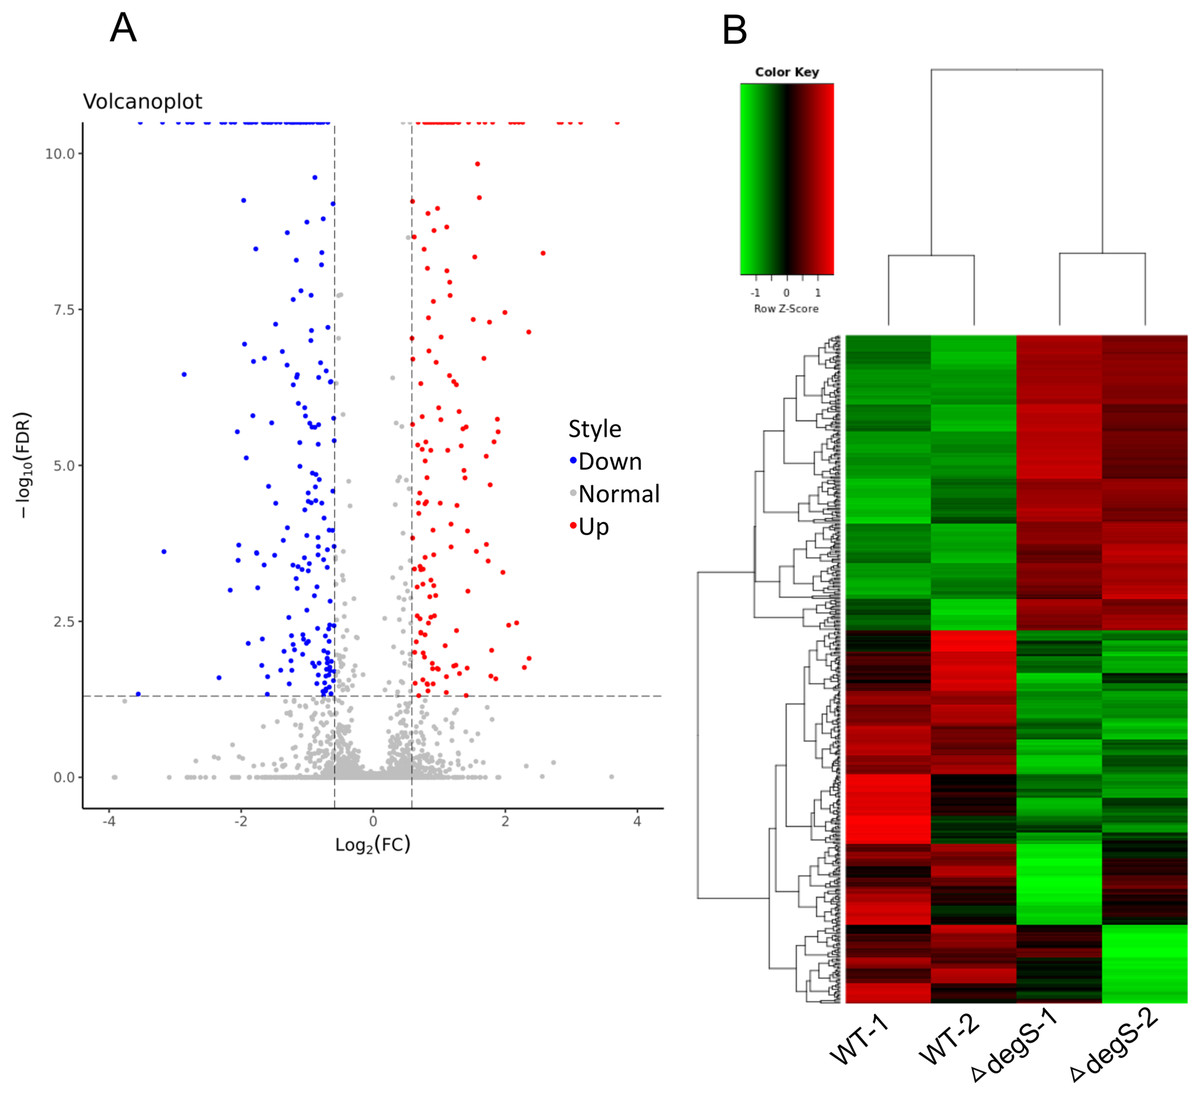
Figure 2: Differentially expressed genes between the degS mutant and wild-type (WT) strains.
(A) A volcano plot showing the differentially expressed genes. Red represents the upregulated genes, green represents the downregulated genes and gray represents the unchanged genes. (B) A clustering heatmap showing the differentially expressed genes.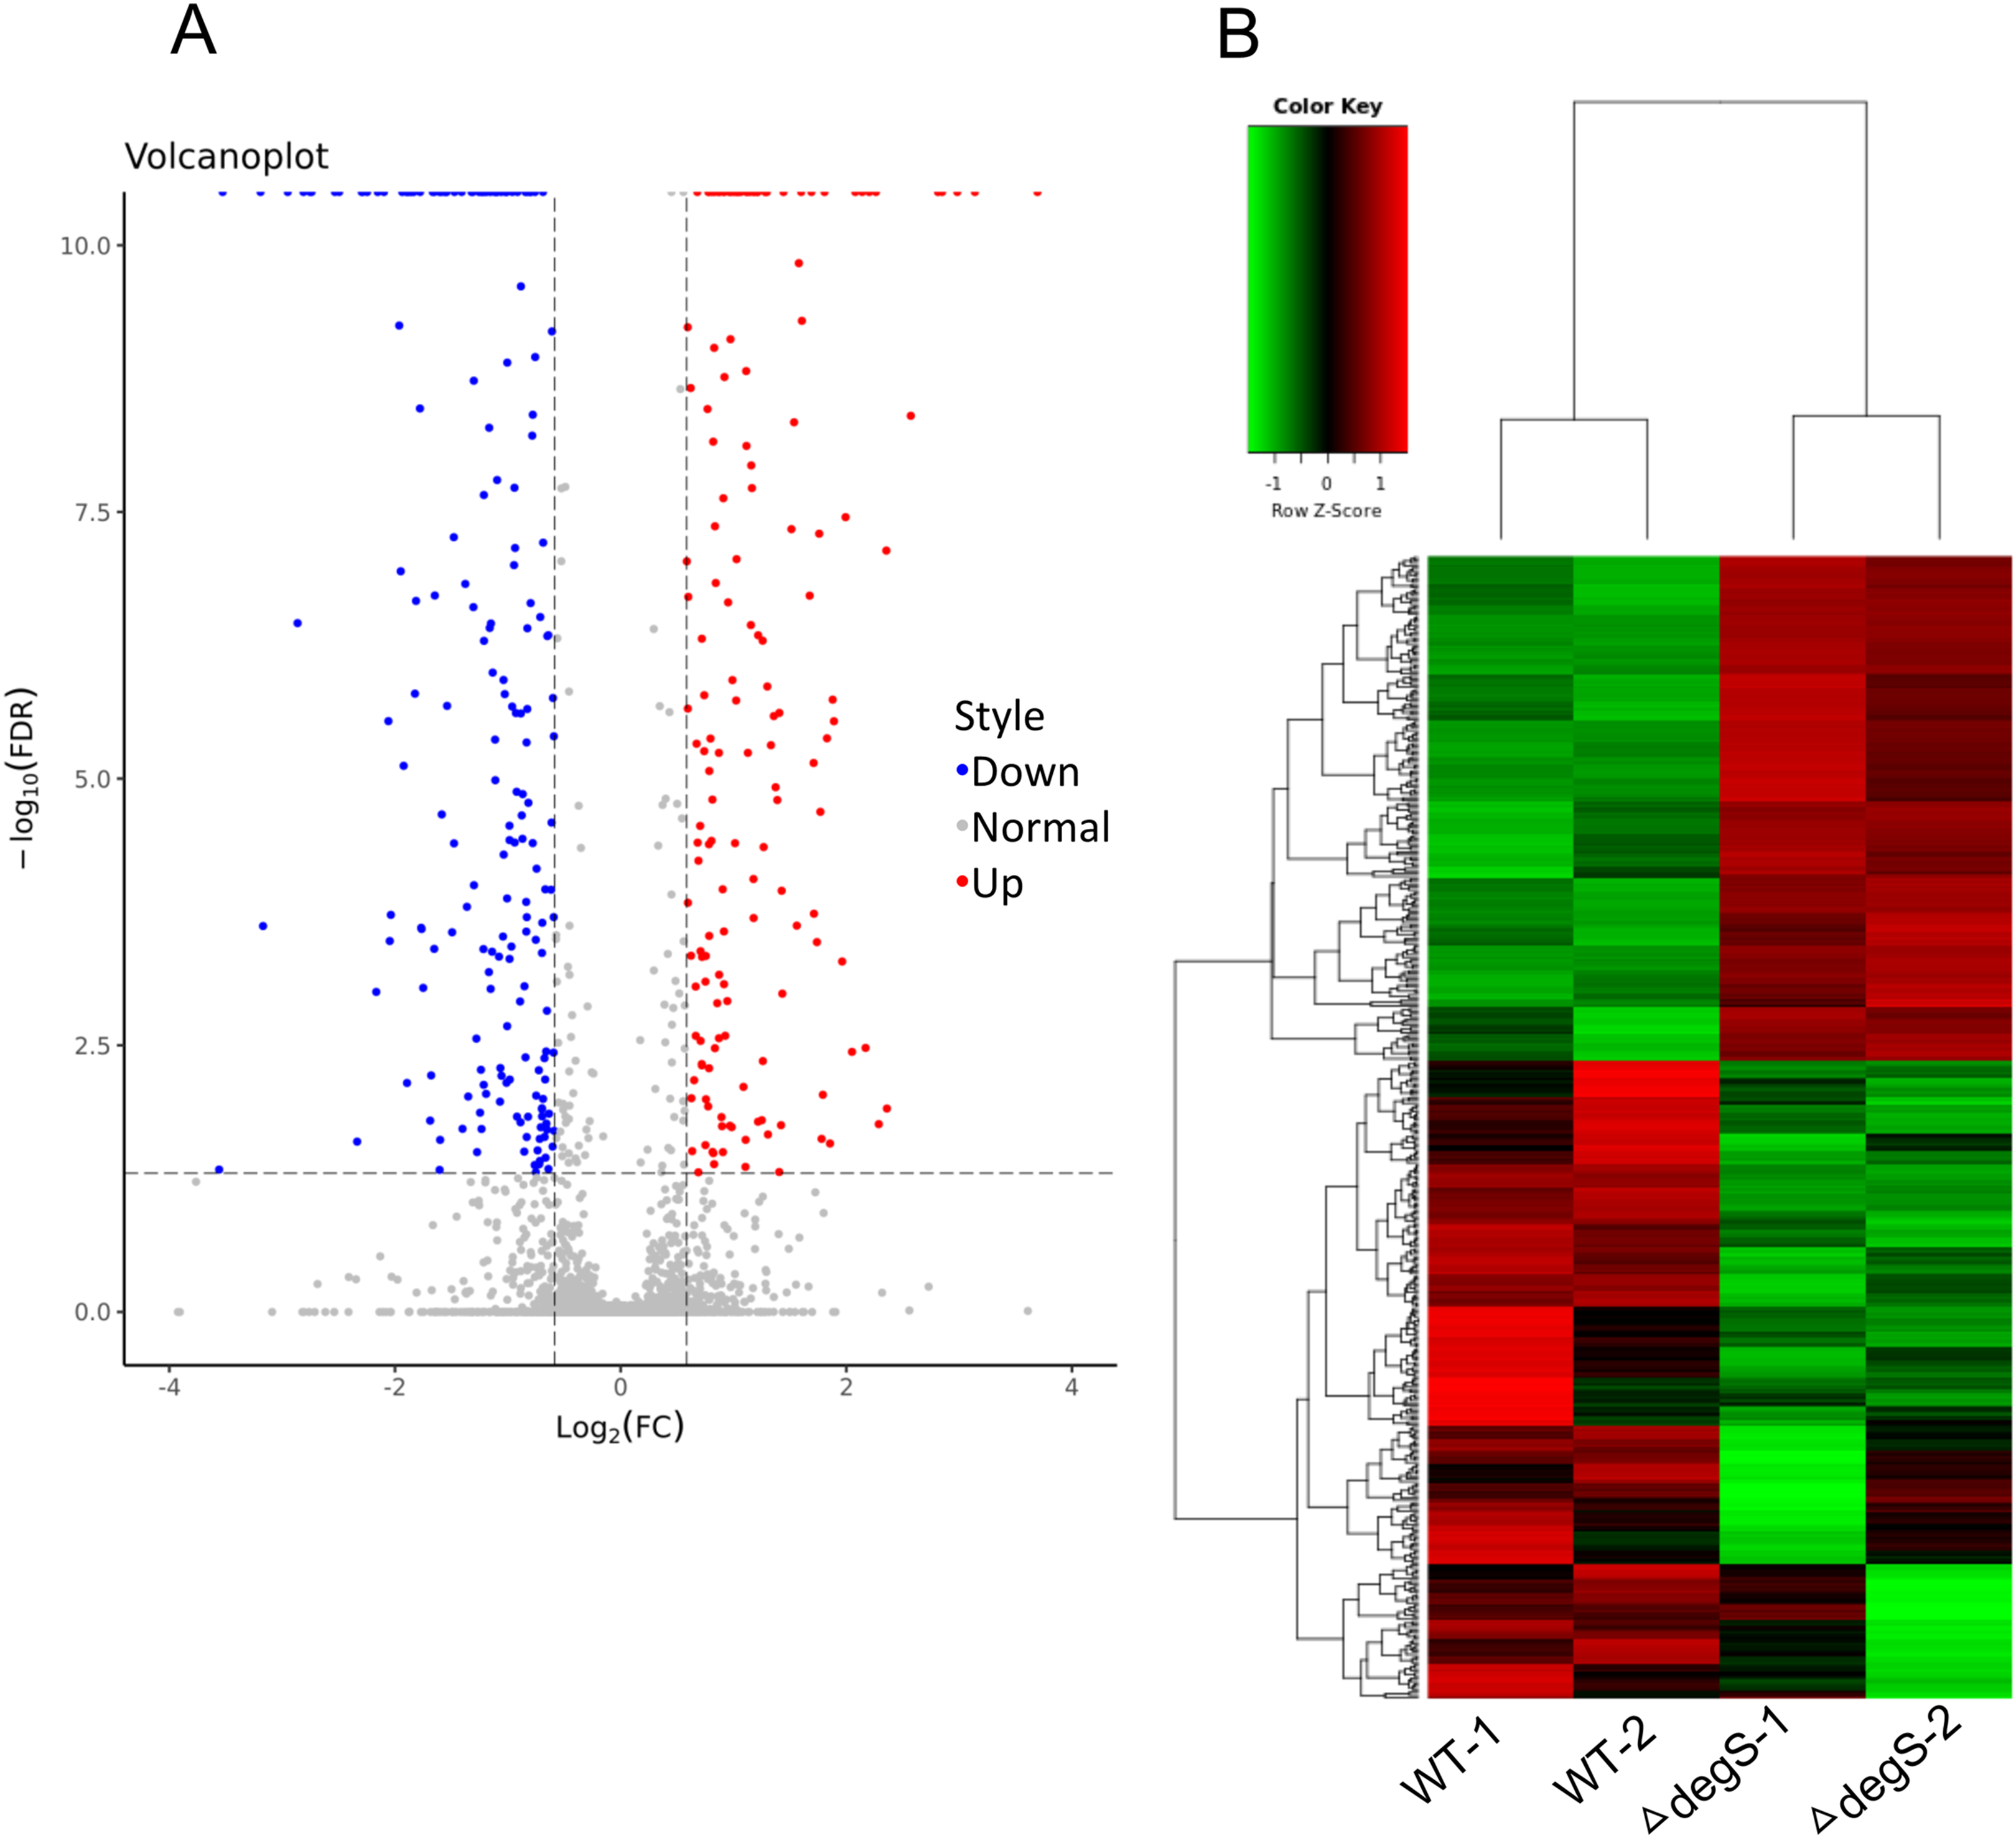
GO analysis of differentially expressed genes
To understand the main functions of the differentially expressed genes, GO analysis was performed according to the GO project. Based on our RNA-Seq data, the primary GO categories for the downregulated GO terms were focused on transmembrane transport, oligopeptide transmembrane transport, lipid metabolic process, glucose metabolic process, negative regulation of phosphate metabolic process, regulation of cell division and others (Fig. 3A). Notably, the GO categories include the lipid metabolic process, glucose metabolic process, negative regulation of the phosphate metabolic process, leucine metabolic process and generation of precursor metabolites and energy, which are related to cellular metabolism. In addition, we found that the GO term categories for the regulation of cell division, regulation of cell septum assembly and regulation of the cell cycle were associated with bacterial growth. The main GO terms for the upregulated genes were the cellular response to iron ion, intracellular protein transmembrane transport, coenzyme A biosynthetic process and others (Fig. 3B).
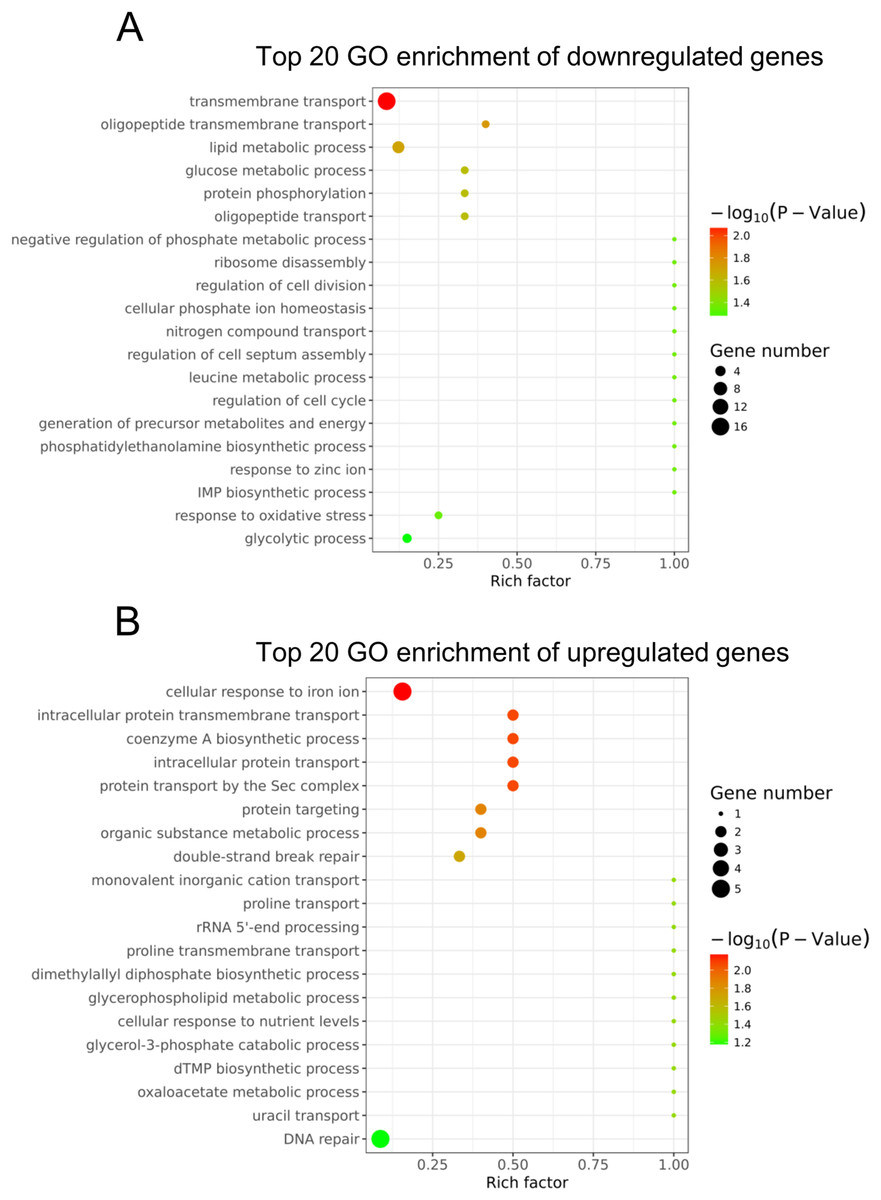
Figure 3: Gene ontology analysis of the differentially expressed genes.
(A) The top 20 GO terms annotated in the biological process category for the downregulated genes. (B) The top 20 GO terms annotated in the biological process category for the upregulated genes.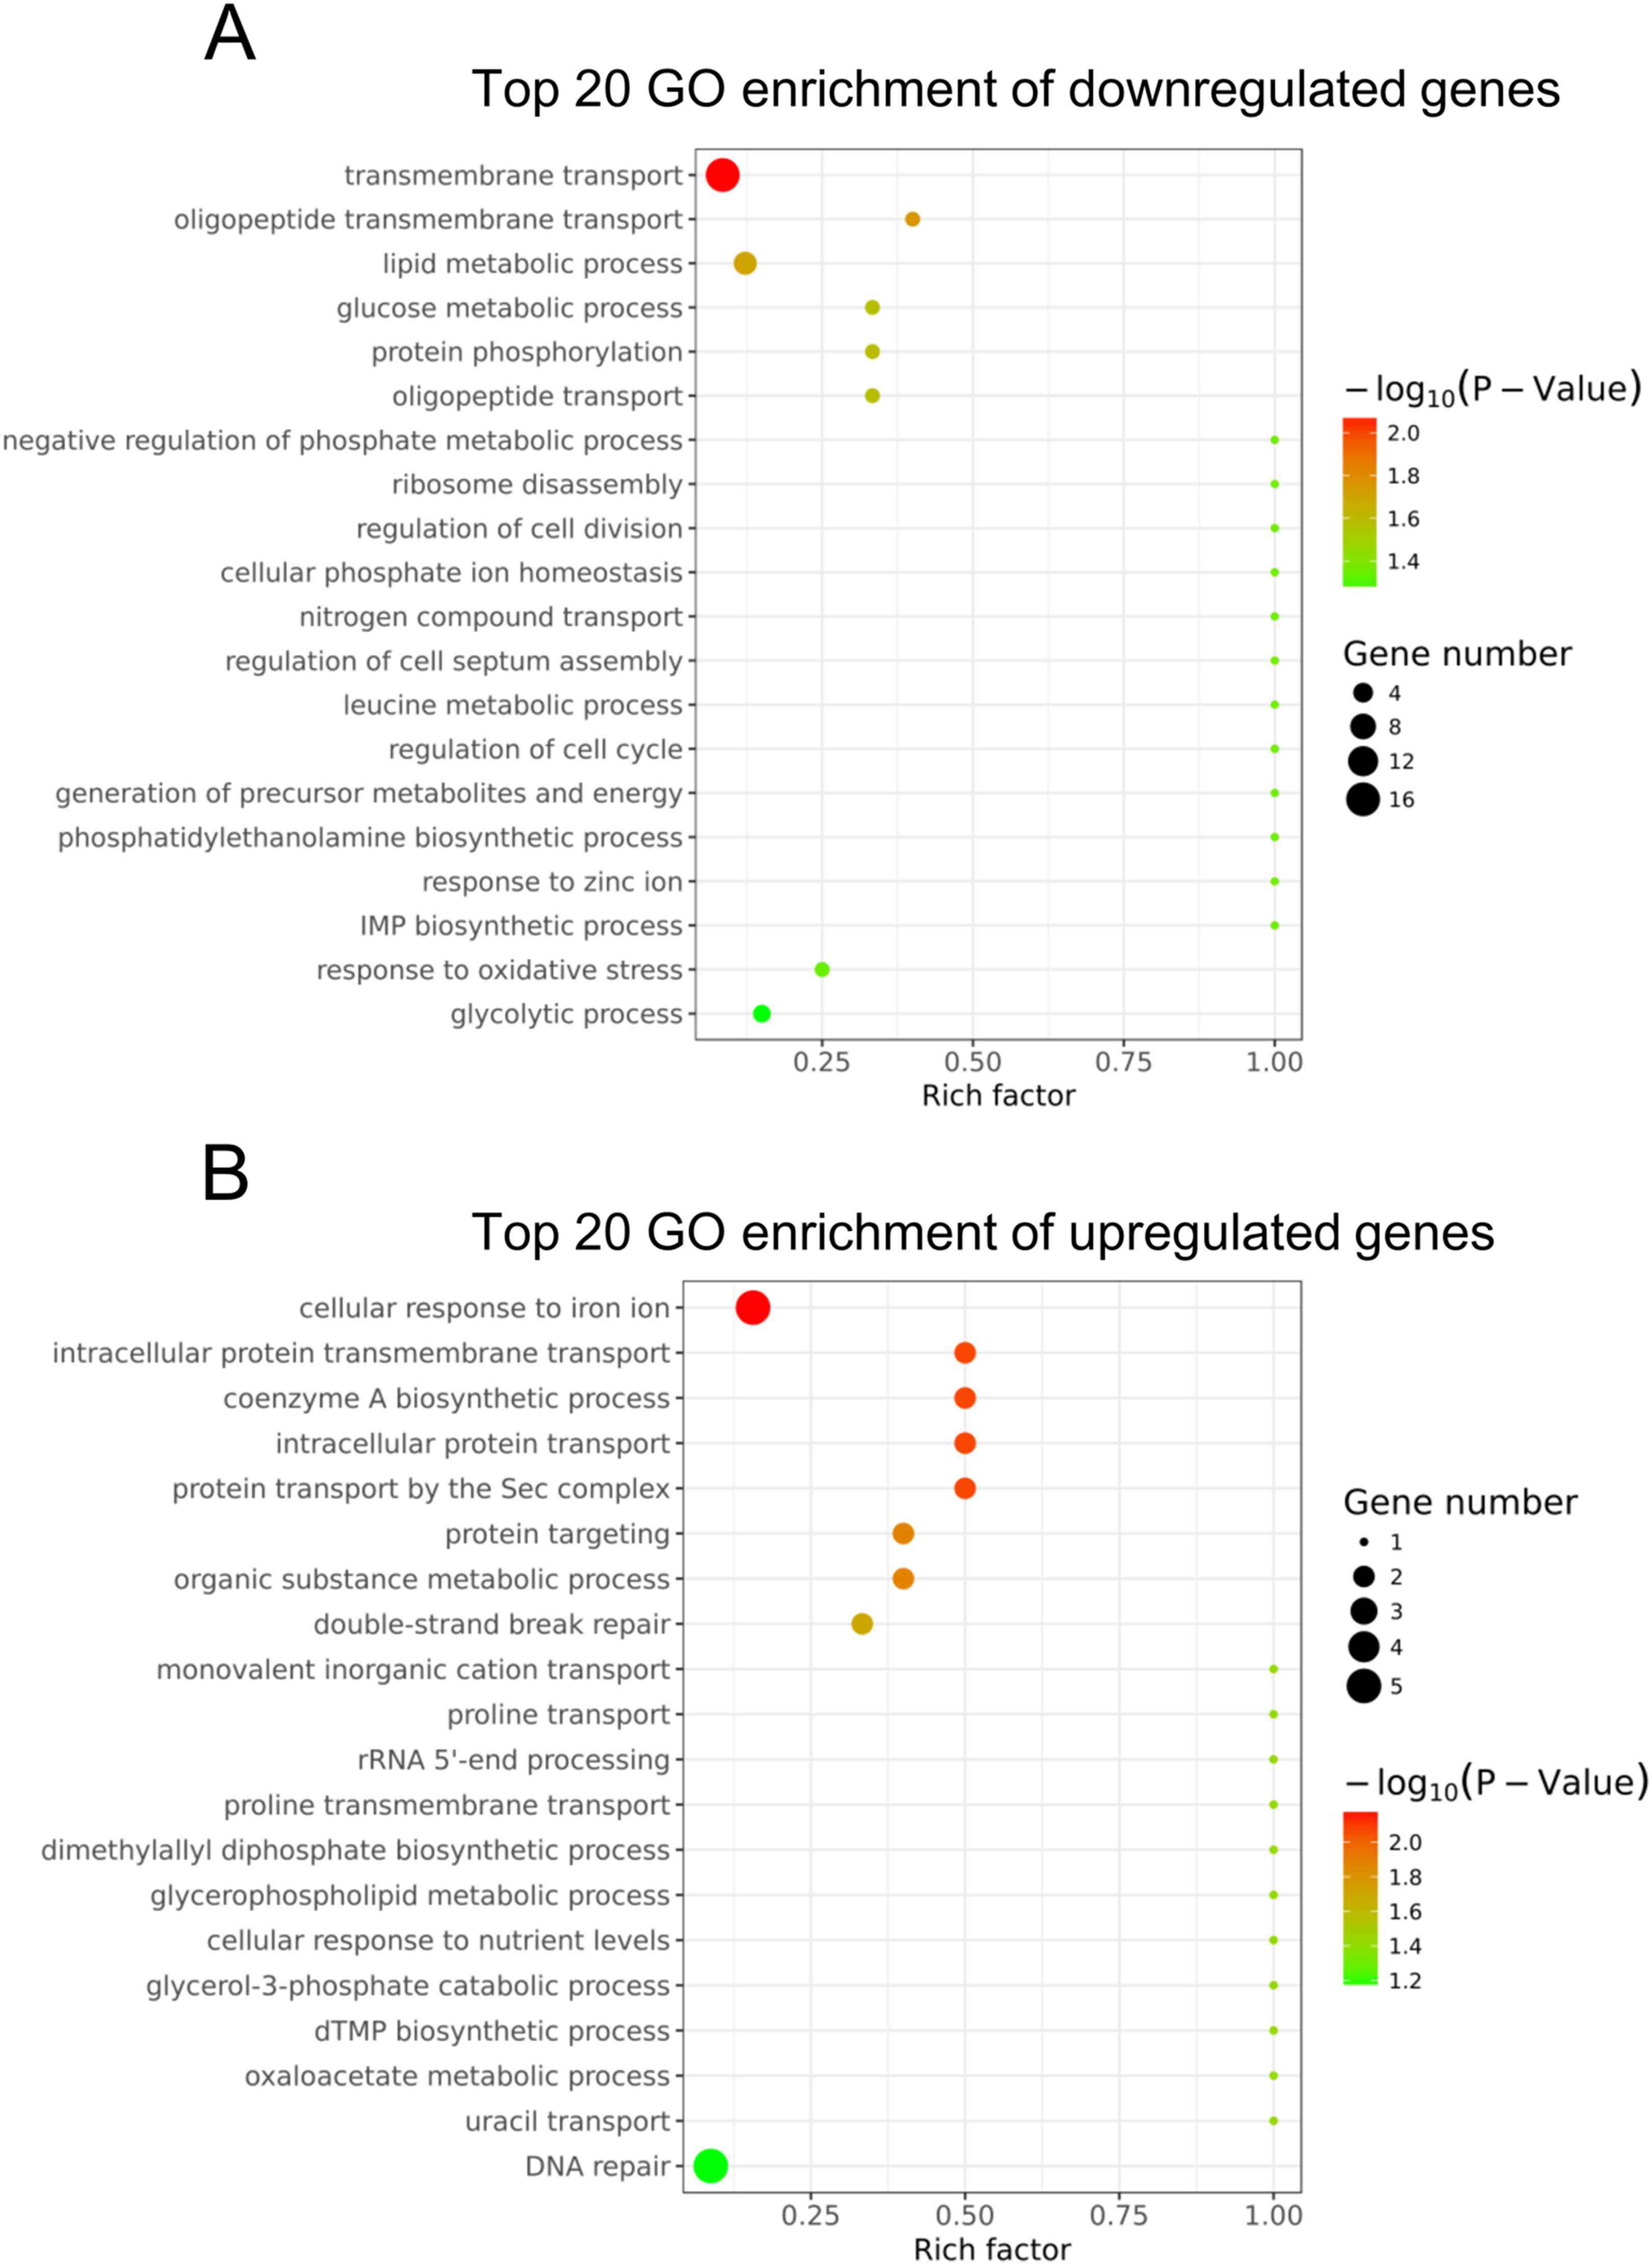
Pathway analysis
To identify the significant pathways, KEGG enrichment pathway analysis was performed based on the KEGG database. The results showed that the 423 differentially expressed genes were mapped to 65 pathways. The top 20 enriched pathways are shown in Fig. 4. Overall, seven statistically significant enriched pathways were defined by the hypergeometric test (Table 1). The statistically significant enriched pathways were mainly involved in glycolysis/gluconeogenesis; carbon metabolism; glycine, serine and threonine metabolism; the citrate cycle (TCA cycle); energy metabolism; valine, leucine and isoleucine degradation; and pyruvate metabolism. These results suggest that there is a regulatory relationship between degS and cellular metabolic pathways.
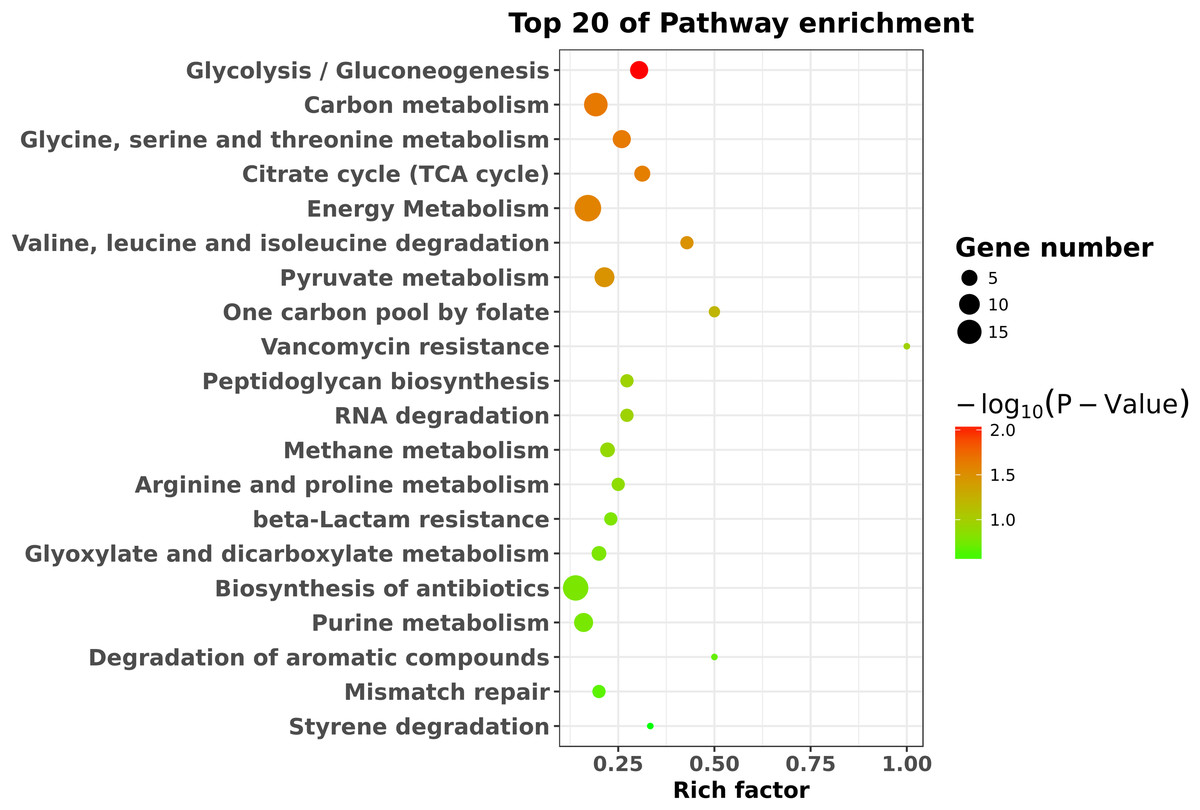
Figure 4: KEGG pathway enrichment analysis of the differentially expressed genes.
The top 20 enriched pathways are shown as circles of different sizes and different colors.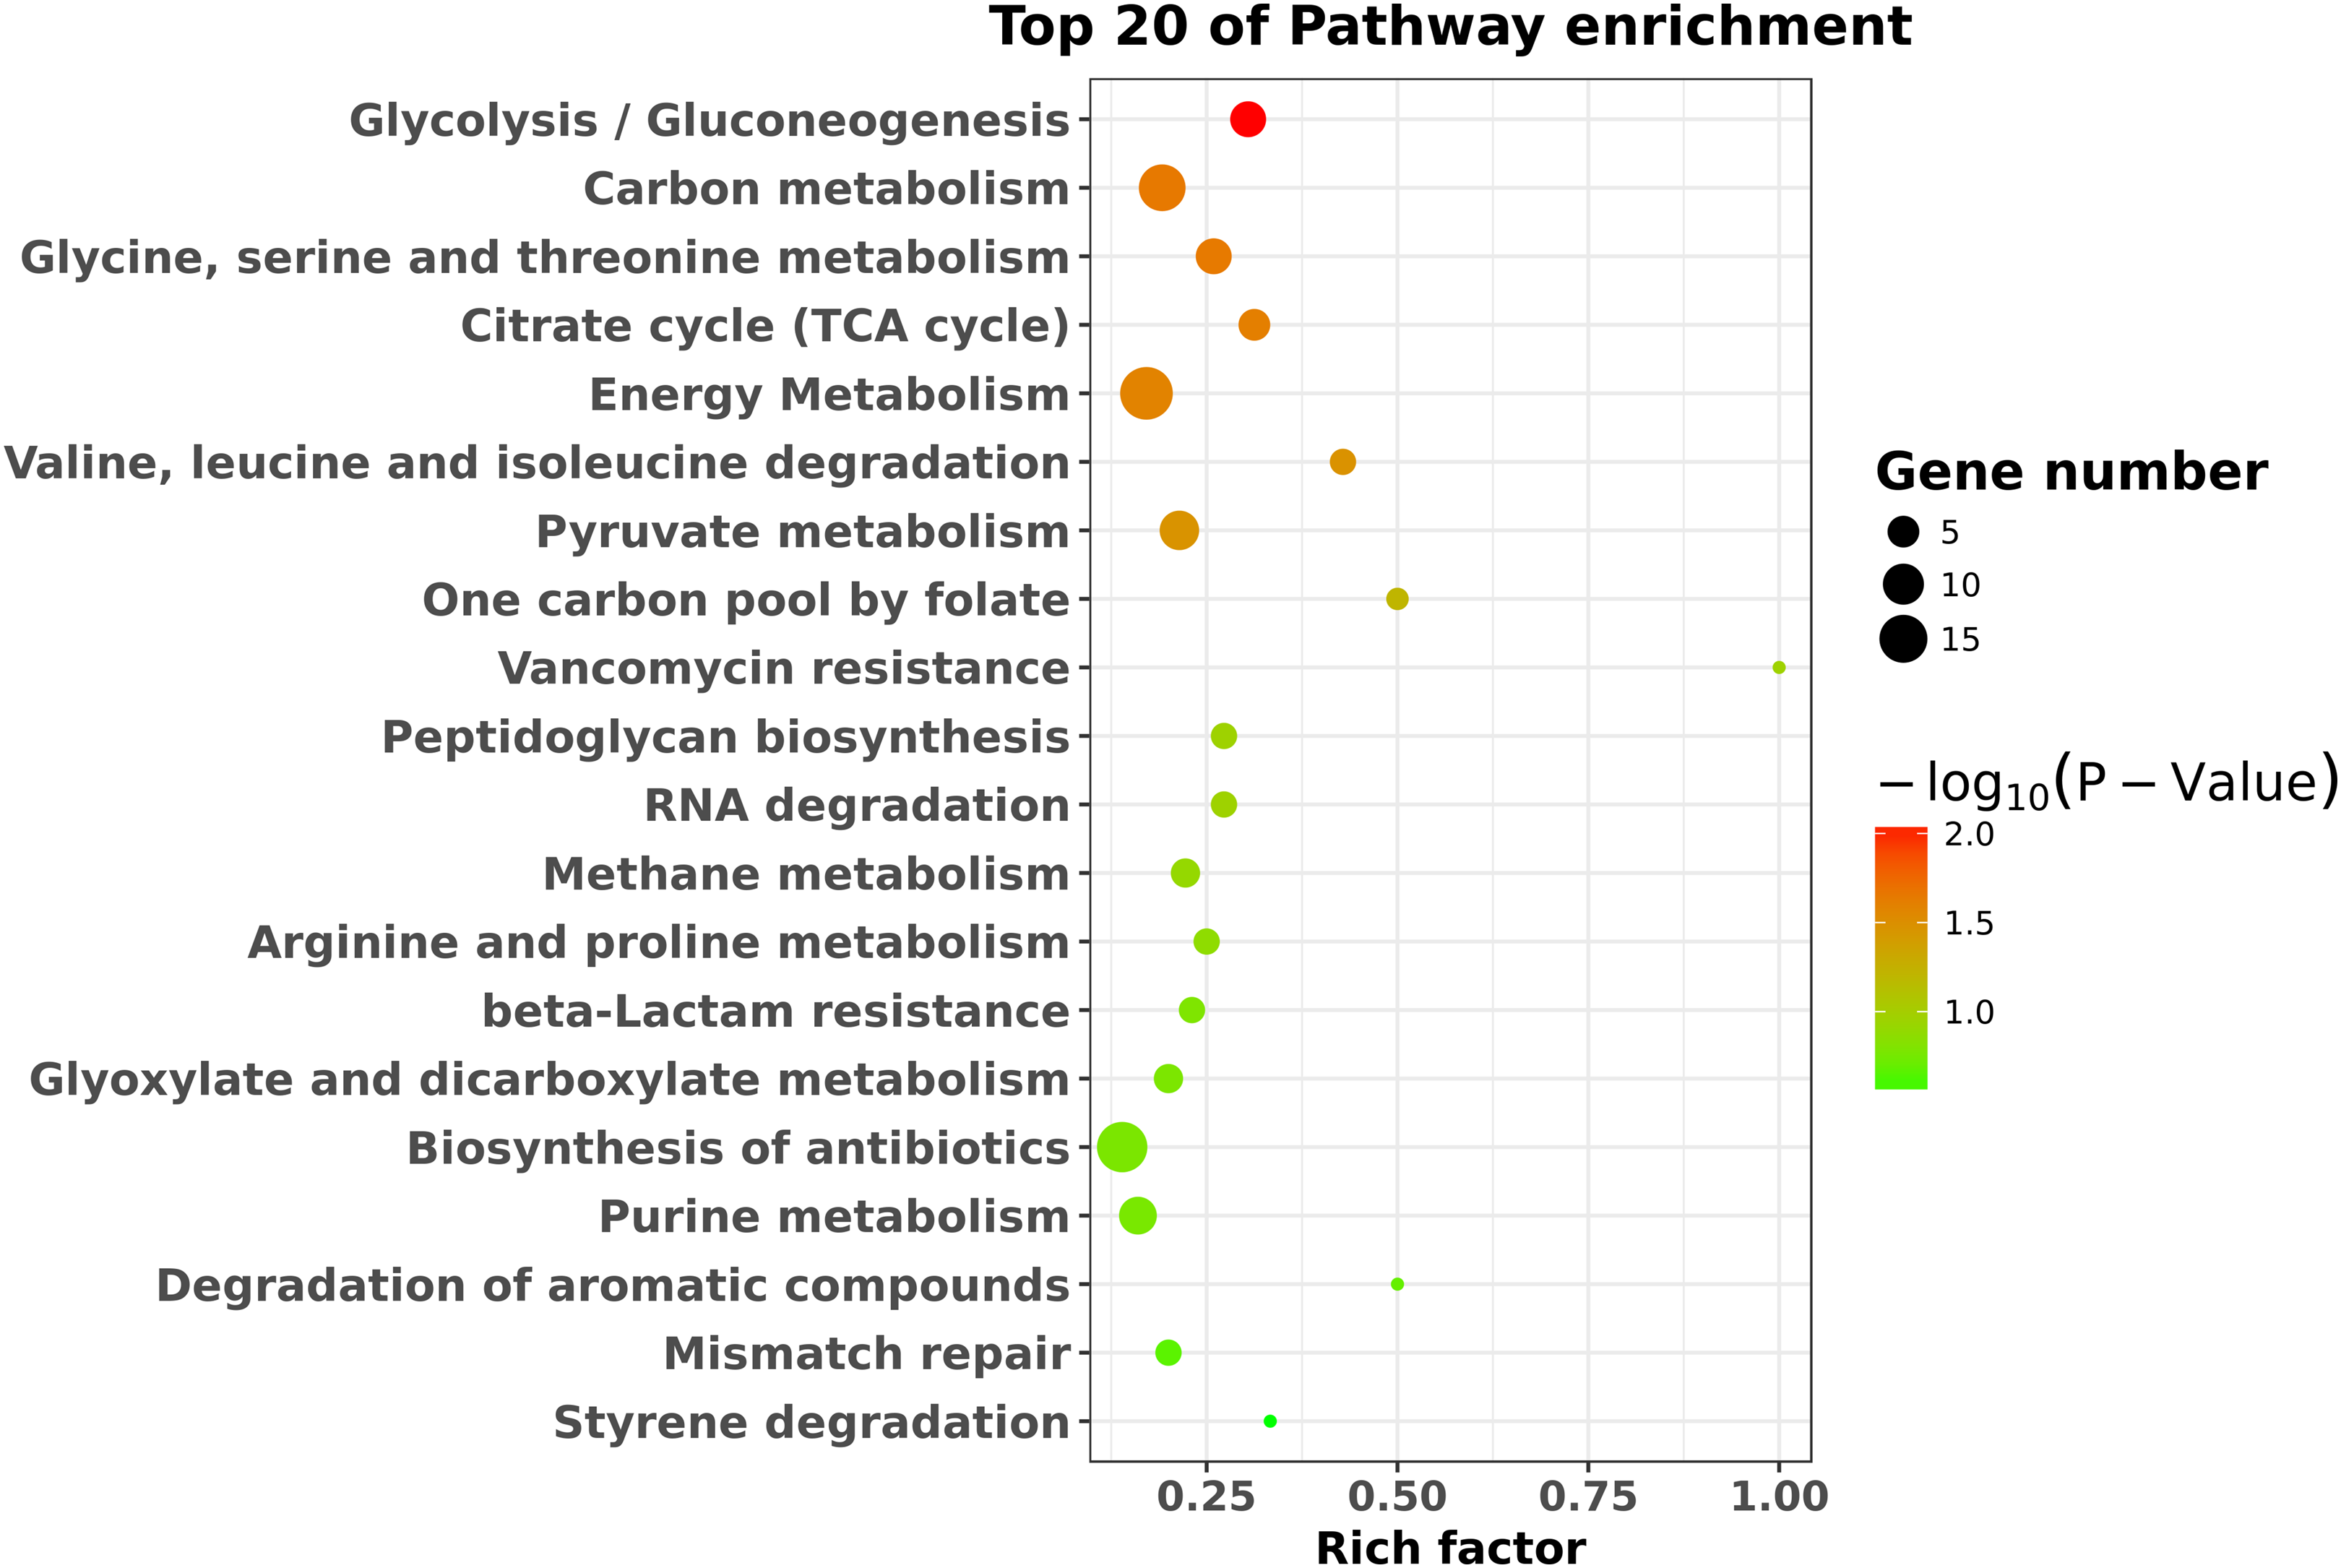
| Pathway ID | Pathway term | Pathway gene | P-value |
|---|---|---|---|
| PATH:00010 | Glycolysis/Gluconeogenesis | VC1819, VC2000, VC2738,VC2013, VCA0843, VC0485, VC2638 | 0.0089266 |
| PATH:01200 | Carbon metabolism | VC2504, VC2000, VC1942, VC2738, VC1304, VC2090, VCA0843, VCA0666, VC0485, VC0432, VC2638, VCA0278, VC2646, VC0027 | 0.0221534 |
| PATH:00260 | Glycine, serine and threonine metabolism | VC2504, VC2036, VCA0875, VCA0666, VC2638, VCA0278, VC0027 | 0.0222798 |
| PATH:00020 | Citrate cycle (TCA cycle) | VC2738, VC1304, VC2090, VC0432, VC2638 | 0.0240401 |
| PATH:01120 | Energy metabolism | VC2504, VC1819, VC2000, VC2036, VC1942, VC2738, VC0715, VC0384, VC1304, VC2090, VCA0843, VCA0549, VC1347, VC0485, VC0432, VC2638, VCA0278, VC2646, VC2669 | 0.0257444 |
| PATH:00280 | Valine, leucine and isoleucine degradation | VCA0007, VC2638, VCA0829 | 0.0328662 |
| PATH:00620 | Pyruvate metabolism | VC1819, VC2738, VC0794, VC1304, VC0485, VC0432, VC2638, VCA0192, VC2646 | 0.0334527 |
Gene-Act network analysis
To further explore the relationships among these differentially expressed genes, a Gene-Act network was constructed based on the genes and genetic relationships, including activation, binding, expression, inhibition and compounds. According to the Gene-Act network shown in Fig. 5, important network modules, including VC2738 (phosphoenolpyruvate carboxykinase), VC2646 (phosphoenolpyruvate carboxylase), VC0485 (pyruvate kinase), VC0432 (malate dehydrogenase), VC1304 (fumarate hydratase, class I), VC2090 (the succinate dehydrogenase hydrophobic membrane anchor protein), VC0794 (hypothetical protein) and VCA0192 (D-lactate dehydrogenase), were involved in multiple cellular metabolic pathways, as mentioned in Table 1 above. We also found that VCA0278 (serine hydroxymethyltransferase), VCA0666 (L-serine dehydratase 1), VCA0875 (D-serine dehydratase), VC0027 (threonine dehydratase) and VC2638 (dihydrolipoamide dehydrogenase) were involved in glycine, serine and threonine metabolism. Interestingly, the interaction of two important genes, namely, VCA0737 (the luxP protein) and VCA0736 (the sensor histidine kinase LuxQ), in the quorum sensing system and the interaction of two important genes, namely, VC2614 (the cAMP-regulatory protein) and VC0534 (the RNA polymerase sigma-38 factor, rpoS), in the cAMP-CRP-RpoS signaling pathway, were also observed in the gene interaction network. In addition, four genes, namely, VCA0008 (amethyl-accepting chemotaxis protein), VC2201 (the chemotaxis protein CheR), VC1643 (amethyl-accepting chemotaxis protein) and VC2062 (achemotaxis-specific methylesterase), contribute to the bacterial chemotaxis pathway and were also affected by the degS mutant.
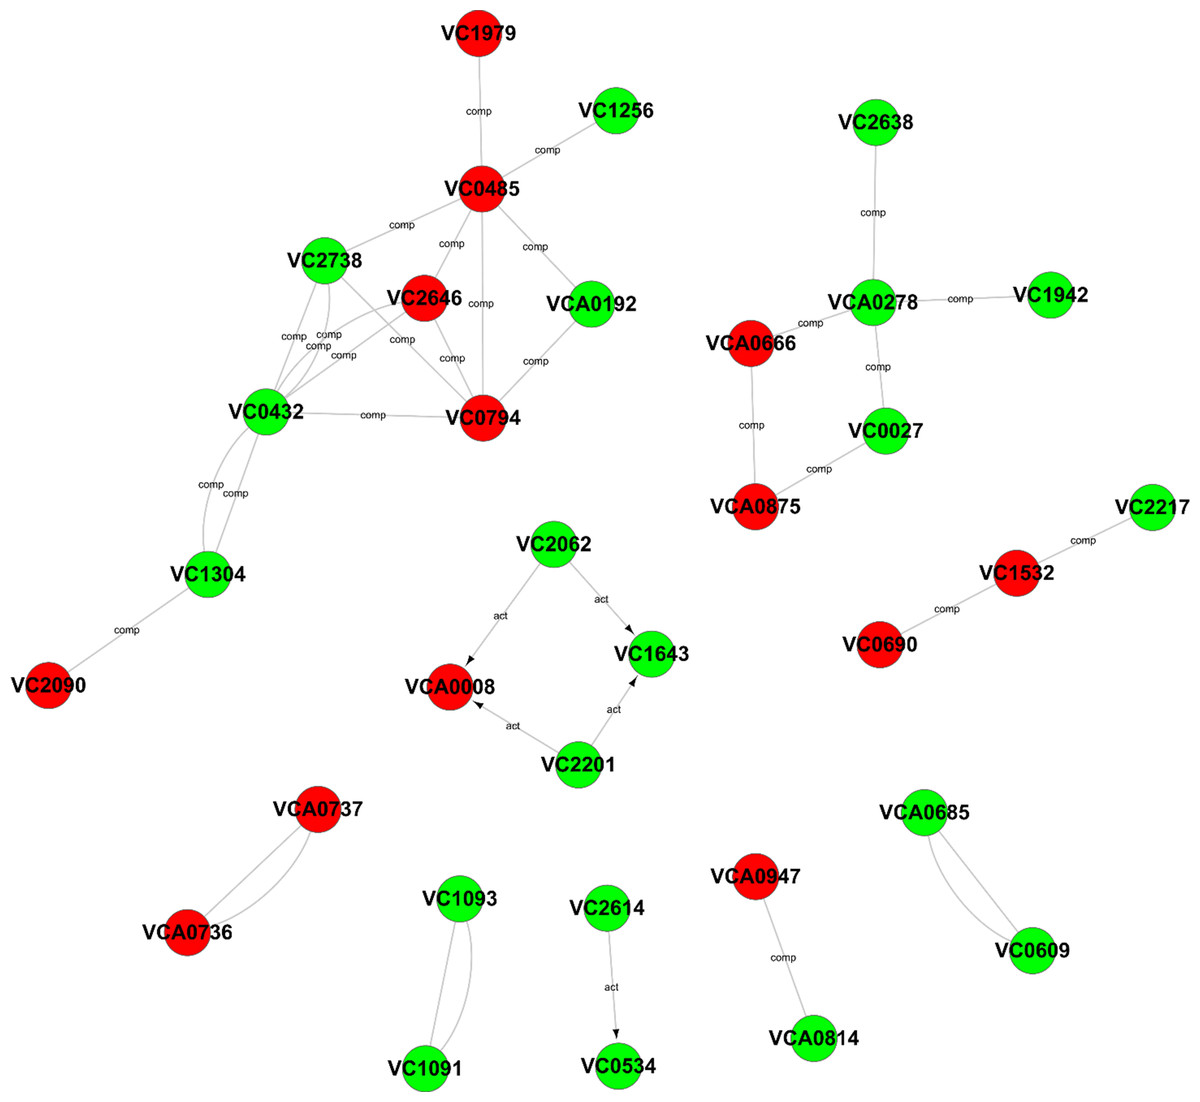
Figure 5: Gene-Act network of differentially expressed genes.
The red circle nodes indicate the upregulated genes, and the green circle nodes indicate the downregulated genes. The lines indicate interactions between genes.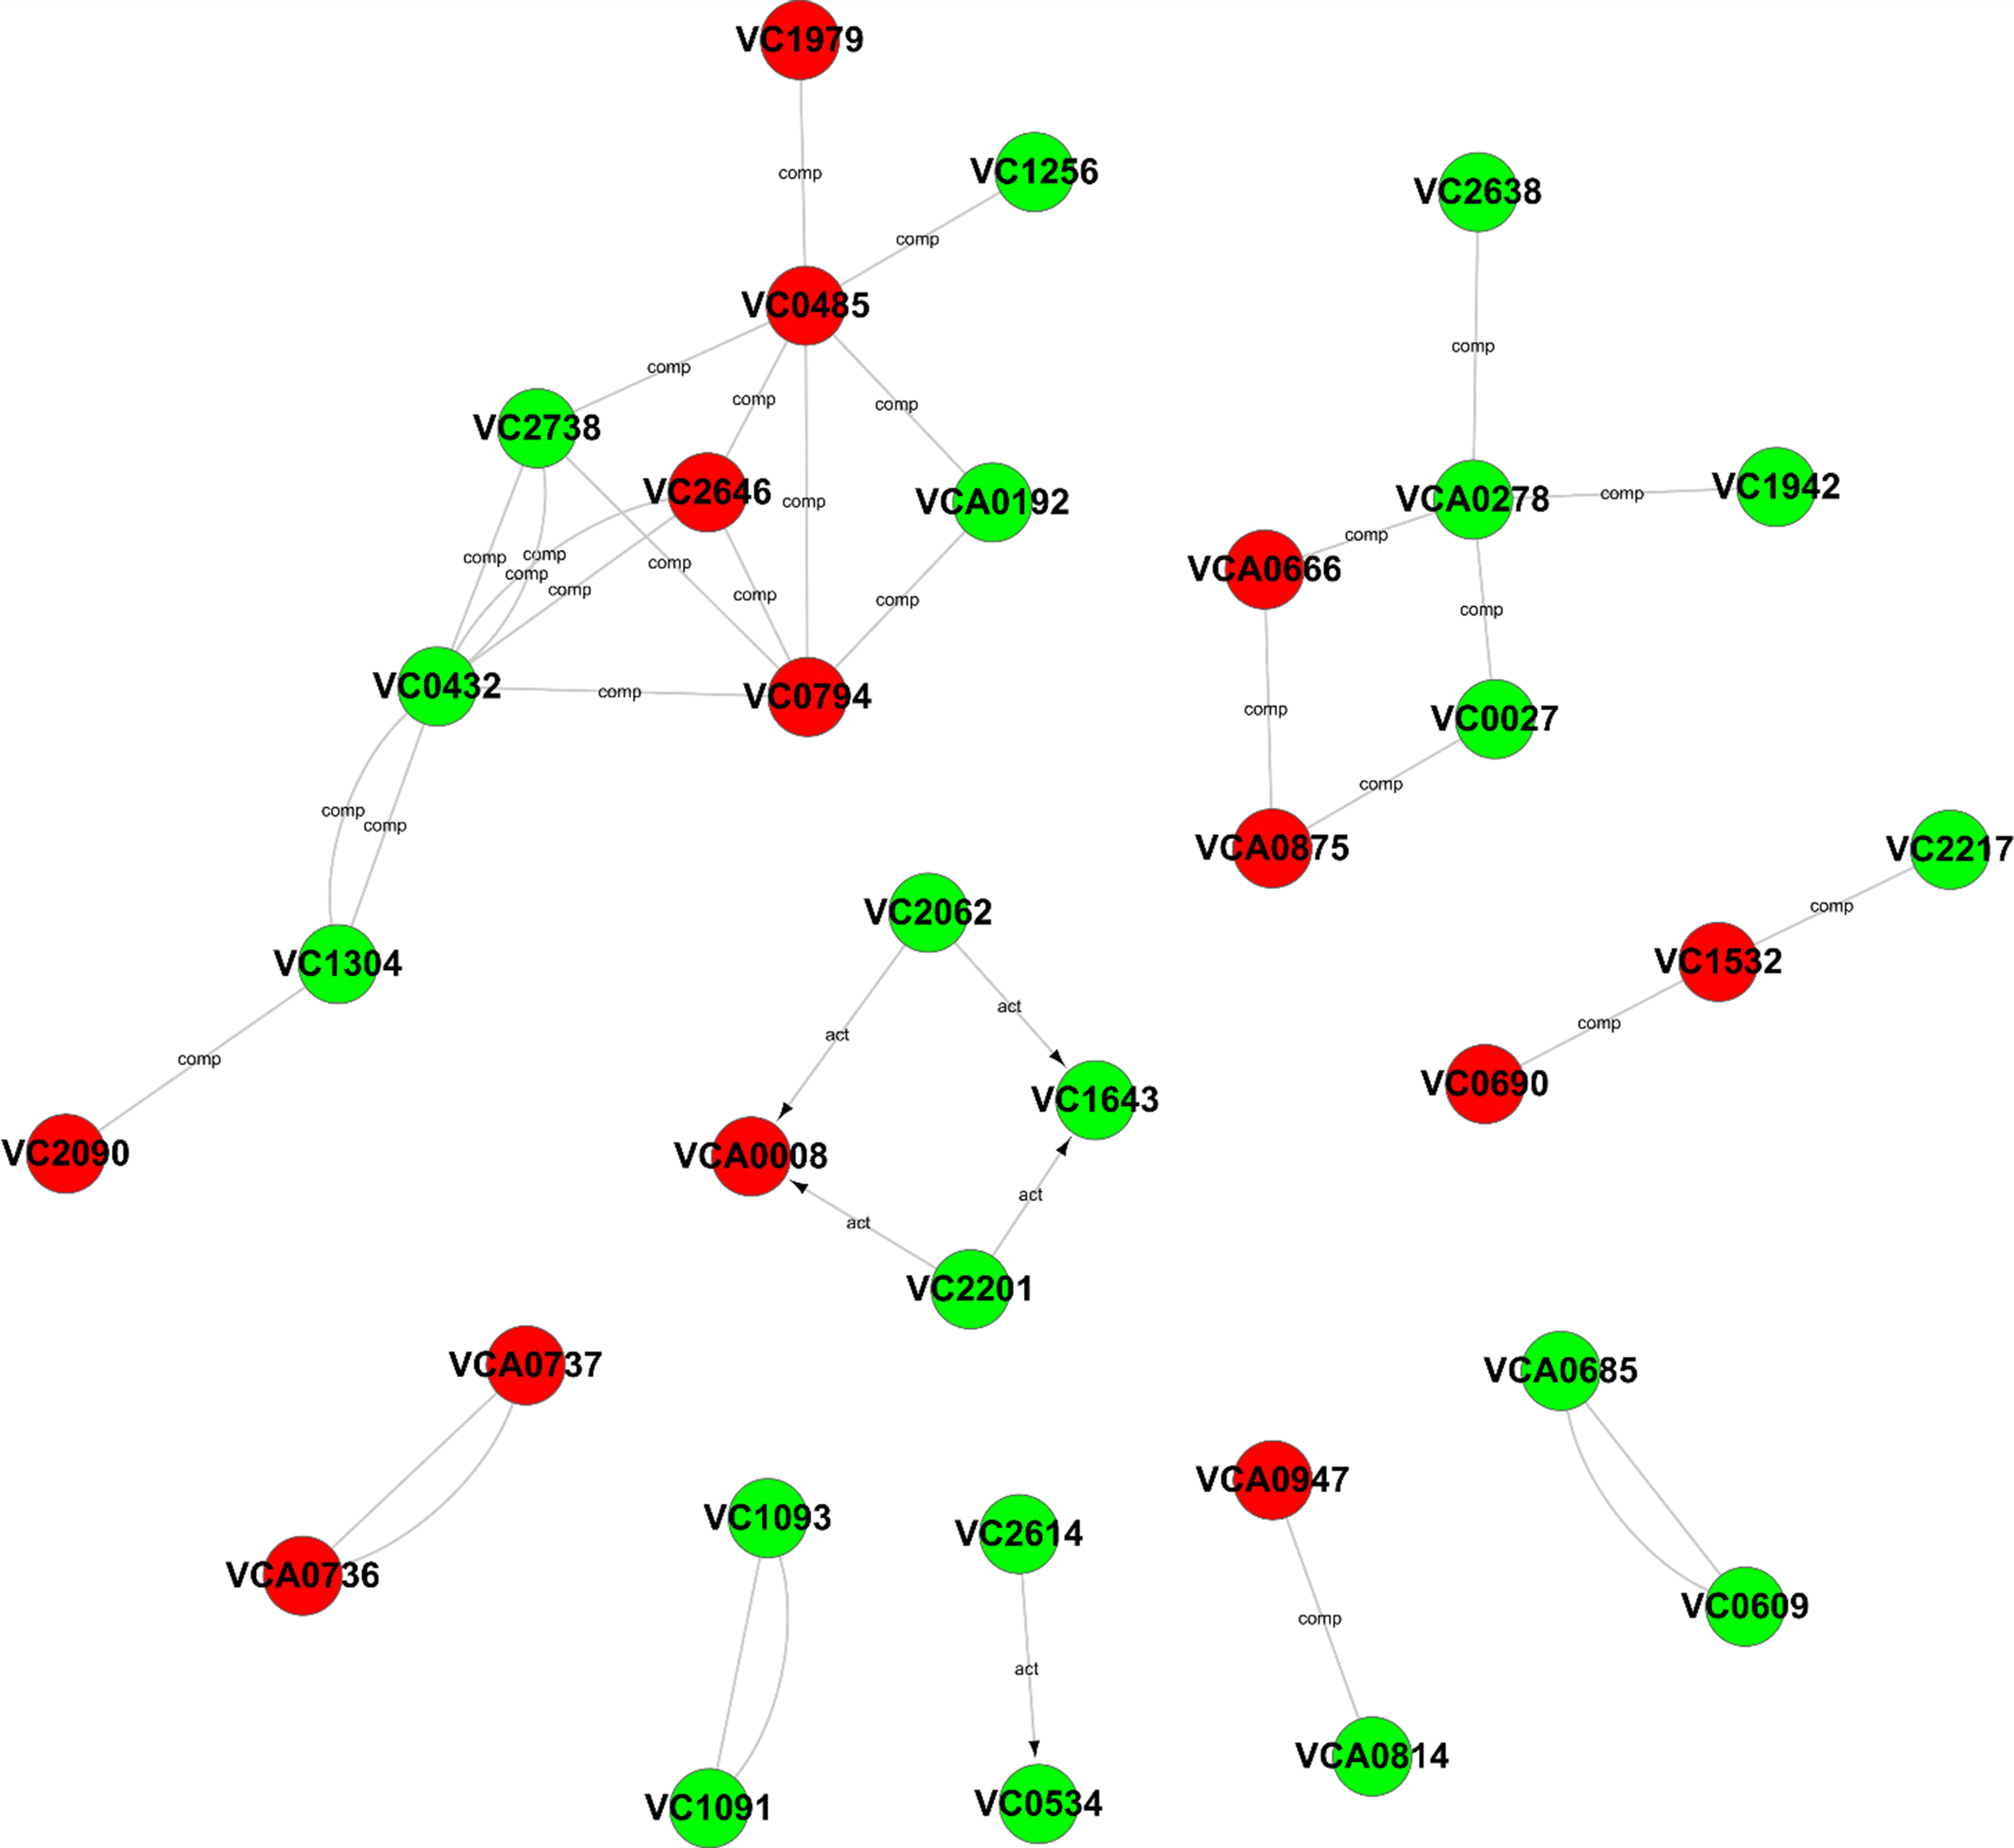
Validation of the RNA-Seq data
To validate the reliability and accuracy of the RNA-Seq analysis, nine differentially expressed genes were randomly selected for validation by qRT-PCR. As shown in Fig. 6, compared with the V. cholerae wild-type strain, the differentially expressed genes VCA0875, VC2036, VC2646, VC0485, VCA0008 and VC0736 were significantly upregulated, while VC2738, VC0534 and VCA0843 were significantly downregulated, in the degS mutant strain. These results were consistent with those of the RNA-Seq analysis, indicating the reliability and accuracy of the RNA-Seq data.

Figure 6: Validation of the differentially expressed genes using quantitative real-time PCR.
The relative expression values of genes are presented as the means with SD. *P < 0.05, **P < 0.01 and ***P < 0.001, with comparisons between groups.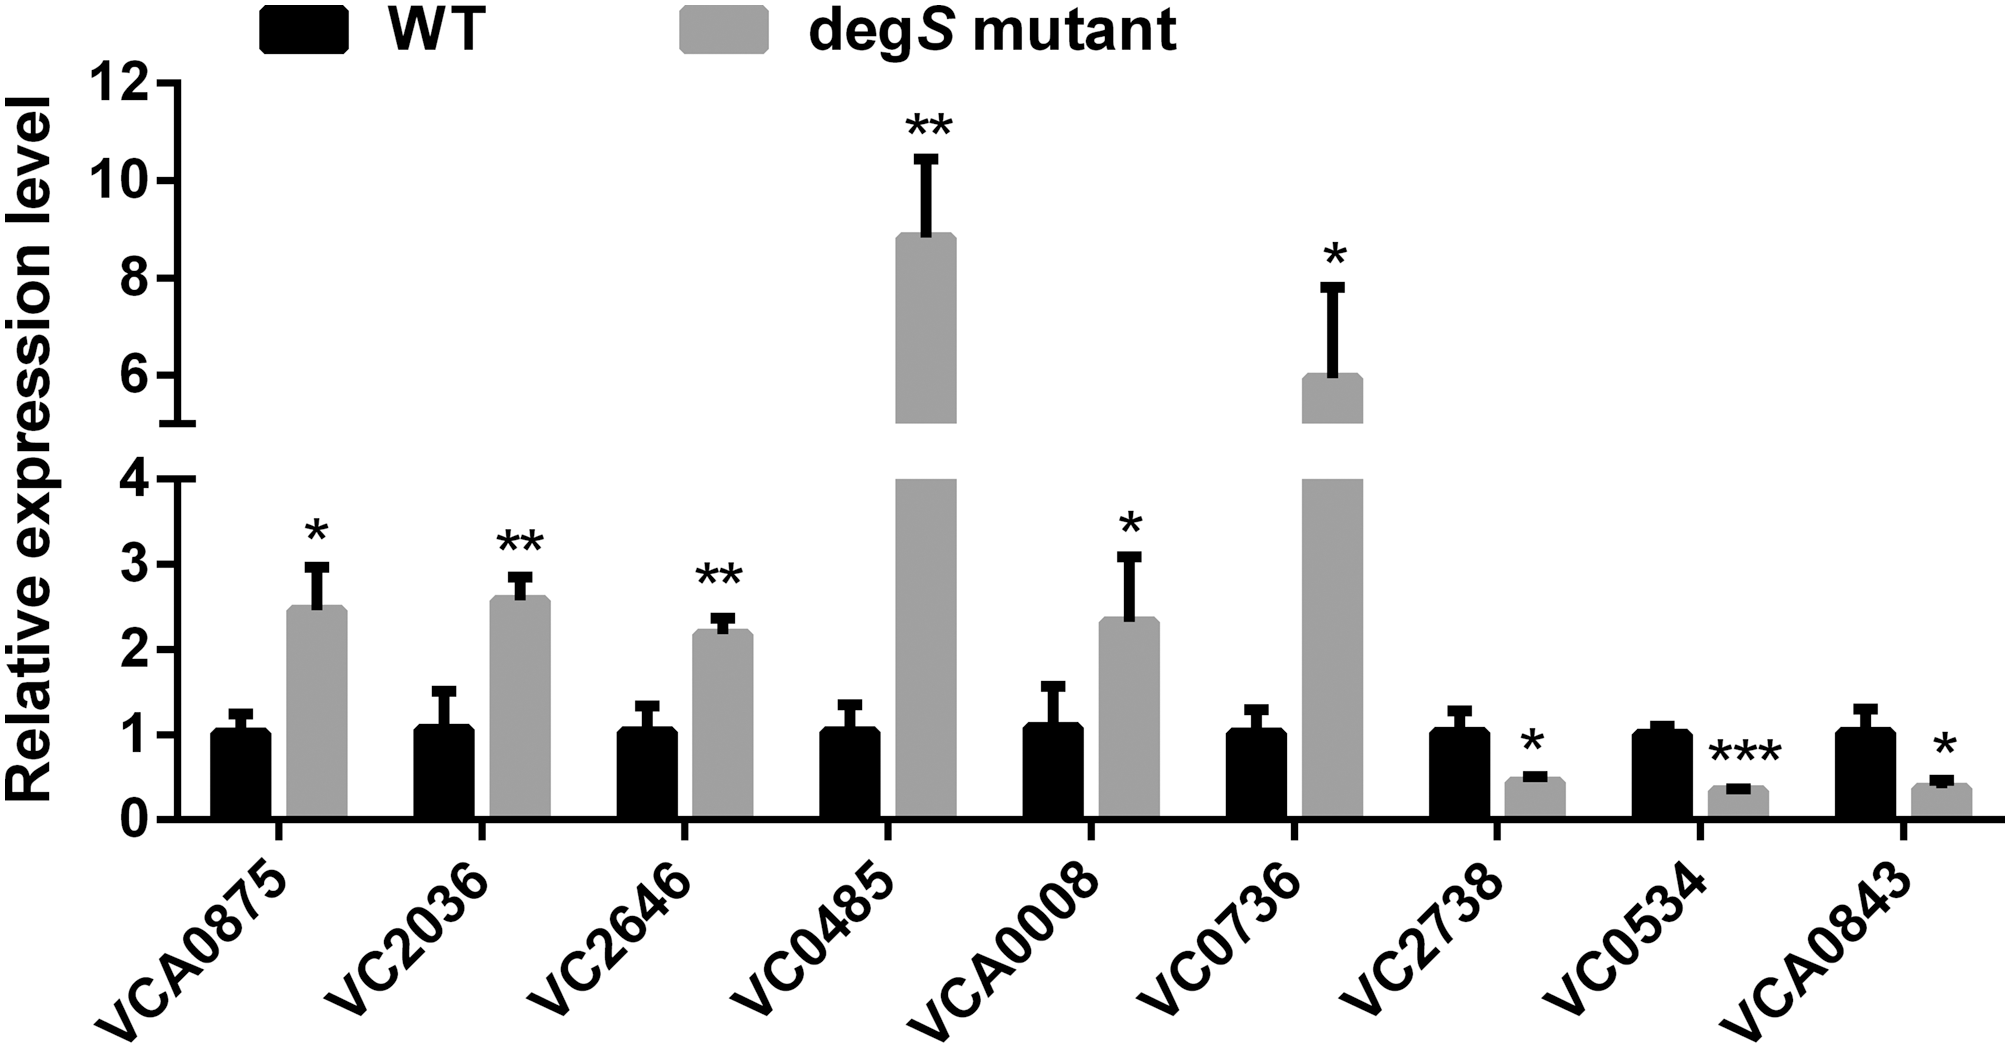
The small colony degS mutant phenotype is rescued by supplementing the expression of degS and rpoS gene
To further test the role of degS in the small colony phenotype, we constructed pBAD24-degS plasmid to complement degS gene in degS mutant strains. The small colony phenotype could be restored in degS mutants by complementation with the pBAD24-degS plasmid (Figs. 7A–7F). According to the above Gene-Act network, the cAMP-CRP-RpoS signaling pathway was significantly inhibited in the degS deletion mutant. We further confirmed that the expression of rpoS was inhibited in degS mutants and restored in degS mutants by complementation with the pBAD24-degS plasmid (Fig. 7G). RpoS has been reported to aid bacterial growth and survive in stationary phase (McCann, Kidwell & Matin, 1991; Shah et al., 2019). Therefore, to test whether rpoS is involved in the small colony degS mutant phenotype, we constructed pBAD24-rpoS plasmid to supplement the expression of ropS gene in degS mutant strains. The results showed that the small colony phenotype could be partially restored by supplement the expression of ropS gene.
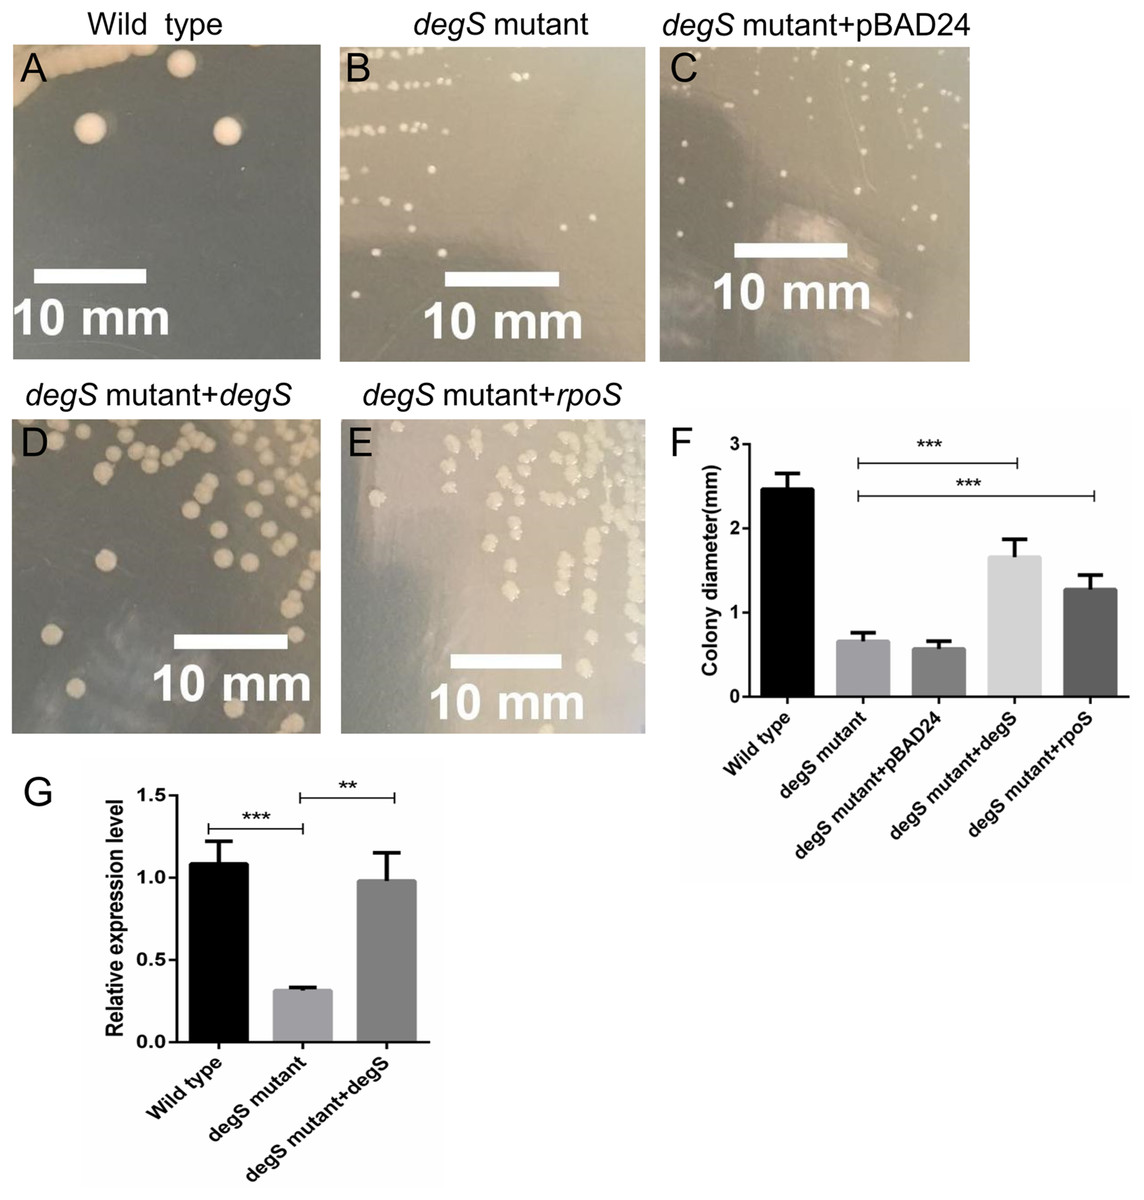
Figure 7: Compensation for degS and rpoS expression in degS deletion mutant could restore the colony size.
(A–E) The cell morphology and (F) average colony diameter of the wild-type, degS mutant and degS mutant complemented with the plasmids pBAD24, pBAD24-degS and pBAD24-rpoS, respectively. Error bars represent the SD of the mean of 10 colonies. ***P < 0.001. (G) The mRNA expression levels of rpoS were analyzed in wild-type, degS mutant and degS mutant complemented with the pBAD24-degS plasmids. The relative expression values of genes are presented as the means with SD. **P < 0.01 and ***P < 0.001.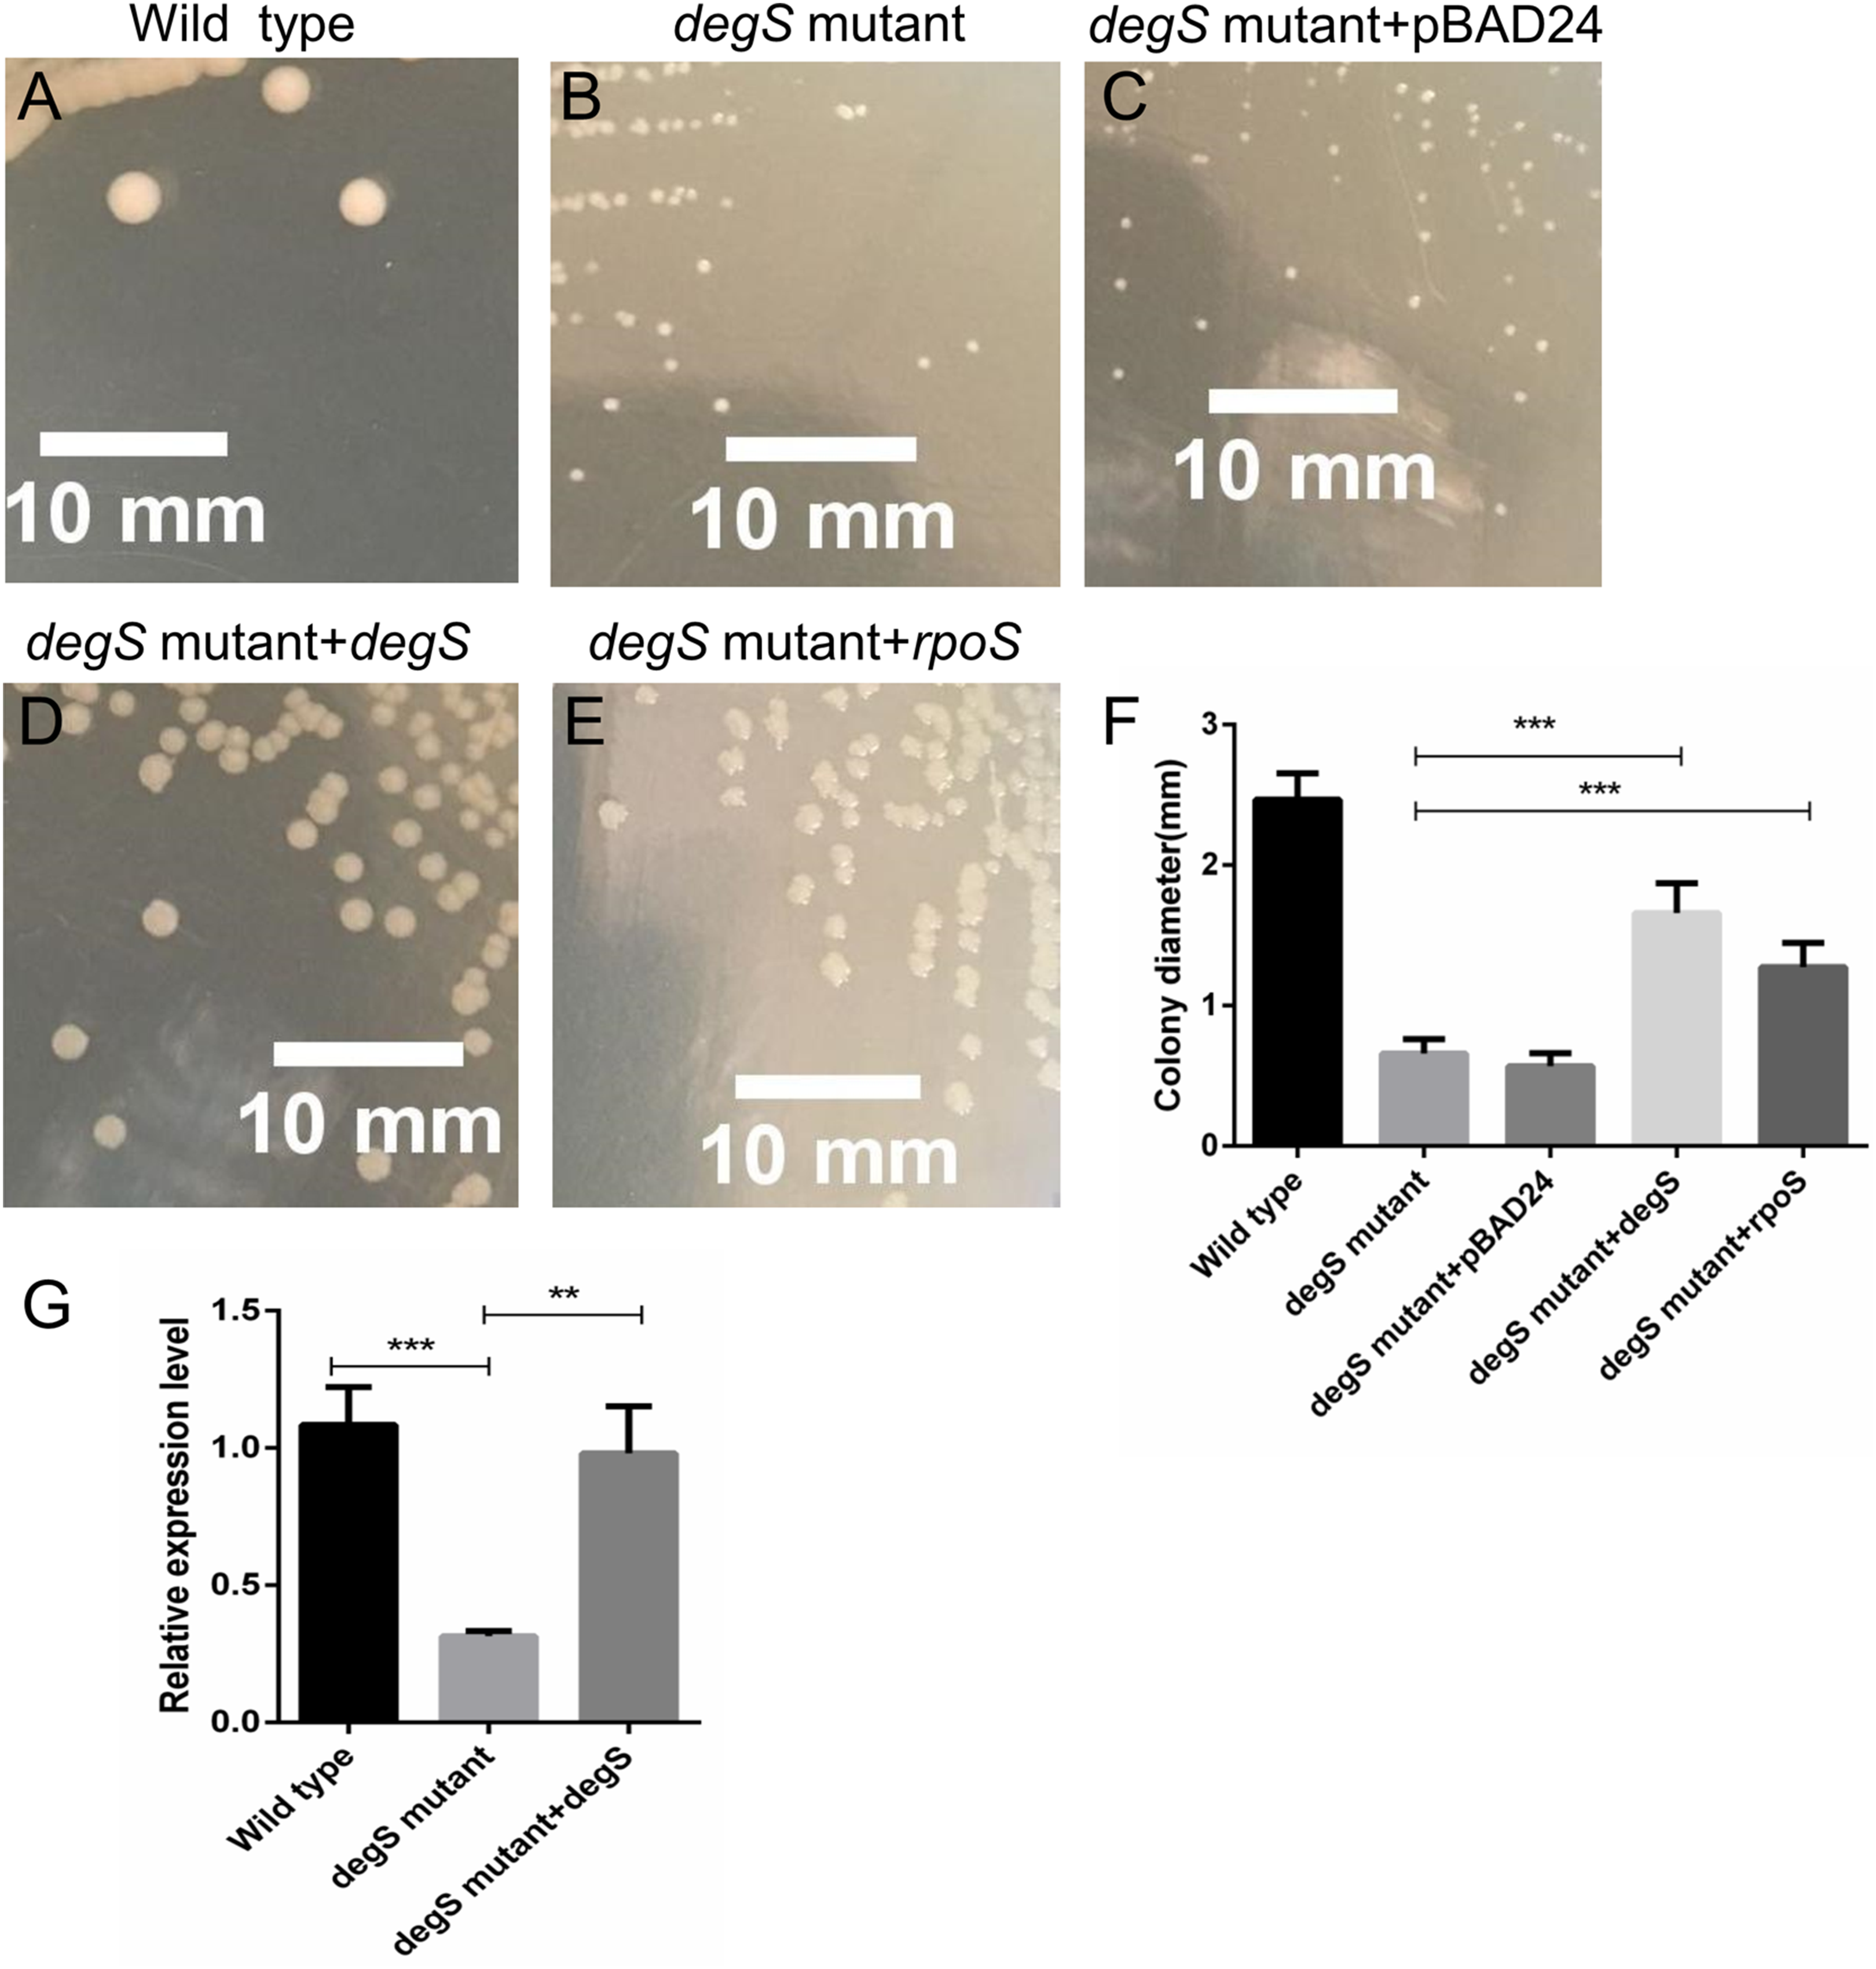
Discussion
DegS is a serine protease located in the periplasm of bacteria, and is an important component of the bacterial response to external pressure (Kim, 2015). The degS is now seen as an essential gene whose indispensable function is to provide active σE activity (Alba et al., 2001; Pennetzdorfer et al., 2019). However, the biological function and global regulatory network of DegS in V. cholerae remain limited. In this study, we report that degS deletion could significantly delay the normal growth of V. cholerae in the liquid medium and showed a small colony phenotype on agar plates. The small colony phenotype of degS mutant could be reversed by complementation with the pBAD24-degS plasmid encoding the full-length DegS protein. The consistent results were reported that degS required for growth in three E. coli strains (Alba et al., 2001). Interestingly, previous studies have found that an E. coli degS knockout strain also showed smaller colonies on LB plates than the wild-type strain, but the molecular mechanism is not clear (Waller & Sauer, 1996). To investigate the global regulatory role of degS in V. cholerae, we further performed a genome-wide analysis of mRNAs from the V. cholerae HN375 wild-type and degS mutant strains. To our knowledge, this is the first genome-wide analysis of mRNAs performed to screen for differentially expressed genes induced by the degS deletion in V. cholerae. Therefore, we believe that these data will serve as a useful resource for further research on the overall regulatory role of degS.
The RNA-Seq data presented here show that 423 differentially expressed genes were identified. Among the downregulated enriched GO terms, we found that the murB gene was associated with the GO terms of cell cycle and cell division. The murB gene encodes the UDP-N-acetylenolpyruvoylglucosamine reductase, which catalyzes a critical process in the peptidoglycan biosynthetic pathway (Kedar et al., 2007). In Bacillus subtilis, normal expression of the murB gene plays an important role in the maintenance of normal bacterial growth and morphology (Real & Henriques, 2006). In addition, according to the GO analysis, the downregulated genes VC0263 (galactosyl-transferase), VC2217 (beta-N-acetylhexosaminidase) and VC1956 (lytic murein transglycosylase) were involved in the polysaccharide biosynthetic process, peptidoglycan turnover and peptidoglycan-based cell wall biogenesis, respectively. The synthesis of peptidoglycans is closely associated with bacterial cell division and growth. In this study, deletion of degS inhibited the growth of V. cholerae, possibly via repression of peptidoglycan synthesis.
In this study, we demonstrated for the first time that degS is closely associated with cellular metabolism in the model bacterium V. cholerae. According to GO and KEGG pathway analyses, we showed that deletion of degS mainly repressed glycolysis/gluconeogenesis, the citrate cycle (TCA cycle), carbon metabolism and pyruvate metabolism. Cellular metabolism is a well-known key player in the nutrient regulation of bacterial division and the cell cycle. The growth of bacteria in the natural environment is strongly influenced by changes in nutrient availability (Schaechter, MaalØe & Kjeldgaard, 1958; Woldringh et al., 1980). Many metabolites and metabolic enzymes have been found to play a direct regulatory role in the critical processes of bacterial growth and division (Weart et al., 2007). Pyruvate, as the final metabolite of glycolysis, plays an important role in the coordination of bacterial growth and division (Monahan et al., 2014). Several enzymes implicated in central carbon metabolism, such as the E1α subunit of pyruvate dehydrogenase, phosphoglyceromutase and enolase, are involved in coordination of the cell cycle and cell growth (Hill et al., 2013; Vadia & Levin, 2015; Sperber & Herman, 2017). Our findings indicate that degS may affect bacterial growth by regulating bacterial metabolism.
In addition, according to the Gene-Act network analysis, the cAMP-CRP-RpoS signaling pathway was significantly inhibited in the degS deletion mutant. cAMP-CRP and the alternative sigma factor RpoS are two global transcriptional regulatorsin bacteria. The cAMP-CRP complex can bind to the promoter region of rpoS and further stimulate the transcription of this gene (Cheng & Sun, 2009). RpoS is an alternative sigma factor (σS) of RNA polymerase that plays a role in the general stress response and modulation of the stationary phase (Weber et al., 2005; Pennetzdorfer et al., 2019). In V. cholerae, rpoS mutants are highly sensitive to hydrogen peroxide and are involved in colonization during the infection process and in the dissolution of biofilms (Merrell et al., 2000; Müller et al., 2007). It was shown that RpoS is necessary for upregulation of the chemotaxis and motility genes of V. cholerae within the rabbit intestine (Nielsen et al., 2006; Wurm et al., 2017). In our transcriptomic data, some flagellum- and chemotaxis-related genes that regulated by RpoS (Table S2; Fig. 5), such as flhF (flagellar biosynthesis regulator FlhF), VC2141 (flagellar protein FlaG), VC2201 (chemotaxis protein CheR), VC1643 (amethyl-accepting chemotaxis protein) (Nielsen et al., 2006), were significantly inhibited in the degS deletion mutant. Previous studies have found that an E. coli rpoS mutant was less able to survive in stationary phase (McCann, Kidwell & Matin, 1991). Additionally, rpoS may aid the growth of Salmonella Newport strain in amended soil extract (Shah et al., 2019). In this study, we observed that the small colony degS mutant phenotype could be partially restored in degS mutant with pBAD24-rpoS plasmid. These data suggest that the cAMP-CRP-RpoS signaling pathway may be involved in the small colony degS mutant phenotype. Furthermore, the qRT-PCR results showed that the expression of rpoS gene was positively correlated with the expression of degS, suggesting that degS may be associated with the cAMP-CRP-RpoS signaling pathway, and the specific mechanism needs further investigation. In addition, the LuxPQ signal transduction system is a quorum sensing system restricted to Vibrionales (Brackman et al., 2009). The LuxPQ signal system was significantly activated after degS deletion, suggesting that LuxP and LuxQ may be degS-repressed genes.
Conclusions
This study shows that DegS is important for normal growth of V. cholerae. When degS was deleted, V. cholerae exhibited smaller colonies on various media and slower growth than the wild-type strain. RNA-Seq analysis results revealed that some of the differentially expressed genes were involved in various cellular metabolic processes and the cell cycle, which may be associated with bacterial growth. In addition, several new degS-related regulatory networks have been identified. The cAMP-CRP-RpoS signaling pathway may be involved in the small colony degS mutant phenotype. Together, the current results not only provide important information for future research but also extend our understanding of the regulatory network of degS.