
Identification and expression profiles of the YABBY transcription factors in wheat
- Published
- Accepted
- Received
- Academic Editor
- Vladimir Uversky
- Subject Areas
- Agricultural Science, Bioinformatics, Molecular Biology, Plant Science
- Keywords
- YABBY, Wheat, Genome-wide, Salt, Expression patterns
- Copyright
- © 2022 Hao et al.
- Licence
- This is an open access article distributed under the terms of the Creative Commons Attribution License, which permits unrestricted use, distribution, reproduction and adaptation in any medium and for any purpose provided that it is properly attributed. For attribution, the original author(s), title, publication source (PeerJ) and either DOI or URL of the article must be cited.
- Cite this article
- 2022. Identification and expression profiles of the YABBY transcription factors in wheat. PeerJ 10:e12855 https://doi.org/10.7717/peerj.12855
Abstract
Background
YABBY is a plant-specific transcription factor (TF) that belongs to the zinc finger protein superfamily and is composed of a C2–C2 domain at the N-terminus and a YABBY domain at the C-terminus. It plays a role in plant development and growth.
Methods
In this study, 20 YABBY TFs were identified in the wheat genome. Phylogenetic relationships, collinearity relationships, gene structures, conserved motifs, and expression patterns were analyzed.
Results
Twenty TaYABBY TFs were distributed unevenly on 15 chromosomes. Collinearity analysis showed that these genes have a close relationship with monocot plants. The phylogenetic tree of wheat YABBYs classified these TaYABBYs into FIL, YAB2, INO, and CRC clades. Gene structure and conserved motif analyses showed that they share similar components in the same clades. Expression profile analysis showed that many TaYABBY genes have high expression levels in leaf tissues and are regulated by abiotic stresses, especially salt stress. Our results provide a basis for further functional characterization of the YABBY gene family.
Introduction
YABBY is a plant-specific transcription factor (TF) that is characterized by a zinc finger-like domain (C2–C2) in the N-terminus and a helix-loop-helix domain at the C-terminus region (Eckardt, 2010). There are six YABBY members in Arabidopsis are : FILAMENTOUS FLOWER (FIL), YABBY3 (YAB3), CRABS CLAW (CRC), INNER NO OUTER (INO), YABBY2 (YAB2), and YABBY5 (YAB5) (Sarojam et al., 2010; Siegfried et al., 1999). CRC and INO are considered as “reproductive-specific genes”; while YAB2, YAB3, YAB5, and FIL are “vegetative genes”, they function redundantly to promote the development of a lateral organ (Sarojam et al., 2010).
Studies have found that YABBY genes function in plant development and growth. The FIL member OsYABBY4 is predominantly expressed in the vascular tissues of rice and regulates vascular development (Yang, Ma & Li, 2016), while rice YAB2 member OsYABBY1, maize FIL/YAB3 members ZYB9 and ZYB14, and Arabidopsis YAB2, YAB3, and YAB5 have redundant functions that promote lateral organ development (Juarez, Twigg & Timmermans, 2004; Siegfried et al., 1999). CRC is essential for establishing polarity in the development of carpels and nectaries (Villanueva et al., 1999), ZmYABBY1 and ZmYABBY11 regulate male floret development (Strable & Vollbrecht, 2019), and rice DROOPING LEAF regulates the development of rice floral carpels and the formation of the leaf midrib (Ohmori et al., 2011; Yamaguchi et al., 2004). Rice and maize CRC members also have a conserved function in leaf development, affecting leaf width and length, leaf angle, and internode diameter (Nagasawa et al., 2003; Ohmori et al., 2011; Strable et al., 2017). INO promotes the development of the ovule exoderm into the seed coat (Villanueva et al., 1999). INO member Arabidopsis INNER-NO-OUTER is involved in epicarp formation and development (Simon et al., 2017).
YABBY genes also participate in responses to phytohormone responses. For example, overexpression of rice OsYABBY1 results in a semi-dwarf phenotype by feedback regulation of gibberellin (GA) biosynthesis and metabolism (Toriba et al., 2007); OsYAB4 regulates plant development and growth by regulating the GA signalling pathway (Yang, Ma & Li, 2016). YABBY genes are also involved in abiotic stress. For example, overexpression of pineapple AcYABBY4 in Arabidopsis negatively regulates salt resistance in plants (Li & Li, 2019). Genome-wide analysis of Phaseolus vulgaris YABBY genes revealed that they are involved in salt stress (İnal et al., 2017), and soybean gene GmYABBY10 negatively regulates drought and salt tolerance in plants (Zhao et al., 2017).
To date, identification of YABBY TFs has been performed in different plant species through genome-wide analyses. A total of six YABBY TFs have been identified in Arabidopsis (Siegfried et al., 1999), 17 in soybean (Glycine max) (Zhao et al., 2017), 9 in pineapple (Ananas comosus) (Li & Li, 2019), seven in grapevine (Vitis vinifera) (Zhang et al., 2019), nine in tomato (Solanum lycopersicum) (Huang et al., 2013), 12 in Gossypium arboreum, 12 in G. raimondii, 23 in G. hirsutum (Yang et al., 2018), and 16 in moso bamboo (Phyllostachys edulis) (Ma et al., 2021). As one of the most important crops worldwide, the genome of wheat has been sequenced; however, few studies have been conducted on the wheat YABBY gene family. This study aimed to carry out a comprehensive analysis of on the phylogenetic relationship, segmental duplication, chromosome location by in silico and expression profiling of wheat YABBY genes by qRT-PCR. Our study lays a foundation for future understanding of the evolution and function of wheat YABBY genes.
Materials and Methods
The identification of YABBY TFs
The coding sequence, protein sequence, and genome sequence of wheat (IWGSC), rice, and Arabidopsis were downloaded from Ensembl Plants (http://plants.ensembl.org/index.html). To identify wheat YABBY TFs, four steps were performed. First, we compared the Arabidopsis YABBY protein sequences against the wheat genome protein sequences using BLASTP. Second, we used PF04690, a characteristic profile of YABBY TFs from the PFAM database, to run HMMsearch against the wheat protein database with the threshold E< e−5. Third, we combined the results from the two steps above and manually removed the redundancy and alternative splicing genes. Fourth, the protein sequences of YABBY were submitted to NCBI’s Conserved Domain Database (NCBI CDD) and proteins without YABBY domains were also removed to confirm whether the putative YABBY protein contained the YABBY domain. Finally, putative wheat YABBY TFs were identified.
The physicochemical properties of wheat YABBYs were predicted by using ExPASy (Wilkins et al., 1999), and the amino acid number, theoretical isoelectric point (pI), molecular weight (MW), and grand average of hydropathicity (GRAVY) were predicted using ExPASy’s ProtParam tool (Wilkins et al., 1999). The subcellular location of TaYABBYs was predicted using CELLO v.2.5 (Yu et al., 2006) and Plant-mPLoc (Chou & Shen, 2010).
Phylogenetic relationship, gene structure, and conserved motif analyses
Sequence alignments of YABBY proteins were generated using ClustalW. An unrooted neighbour-joining (NJ) phylogenetic tree was constructed using MEGA7 (Kumar, Stecher & Tamura, 2016) with 1,000 replicates based on aligning the full-length YABBY protein sequence from rice, Arabidopsis, and wheat. To further validate the accuracy of the NJ tree, an unrooted maximum likelihood (ML) tree was built using MEGA7 (Kumar, Stecher & Tamura, 2016) with 1,000 replicates. The gene structure of TaYABBY genes was constructed using the Gene Structure Display Server (GSDS 2.0) (Hu et al., 2015). The conserved motifs of TaYABBYs were predicted using MEME suite (Bailey et al., 2015) with the following parameters: maximum number = 10, motif width = 6–100 amino acids.
Chromosomal location and collinearity analysis
All wheat YABBY genes were mapped onto the wheat chromosomes according to the information obtained from the Ensembl Plants database. The MCScanX program (Wang et al., 2012) was used to predict collinearity relationships between wheat and other species. The chromosomal location and collinearity relationship were visualised by TBtools (Chen et al., 2020).
Plant materials, RNA isolation, cDNA synthesis, and quantitative RT- PCR
The wheat cultivar Chinese Spring (Triticum aestivum) was used in this study. For different tissue expression analyses, the roots, stems, leaves, and inflorescences were collected at the spike formation stage. For different abiotic stresses, 7-day-old seedlings were subjected to salt (200 mM NaCl), drought (20% polyethylene glycol [PEG] 6000), heat (42 °C), and cold (4 °C) for 2h in hydroponic culture to obtain whole plants and collected for RNA isolation. For salt stress at different time points, 7-day-old seedlings were subjected to 200 mM NaCl and collected at 0, 1, 2, 3, 5, 7, 12, and 24 h. Three replicates were performed per treatment, and each replicate included at least 15 plants. After collection, the samples were stored at −80 °C. Total RNA was isolated using the TRIzol reagent (TIANGEN Biotech, Beijing, China) and treated with RNase-free DNase I according the manufacturer’s instruction. The first-strand cDNA synthesis was performed according to the manufacturer’s instructions (TIANGEN Biotech, Beijing, China). Quantitative real-time PCR analysis was performed using Thermo Fish Q3 (Thermo Fisher, Waltham, MA, USA) and all reactions were performed in triplicate. The relative transcript level of a gene was calculated using the 2−ddct method (Livak & Schmittgen, 2001). Data were normalised to the expression of wheat GAPDH which was assessed in our previous study (Hao et al., 2021). Primers were designed using OLIGO 7 version software, and some primers for the YABBY genes were common to each set because of the highly conserved sequences in the A, B, and D subgenomes. Primers used in this study are listed in Table S1.
Results
Identification of YABBY in wheat
A total of 20 YABBY members were identified in the wheat genome. Among the 21 wheat chromosomes, 20 TaYABBY genes were unevenly distributed in 15 chromosomes according to the annotation of the wheat genome (Table 1). We designated these YABBY genes as TaYABBY1A—TaYABBY7D according to their consecutive chromosomal positions and homology relationships. All were validated using expressed sequence tags (ESTs). Among these 20 TaYABBY TFs, 18 constitute night sets, and every set contains three homoeologous genes in the A, B, and D subgenomes, respectively; two form one set with two homoeologous genes in the A and B subgenome. The deduced length of TaYABBY proteins ranged from 164 amino acids (aa) (TaYABBY2D) to 297 aa (TaYABBY1A and TaYABBY1B) with molecular weights ranging from 17.76 (TaYABBY2D) to 31.44 (TaYABBY1B) kDa. The theoretical pI ranged from 5.62 (TaYABBY2A) to 9.3 (TaYABBY6A and TaYABBY6B), and the GRAVY of each TaYABBY protein was less than zero, indicating that they are hydrophilic proteins. All the 20 YABBY genes are predicted using CELLO v.2.5 (Yu et al., 2006) and Plant-mPLoc (Chou & Shen, 2010) to be located in nuclear.
| New name | ID | Chromosome location | Subcellular location | Number of amino acids (aa) | Molecular weight (Da) | Theoretical pI | GRAVY | EST | ||
|---|---|---|---|---|---|---|---|---|---|---|
| TaYABBY1A | TraesCS1A02G176300 | 1A | 314620483 | 314624358 | Nuclear | 297 | 31,404.47 | 8.62 | −0.349 | 22 |
| TaYABBY1B | TraesCS1B02G203800 | 1B | 367839427 | 367843332 | Nuclear | 297 | 31,444.45 | 8.62 | −0.353 | 30 |
| TaYABBY1D | TraesCS1D02G162600 | 1D | 233307158 | 233311289 | Nuclear | 296 | 31,280.33 | 8.62 | −0.328 | 24 |
| TaYABBY2A | TraesCS2A02G197200 | 2A | 166829162 | 166830134 | Nuclear, Extracellular |
166 | 17,846.33 | 5.62 | −0.352 | 4 |
| TaYABBY2B | TraesCS2B02G224700 | 2B | 214534189 | 214535173 | Nuclear Extracellular |
168 | 18,102.65 | 5.64 | −0.376 | 4 |
| TaYABBY2D | TraesCS2D02G205100 | 2D | 157017464 | 157019463 | Nuclear Extracellular |
164 | 17,758.29 | 5.92 | −0.347 | 4 |
| TaYABBY3A | TraesCS2A02G386200 | 2A | 631967177 | 631969484 | Nuclear | 262 | 28,473.22 | 8.14 | −0.423 | 41 |
| TaYABBY3B | TraesCS2B02G403100 | 2B | 571531403 | 571533593 | Nuclear | 268 | 28,855.63 | 6.74 | −0.302 | 41 |
| TaYABBY3D | TraesCS2D02G382700 | 2D | 486955433 | 486957936 | Nuclear | 269 | 28,955.71 | 6.74 | −0.323 | 41 |
| TaYABBY4A | TraesCS4A02G058800 | 4A | 51137760 | 51142248 | Nuclear | 200 | 22,304.67 | 8.98 | −0.532 | 38 |
| TaYABBY4B | TraesCS4B02G245900 | 4B | 509033072 | 509037528 | Nuclear | 198 | 22,093.41 | 8.98 | −0.552 | 36 |
| TaYABBY4D | TraesCS4D02G245300 | 4D | 412713684 | 412717920 | Nuclear | 200 | 22,318.7 | 8.98 | −0.531 | 37 |
| TaYABBY5A | TraesCS5A02G025900 | 5A | 20992825 | 20998791 | Nuclear | 207 | 22,915.81 | 8.97 | −0.537 | 24 |
| TaYABBY5B | TraesCS5B02G025100 | 5B | 24008309 | 24014574 | Nuclear | 207 | 22,663.48 | 9.13 | −0.514 | 43 |
| TaYABBY5D | TraesCS5D02G033700 | 5D | 32297891 | 32303526 | Nuclear | 204 | 22,376.21 | 9.28 | −0.5 | 22 |
| TaYABBY6A | TraesCS5A02G371500 | 5A | 570321614 | 570331718 | Nuclear, Extracellular |
185 | 20,980.93 | 9.3 | −0.523 | 29 |
| TaYABBY6B | TraesCS5B02G373600 | 5B | 551331490 | 551338856 | Nuclear Extracellular |
185 | 20,980.93 | 9.3 | −0.523 | 29 |
| TaYABBY7A | TraesCS6A02G237700 | 6A | 446900609 | 446903597 | Nuclear | 250 | 26,684.33 | 8.13 | −0.196 | 29 |
| TaYABBY7B | TraesCS6B02G266200 | 6B | 478752450 | 478755692 | Nuclear | 250 | 26,652.34 | 8.13 | −0.167 | 45 |
| TaYABBY7D | TraesCS6D02G220400 | 6D | 310520716 | 310523936 | Nuclear | 250 | 26,684.33 | 8.13 | −0.196 | 45 |
Collinearity analysis
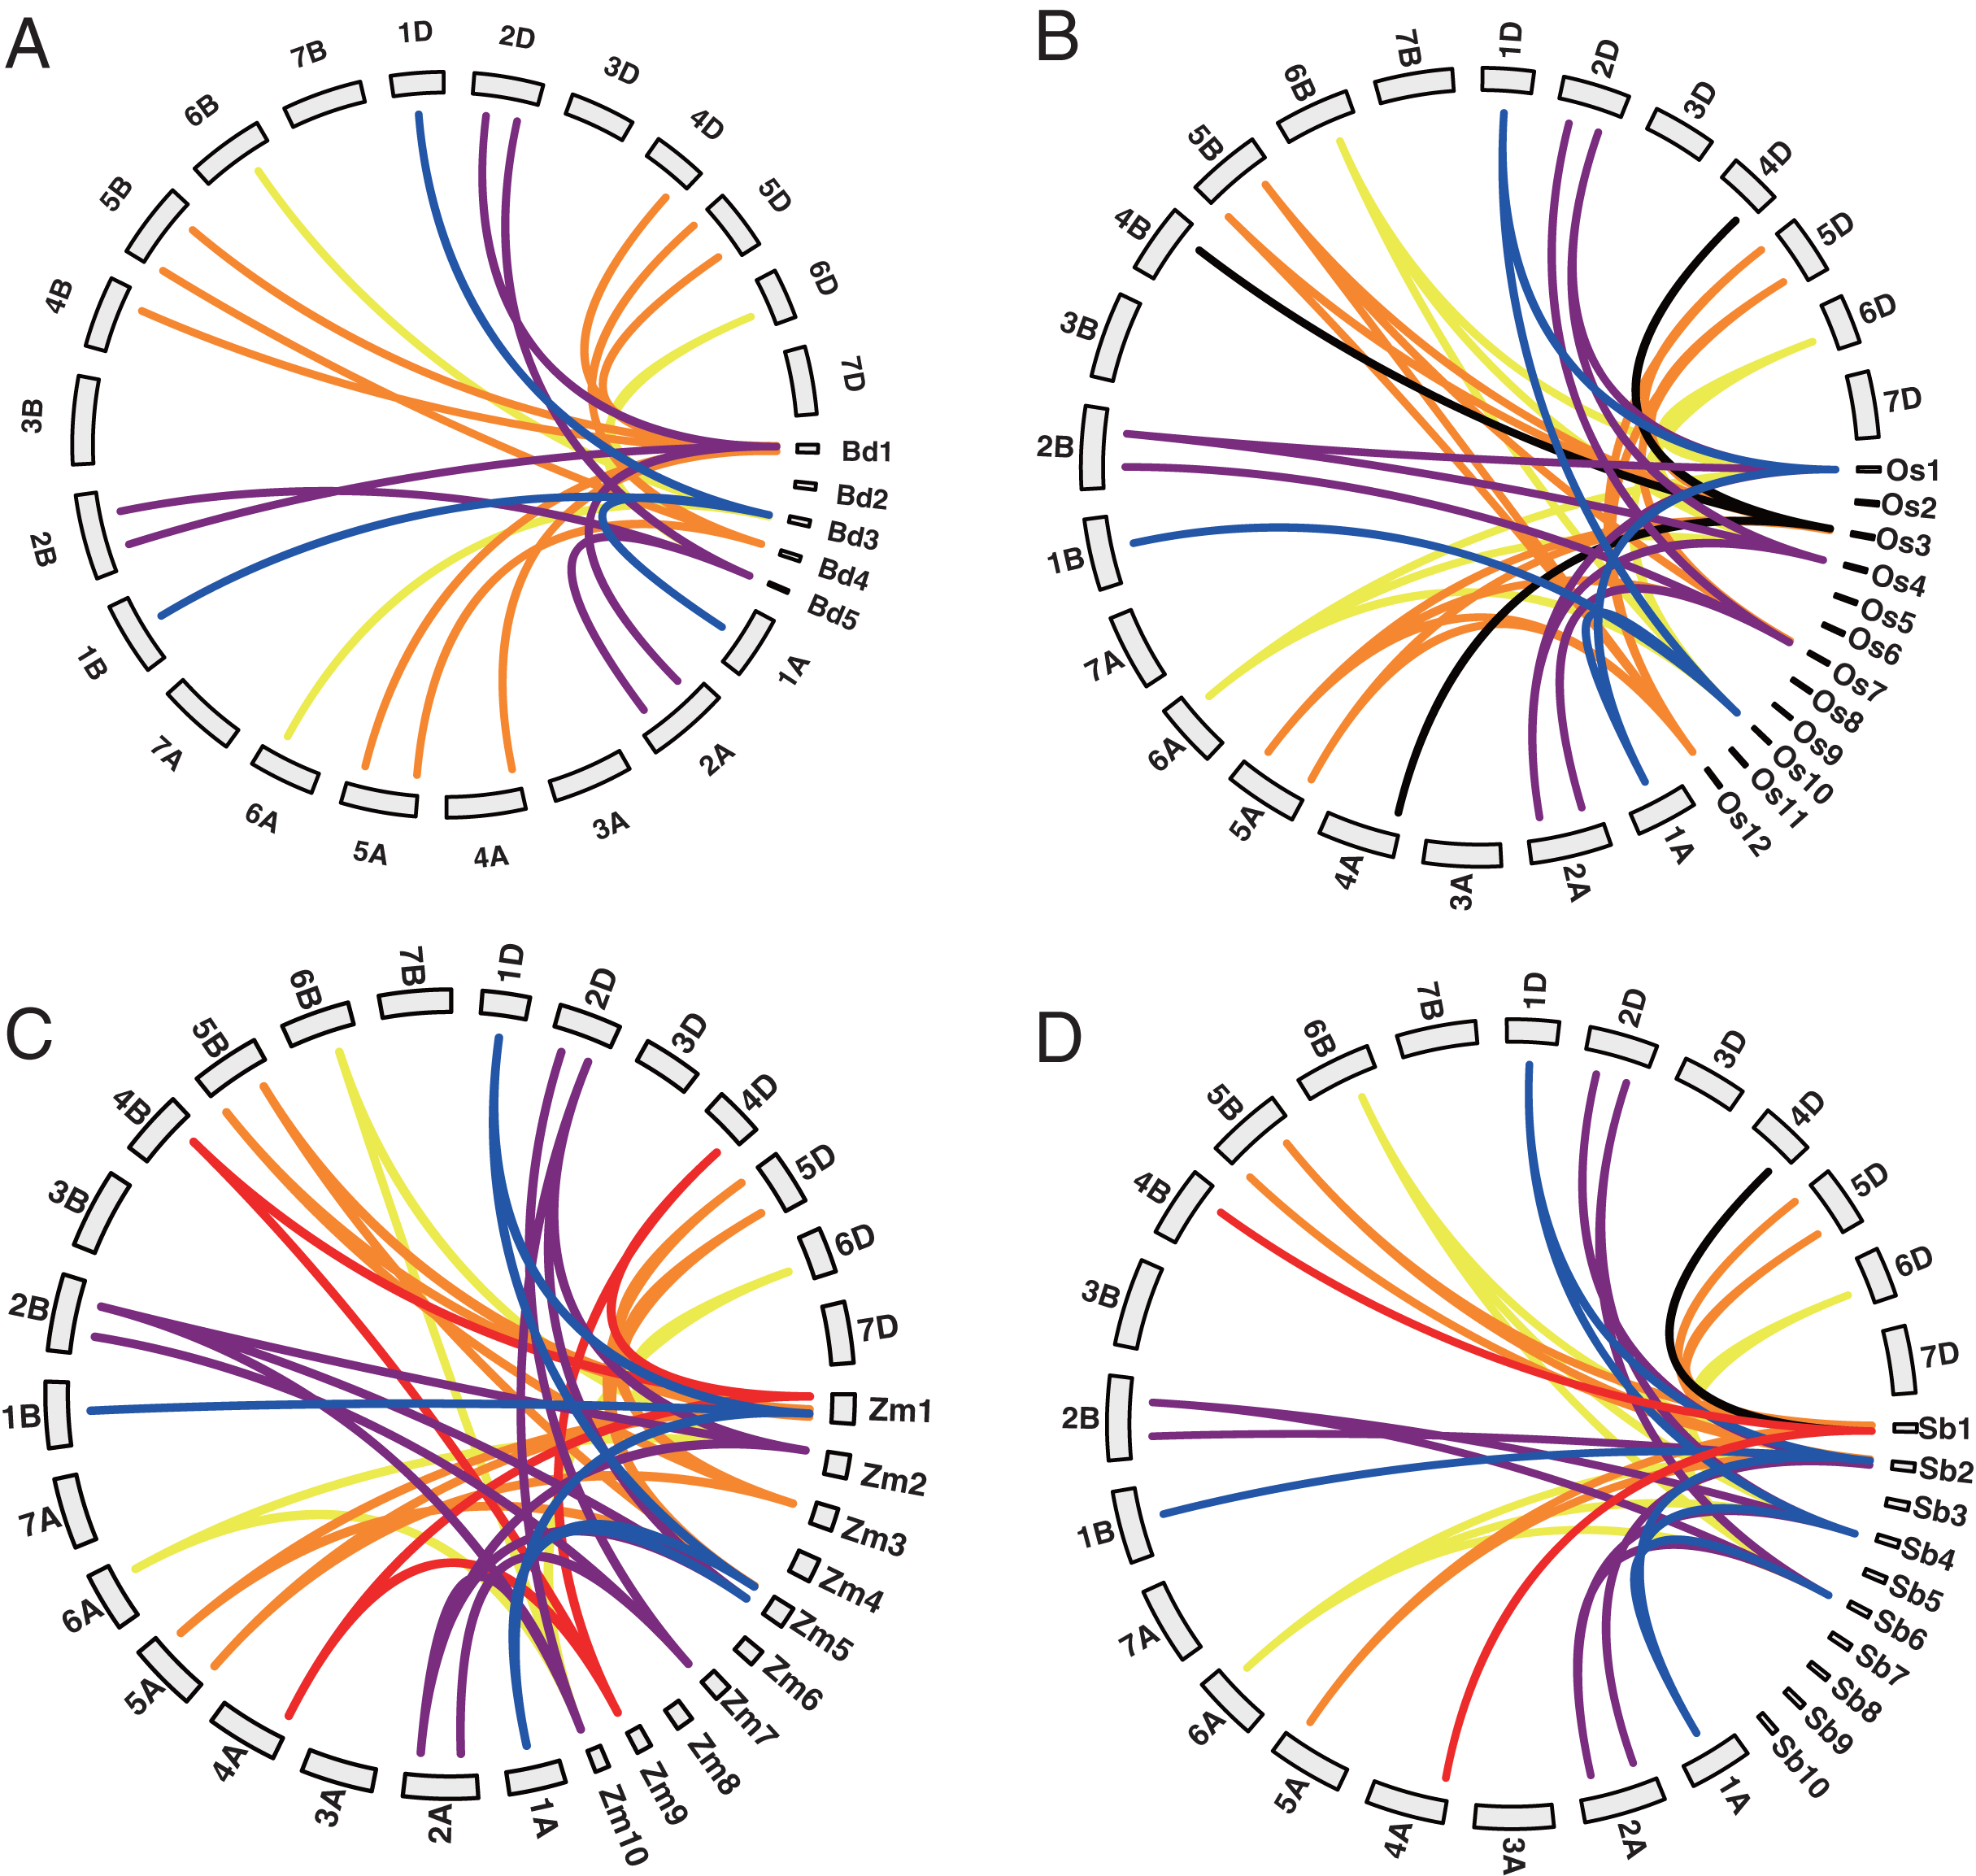
Among the 20 TaYABBY genes, three segmental duplication events were constructed by four TaYABBY genes (Table S2). In addition, 0, 0, 7, 8, 12, and 8 orthologous were found between wheat and Arabidopsis, Brassica napus, Brachypodium, rice, maize, and sorghum respectively (Table S3 and Fig. 1). These results indicate that TaYABBY genes in monocot plants are closely related.
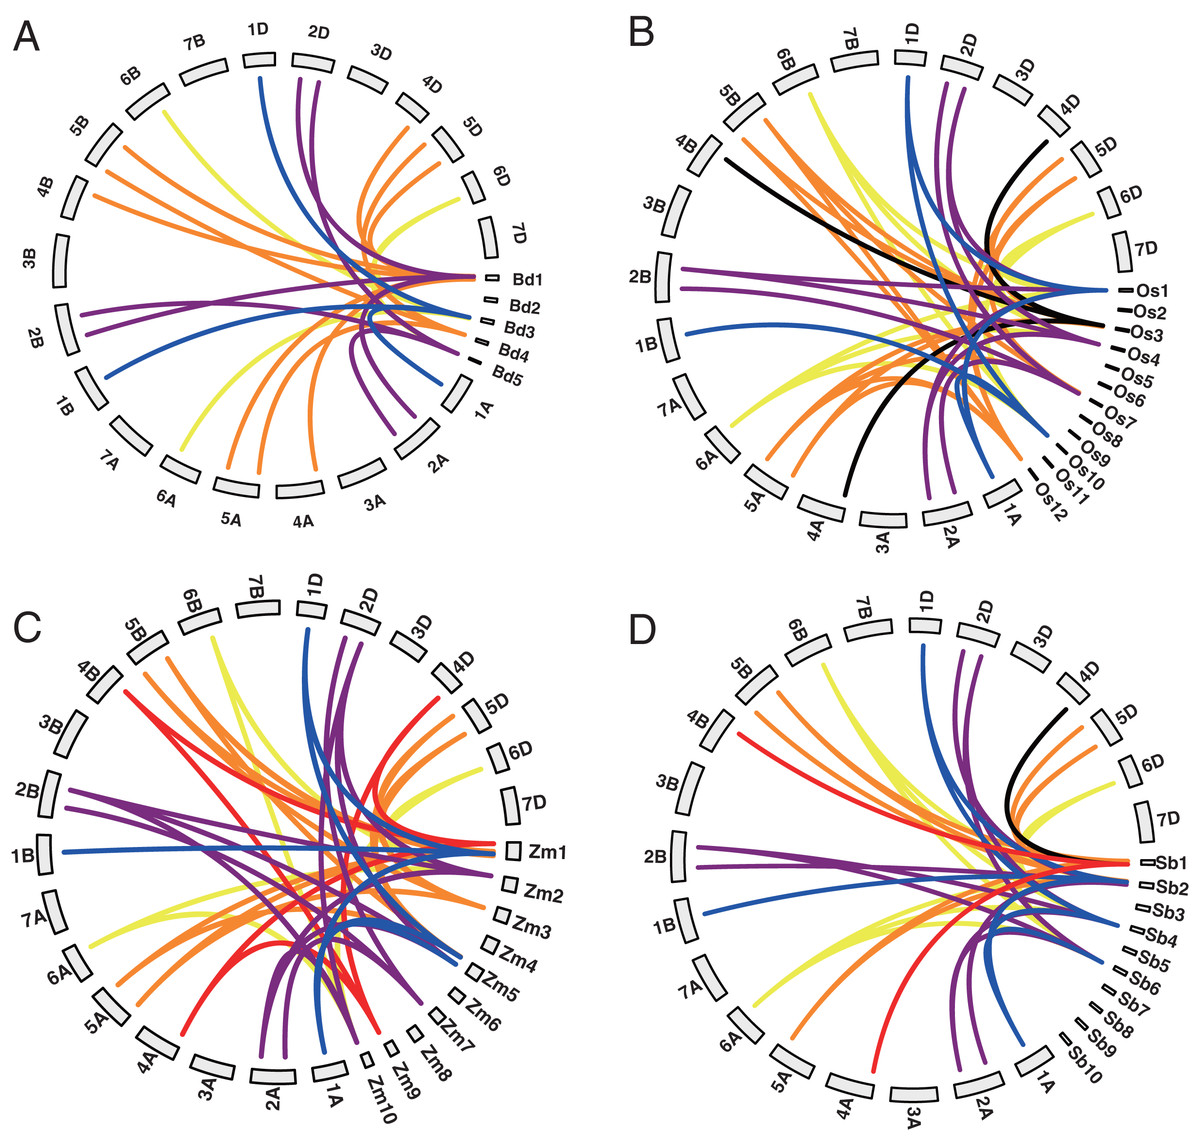
Figure 1: Collinearity analysis between wheat and (A) Brachypodium, (B) rice, (C) maize, and (D) sorghum. The lines represent collinearity genes.
Phylogenetic tree of wheat YABBYs
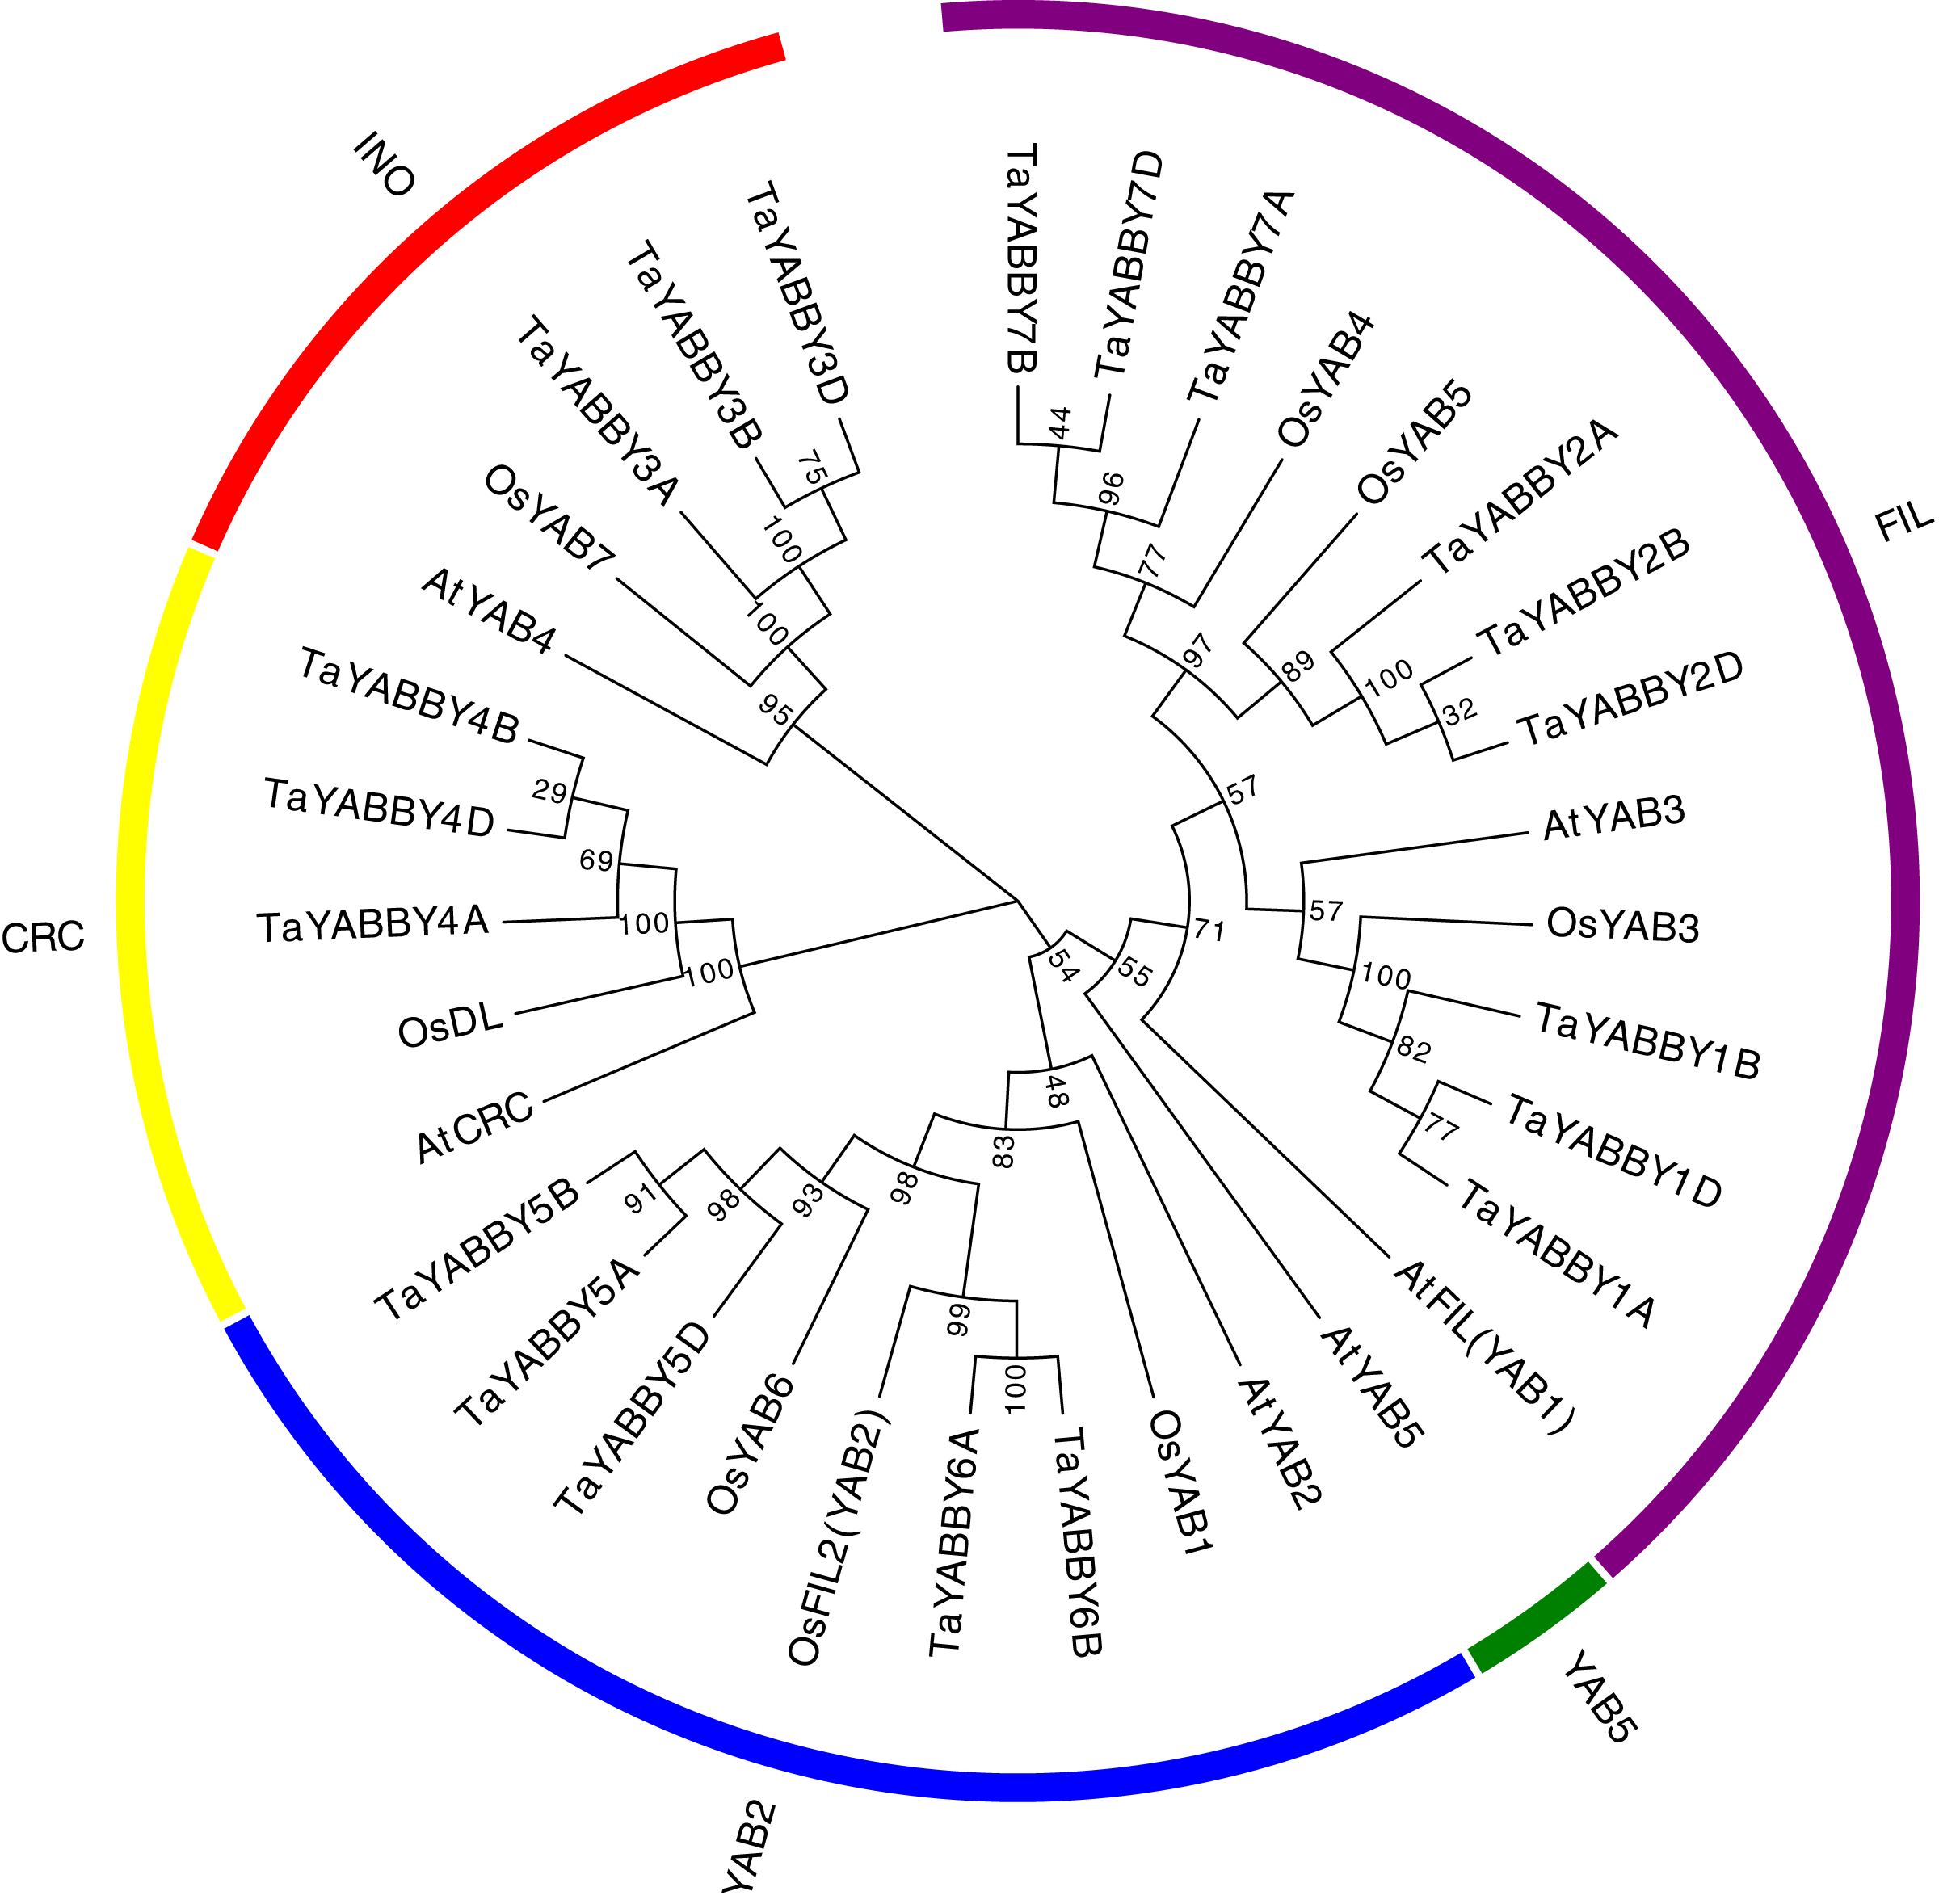
To better understand the phylogenetic relationship of YABBY genes among rice, wheat, and its ancestor species, an NJ tree was constructed. Consistent with previous reports, these YABBY proteins can be classified into five subgroups, including 5 CRC, 5 INO, 9 YAB2, 14 FIL, and 1 YAB5 member (Fig. 2). To further evaluate the accuracy of the NJ tree, we created a tree topology using the maximum likelihood (ML) method. This tree topology was the same as that of the NJ tree in Fig. S1, indicating that the tree is suitable for further analysis. In clade YAB1, no genes of wheat or its ancestor species were included. Clade FIL is a large group, which contains night wheat YABBY members.
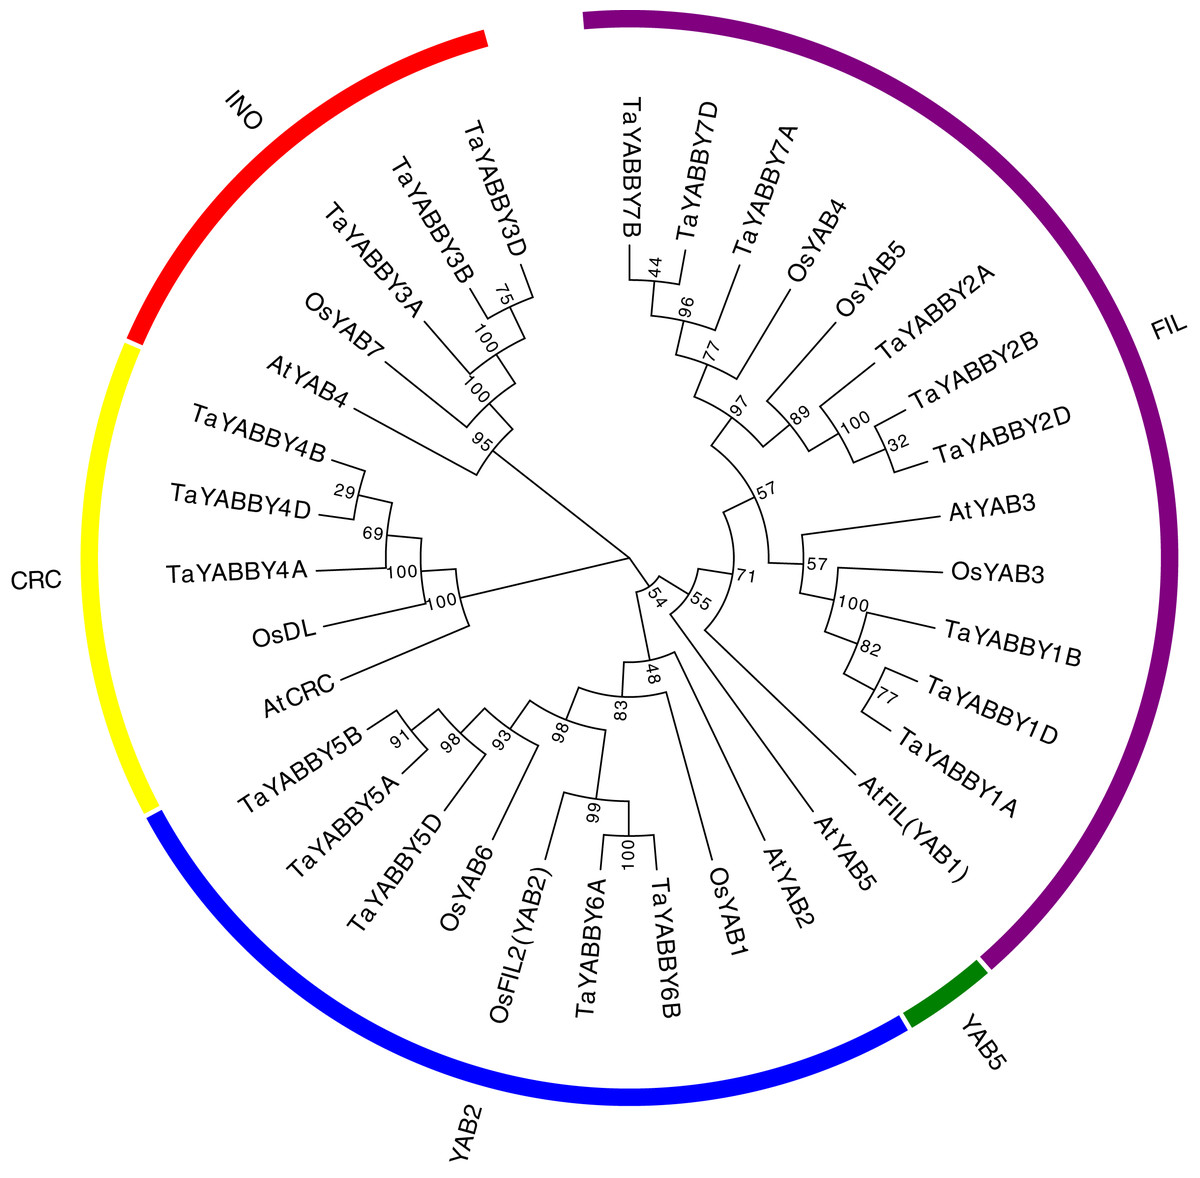
Figure 2: Phylogenetic relationship of wheat and rice, Arabidopsis YABBY genes.
An unrooted NJ phylogenetic tree was also constructed in wheat YABBYs; 9, 5, 3, and 3 TaYABBYs were classified into the FIL, YAB2, INO, and CRC groups (Fig. 2A).
Structural characteristic analysis of TaYABBY TFs
Two highly conserved domains were identified in all TaYABBYs, including a C2–C2 zinc finger domain at the N-terminus and a YABBY domain at the C-terminus (Fig. 3). Within the C2–C2 domain (C-X2-C-X20-C-X1-HC), the cysteine (C) and histidine (H) residues directly involved in Zn2+ binding are conserved. At the C-terminus, 28 conserved amino acids were 100% conserved inside the YABBY domain, including five alanine (A), three proline (P), three serine (S), three isoleucine (I), and other amino acid residues. The YABBY domain, like the HMG-box domain, has been confirmed to be associated with DNA binding (Sawa et al., 1999). In plants, the YABBY domain of Arabidopsis CRC is able to bind to the promoter regions of KCS7 and KCS15, two genes involved in the synthesis of very long chain fatty acids (Han, Yin & Xue, 2012). The YABBY domain of rice OsYABBY1 specifically binds to a GA-responsive element in the promoter of 2GA3ox2 (Dai et al., 2007), and the FIL has been confirmed to bind non-specifically to DNA via its YABBY domain (Kanaya, Nakajima & Okada, 2002). These results indicate that YABBY domain is the main structural domain that performs the function, and that the main amino acids play dominant roles.
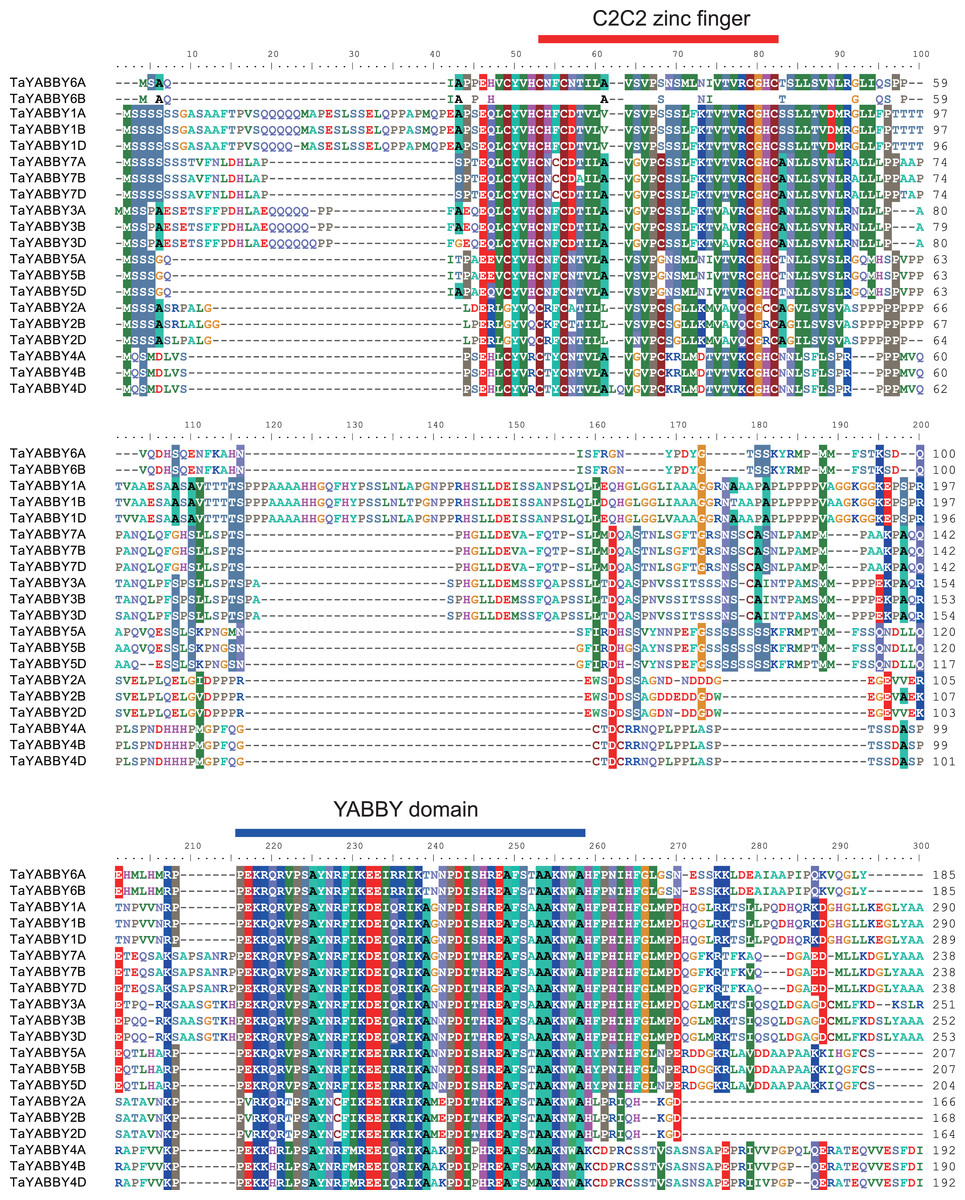
Figure 3: Sequence alignment of the wheat YABBY proteins.
Two conserved regions were identified, including C2C2 zinc finger region in the N-terminal and YABBY domain in the C-terminal.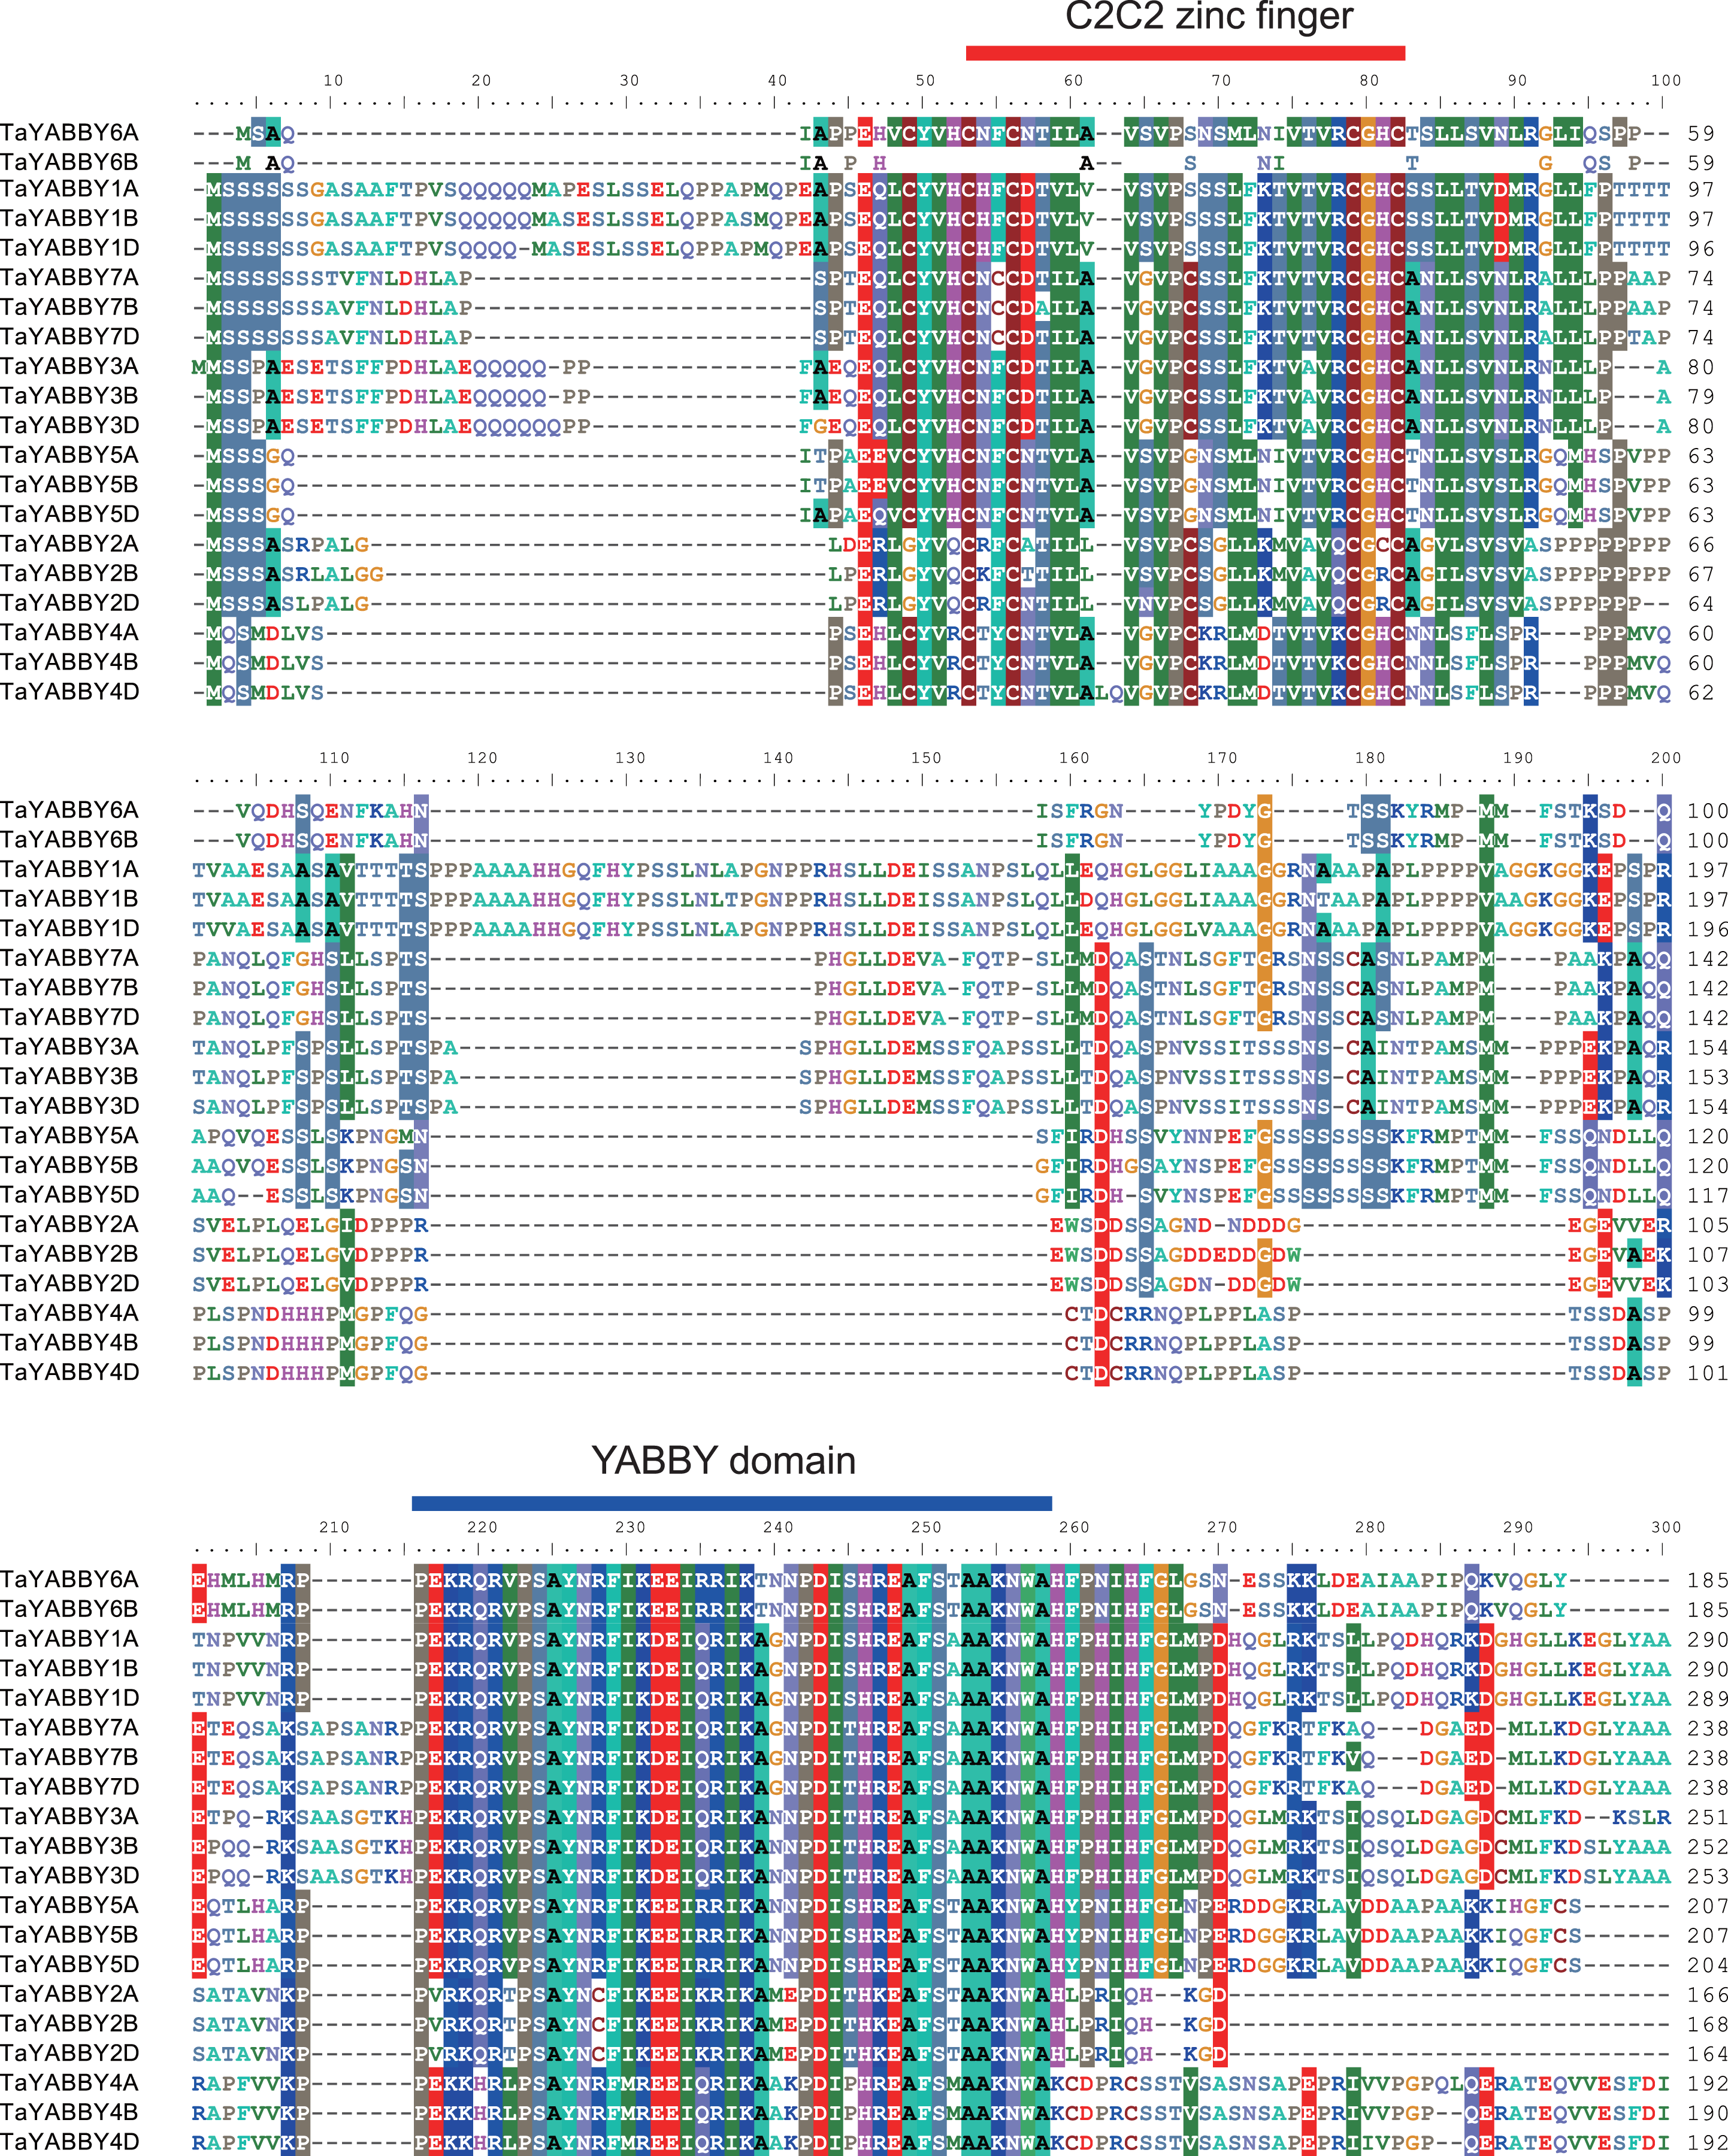
Members of the same group shared similar conserved motifs and structures. As shown in Fig. 4B, motifs were conserved within the same group; motifs 1, 2, 3, and 4 were found in all TaYABBYs, while motif 5 was only identified in FIL and INO members. Among them, motifs 1 and 4 constitute the YABBY domain, while motifs 2 and 3 form the C2–C2 domain at the N-terminus. All TaYABBY genes contained six or seven exons, and the phylogenesis-related genes had similar gene structures (Fig. 4C).
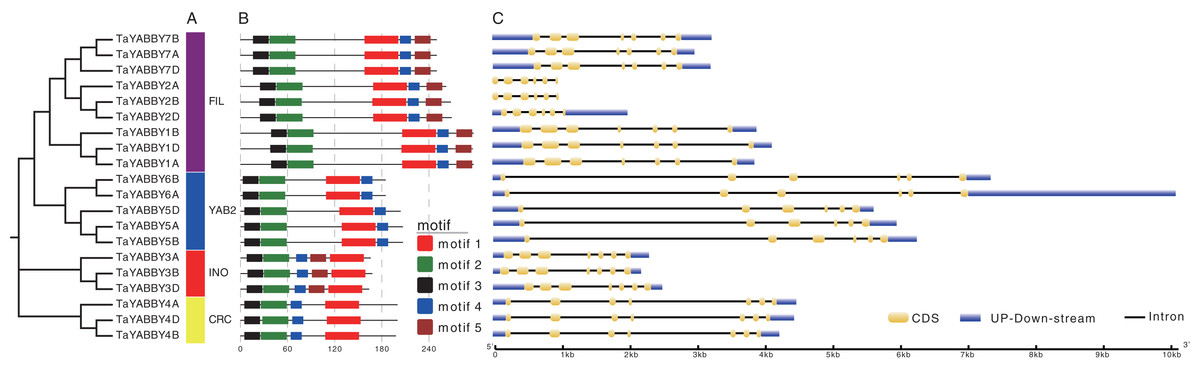
Figure 4: Phylogenetic, conserved motifs, and gene structures analyses of the wheat YABBY TFs.
(A) Wheat YABBY TFs were classified into four clades, including FIL, YAB2, INO, and CRC. (B) Five conserved motifs were identified in TaYABBYs. (C) Gene structures of TaYABBY genes.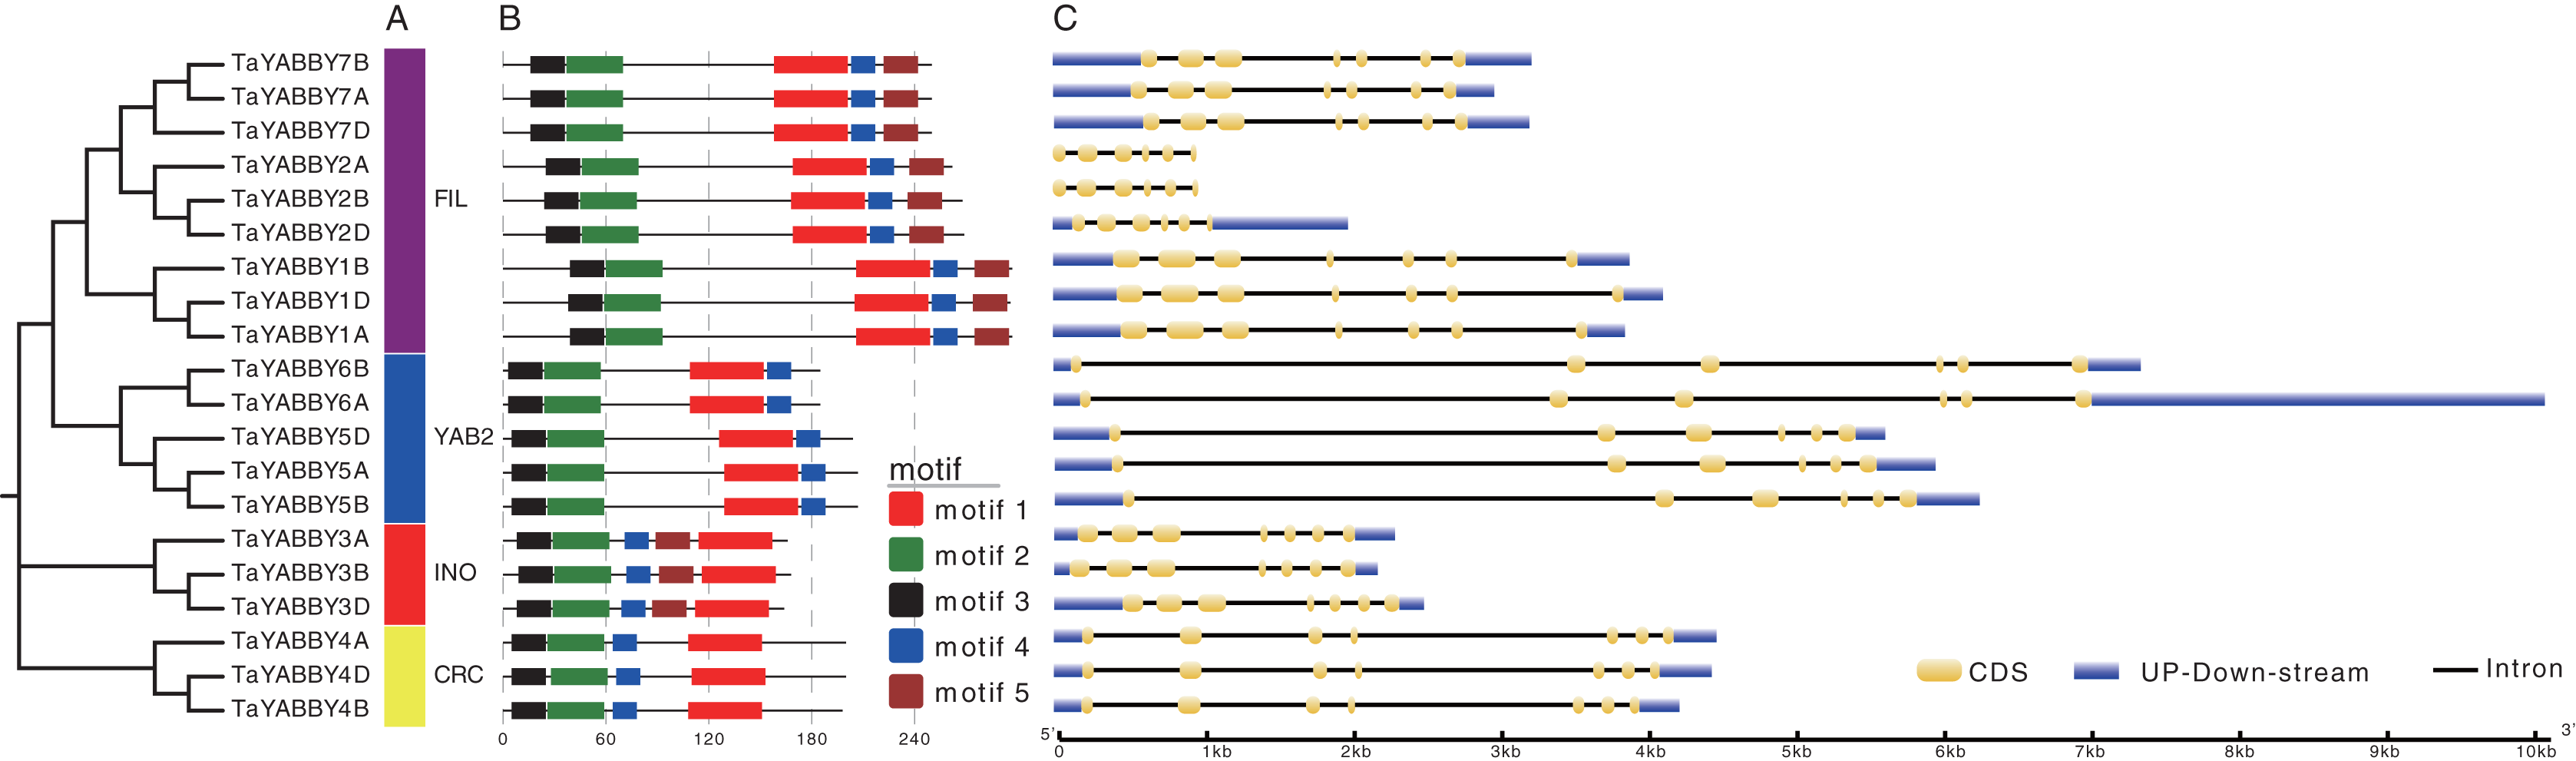
Expression pattern of wheat YABBY genes
We used quantitative reverse transcription PCR (qRT-PCR) to analyse the expression patterns of TaYABBY genes in different tissues. The results showed that many TaYABBY genes were highly expressed in leaf tissues (Fig. 5), including TaYABBY1A/D, 4A, 4B, 4D, 5A, 5B, 5D, 6A/B, and 7A/B/D. Some homoeologous genes had similar expression patterns; for example, TaYABBY4A, TaYABBY4B, and TaYABBY4D are highly expressed in leaf tissues; TaYABBY7A, TaYABBY7B, and TaYABBY7D are mainly expressed in leaf tissues.

Figure 5: Expression patterns of TaYABBY genes in different tissues by qRT-PCR.
The horizontal coordinates indicate the different tissues and the vertical coordinates indicate the relative expression levels. Student’s t-test demonstrated that statistically significant differences: *P < 0.05; **P < 0.01.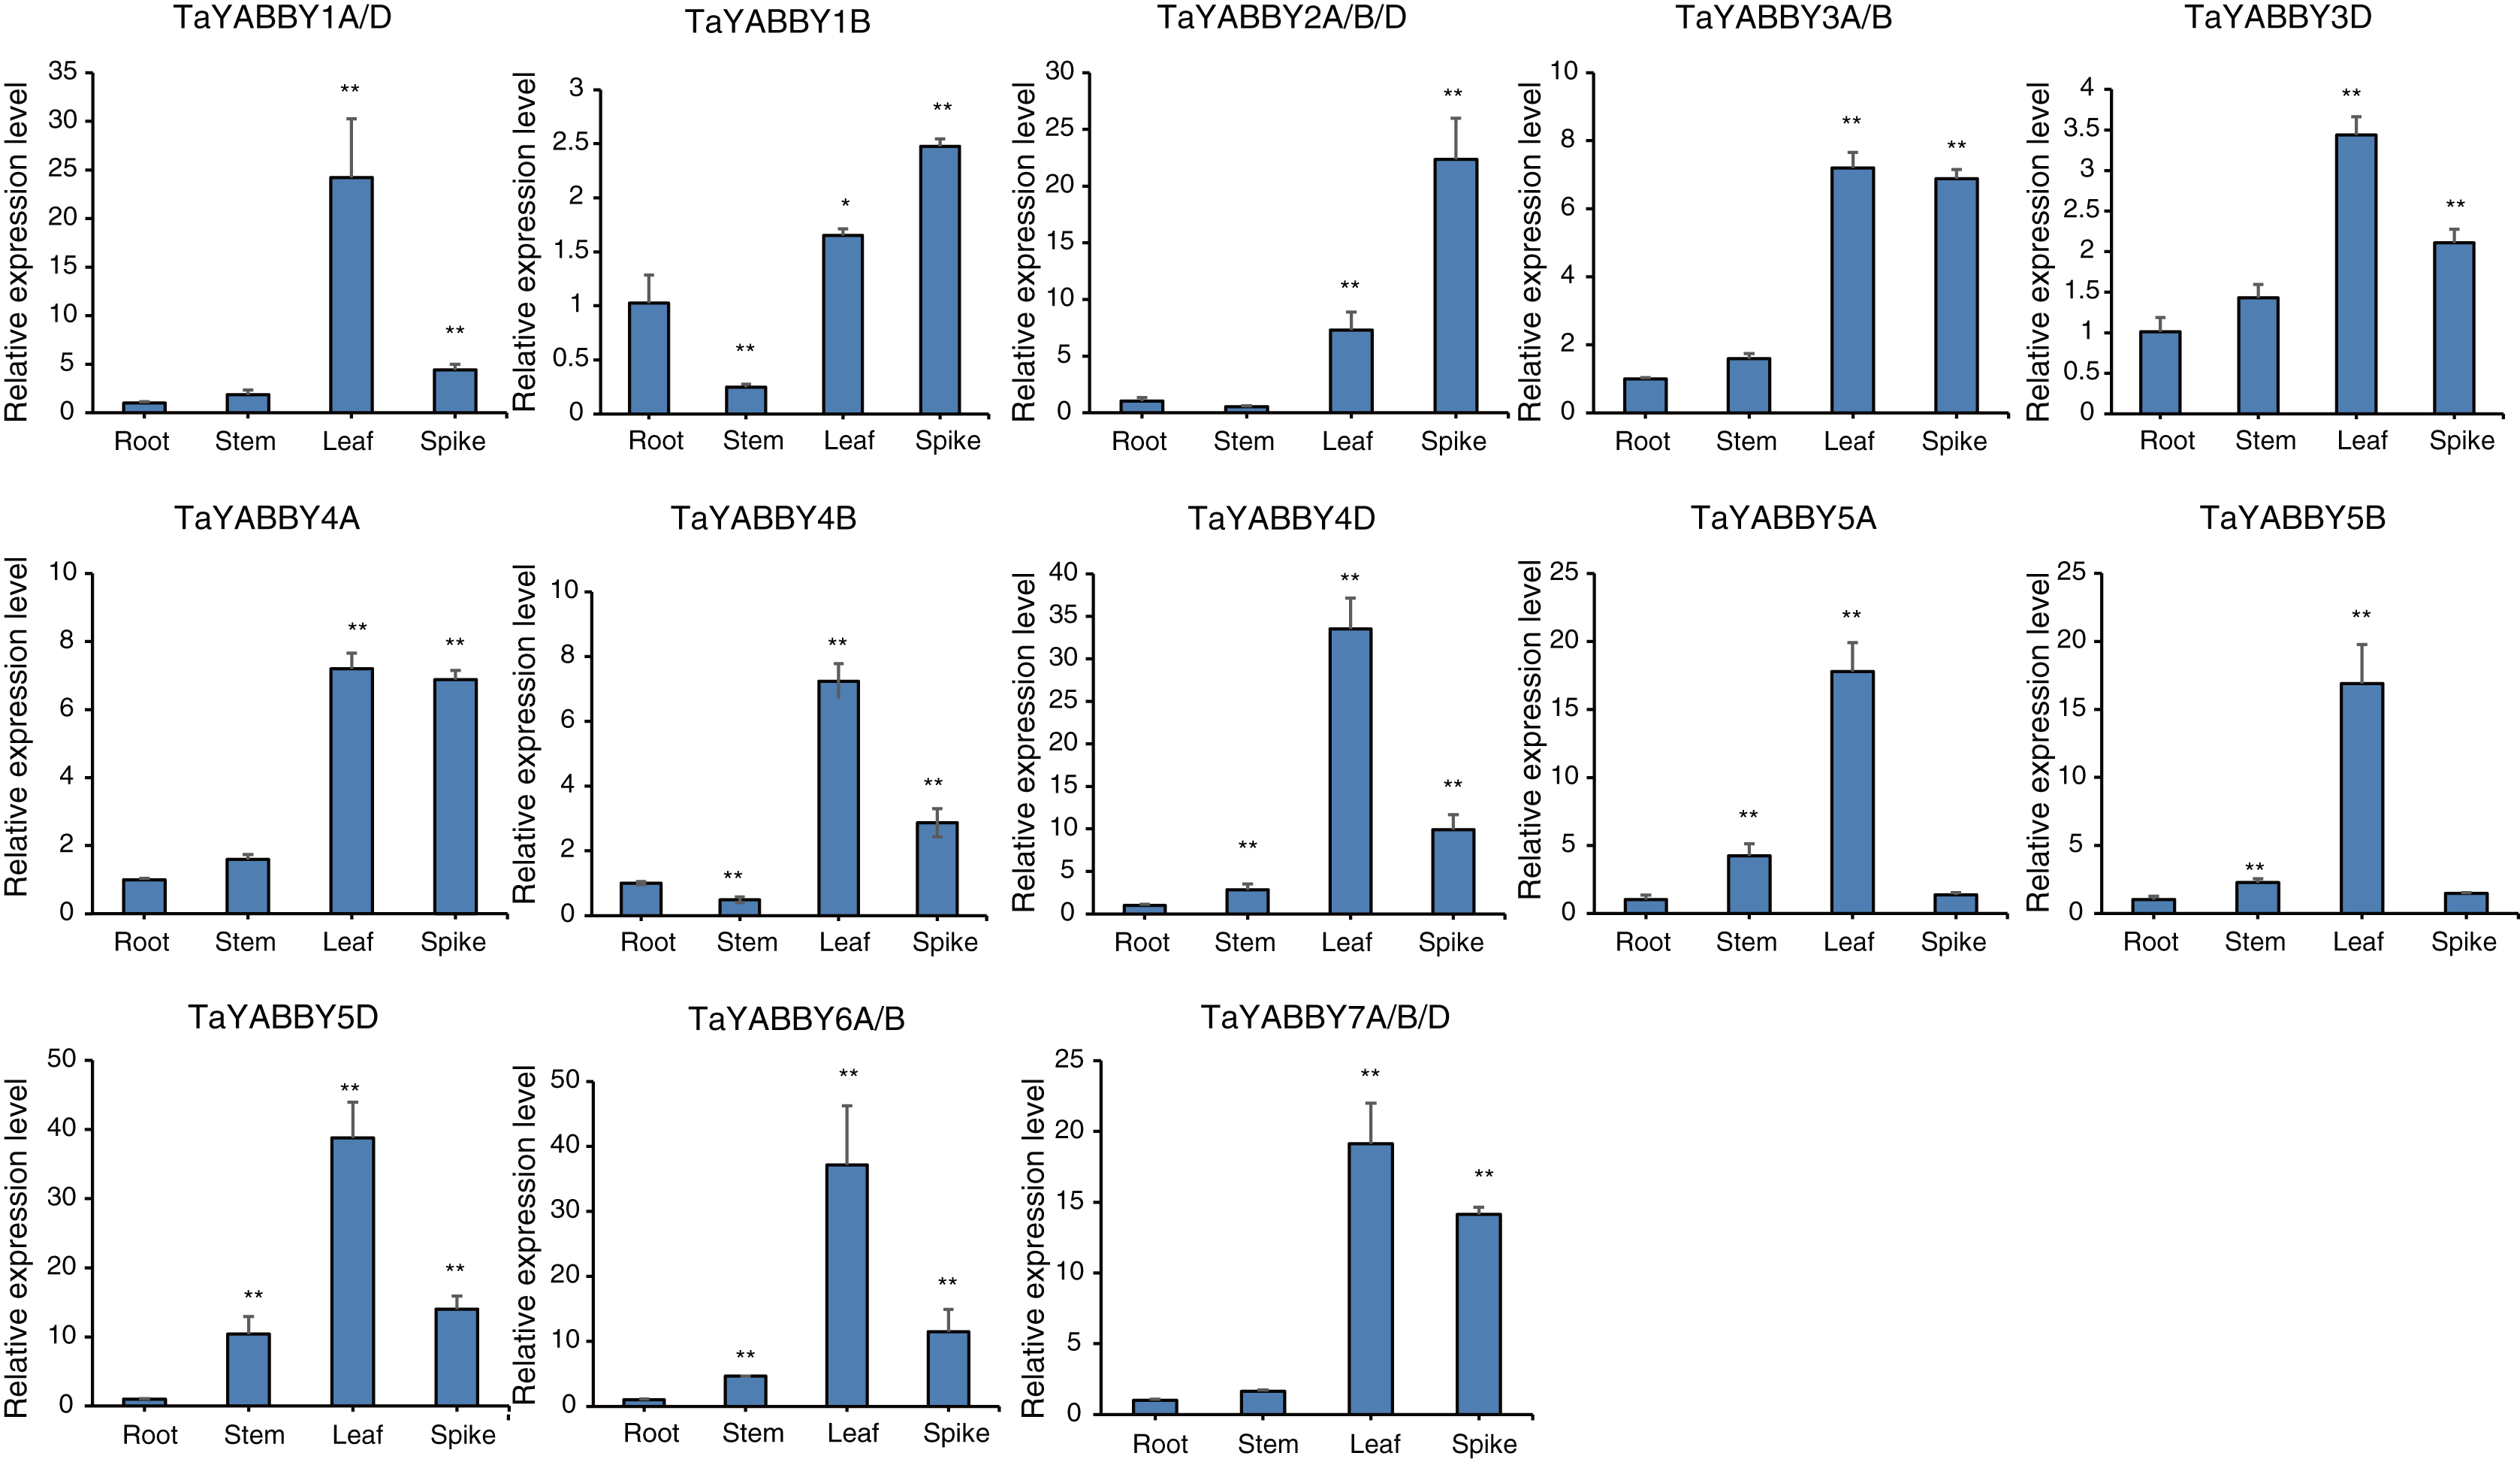
We also analysed the expression patterns under different abiotic stress conditions. As shown in Fig. 6, the expression of all of them was induced by abiotic stresses; 13 and 10 were upregulated by salt and PEG treatments, respectively, while 10 and 10 were down-regulated by heat and cold treatments, respectively. Because all TaYABBY genes were upregulated by salt, we also analysed the expression patterns of TaYABBY genes under salt stress at different time points. As shown in Fig. 7, the expression levels of all genes peaked at 2 h, and then began to decline, indicating that the expression of the YABBY gene can be induced in a short period of time by salt stress. These results indicate that TaYABBY genes are involved in plant responses to abiotic stresses.
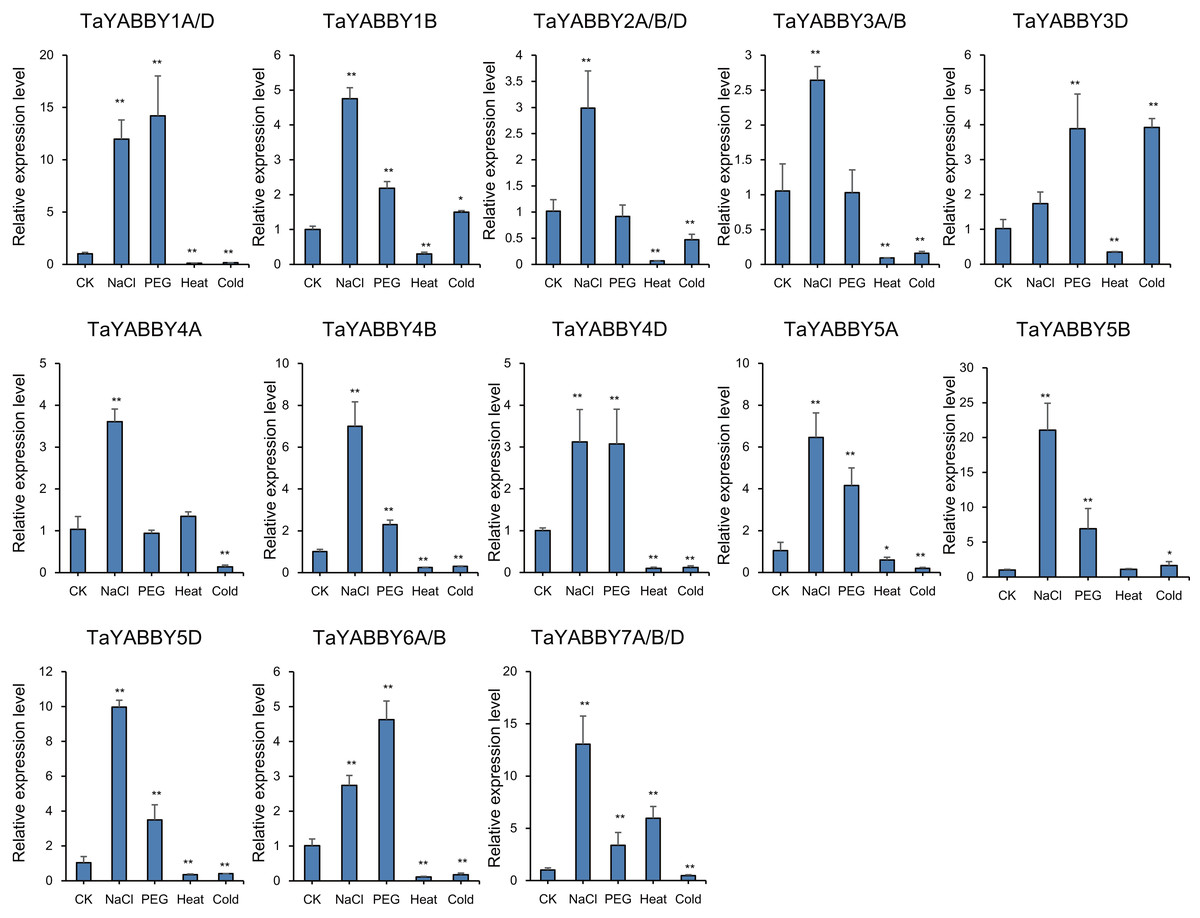
Figure 6: Expression patterns in TaYABBY genes under different abiotic stresses.
The horizontal coordinates indicate different abiotic stresses and the vertical coordinates indicate the relative expression levels. Student’s t-test demonstrated that statistically significant differences: *P < 0.05; **P < 0.01.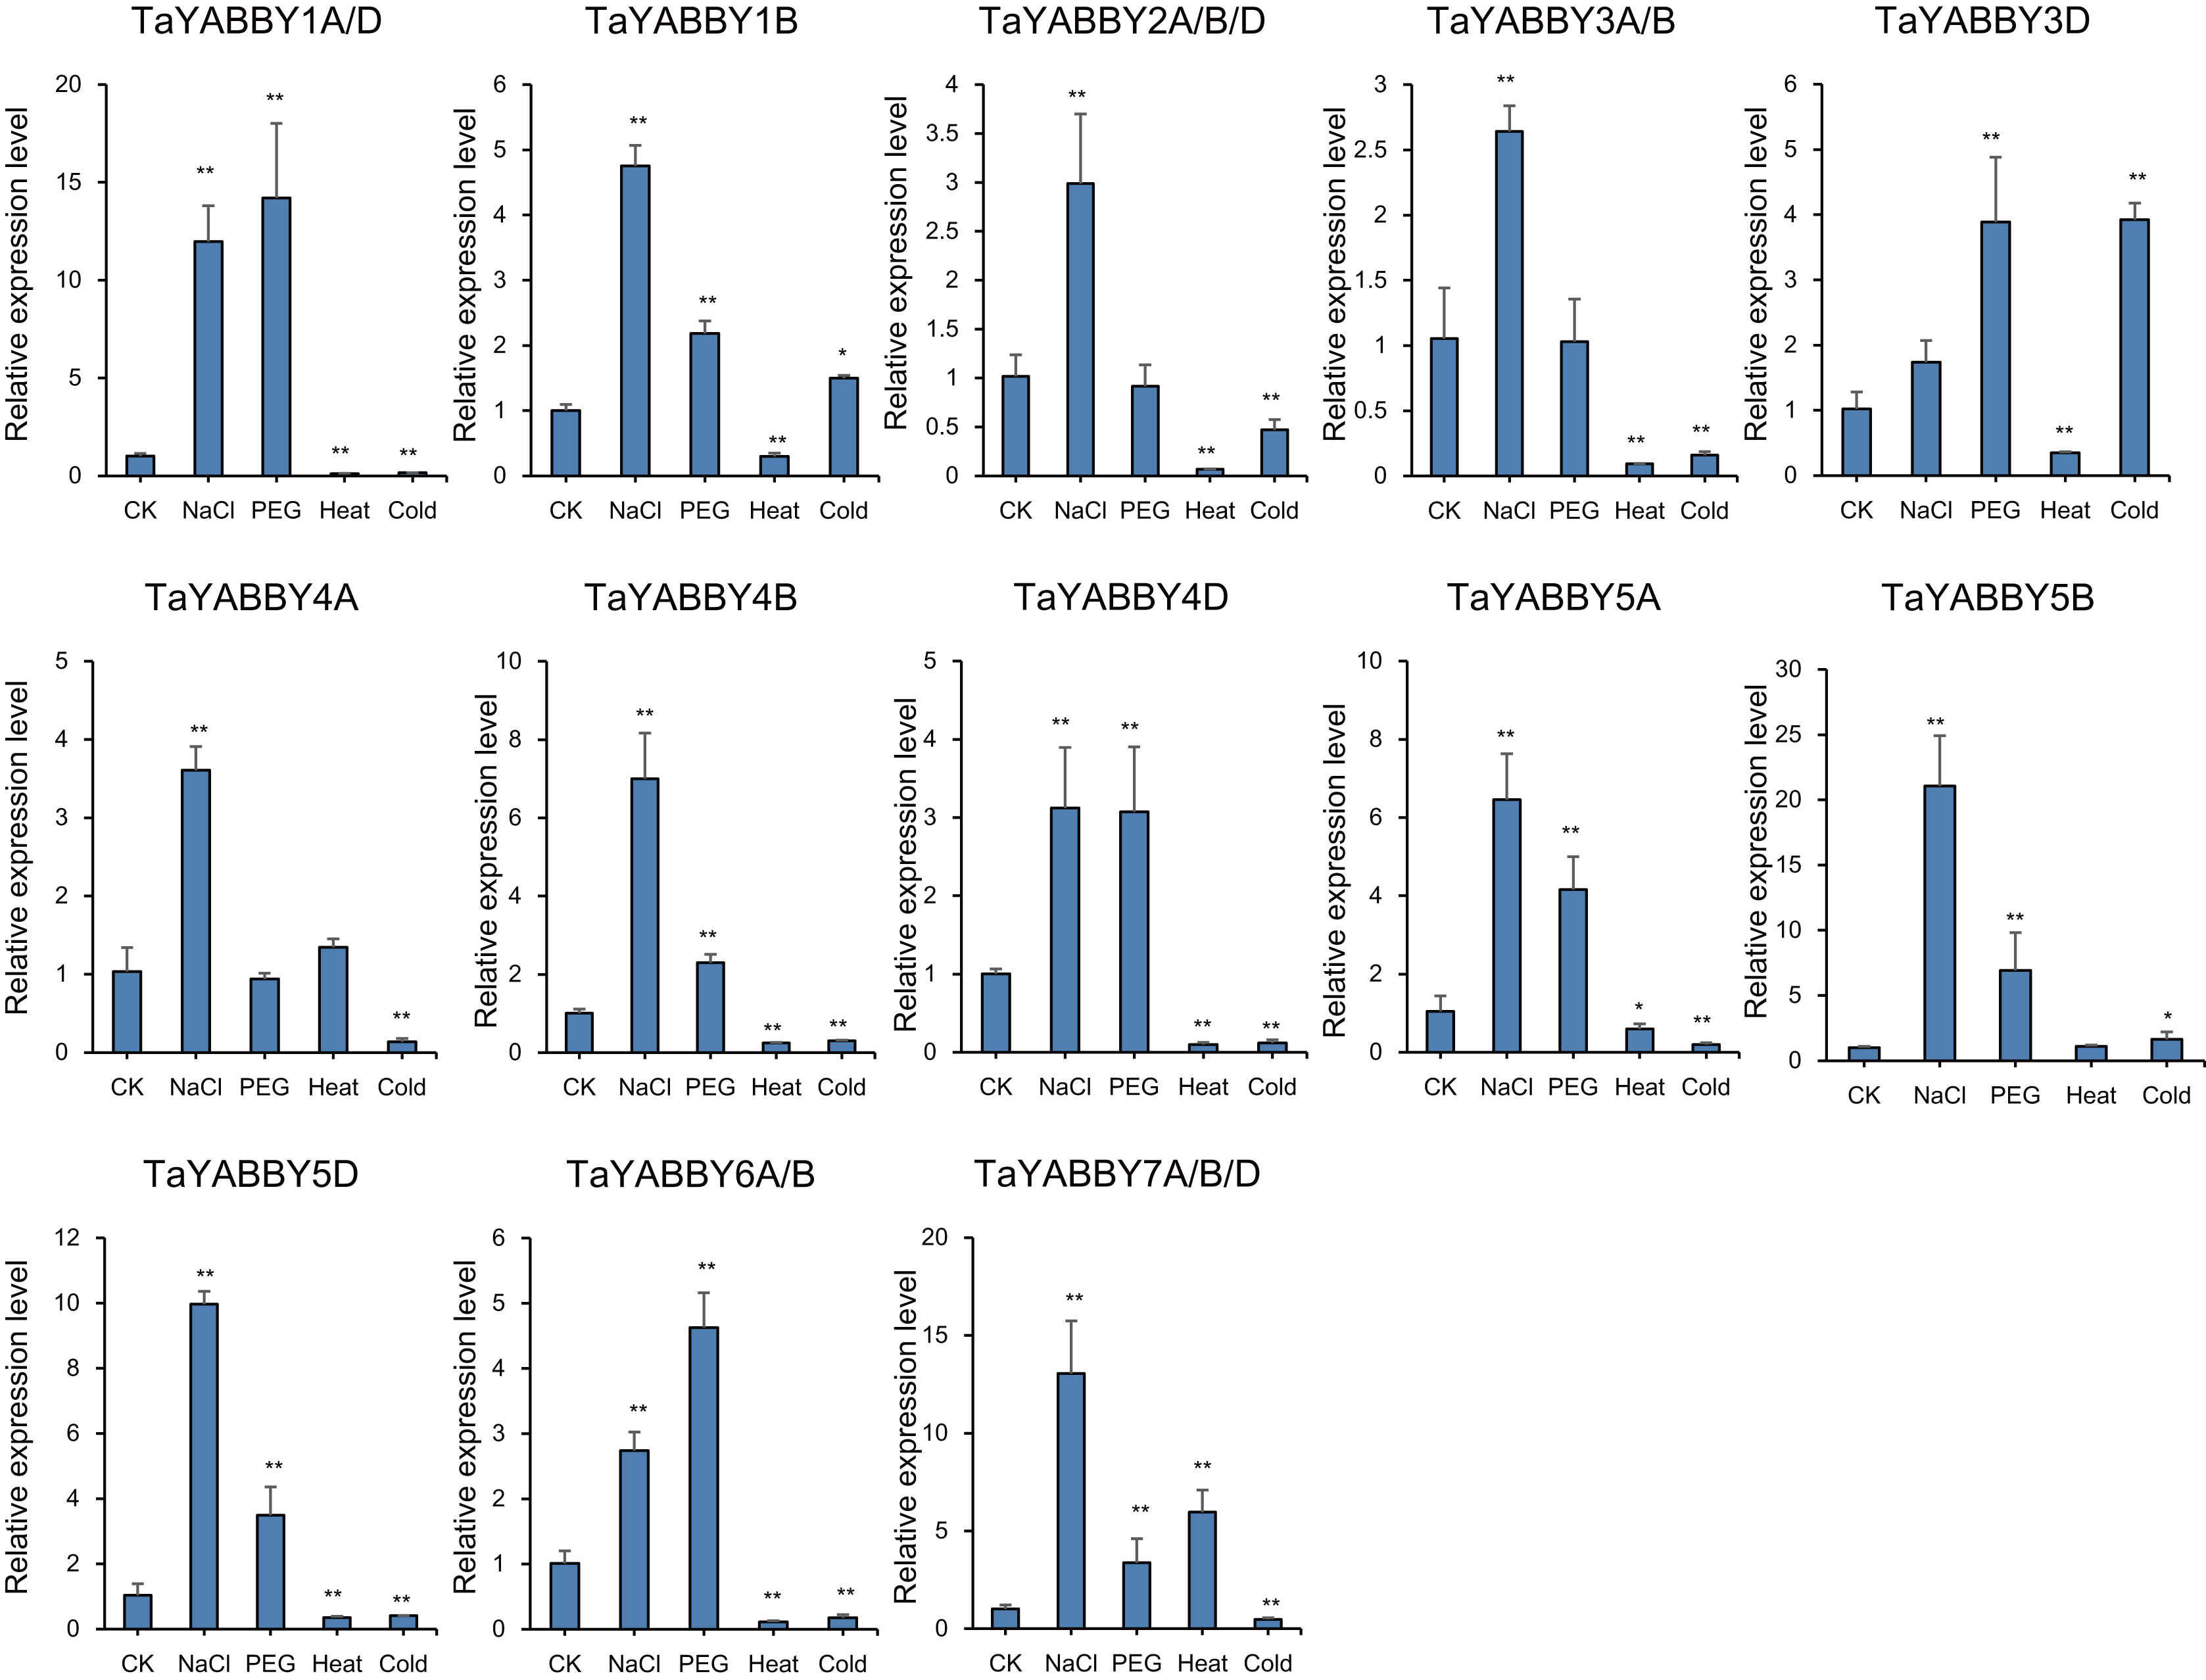
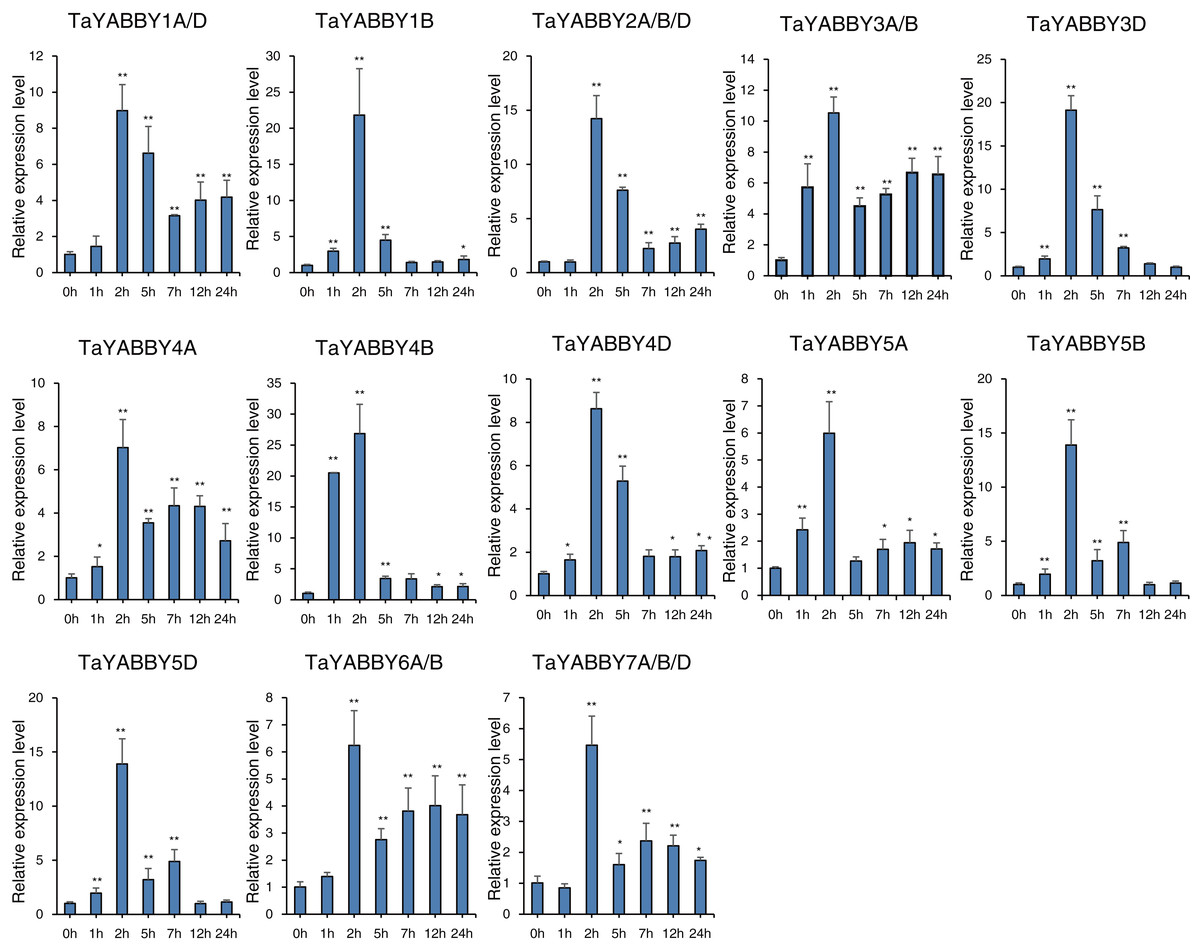
Figure 7: qRT-PCR analysis of TaYABBY genes under salt stress at different time points.
The horizontal coordinates indicate the different time points and the vertical coordinates indicate the relative expression levels. Student’s t-test demonstrated that statistically significant differences: *P < 0.05; **P < 0.01.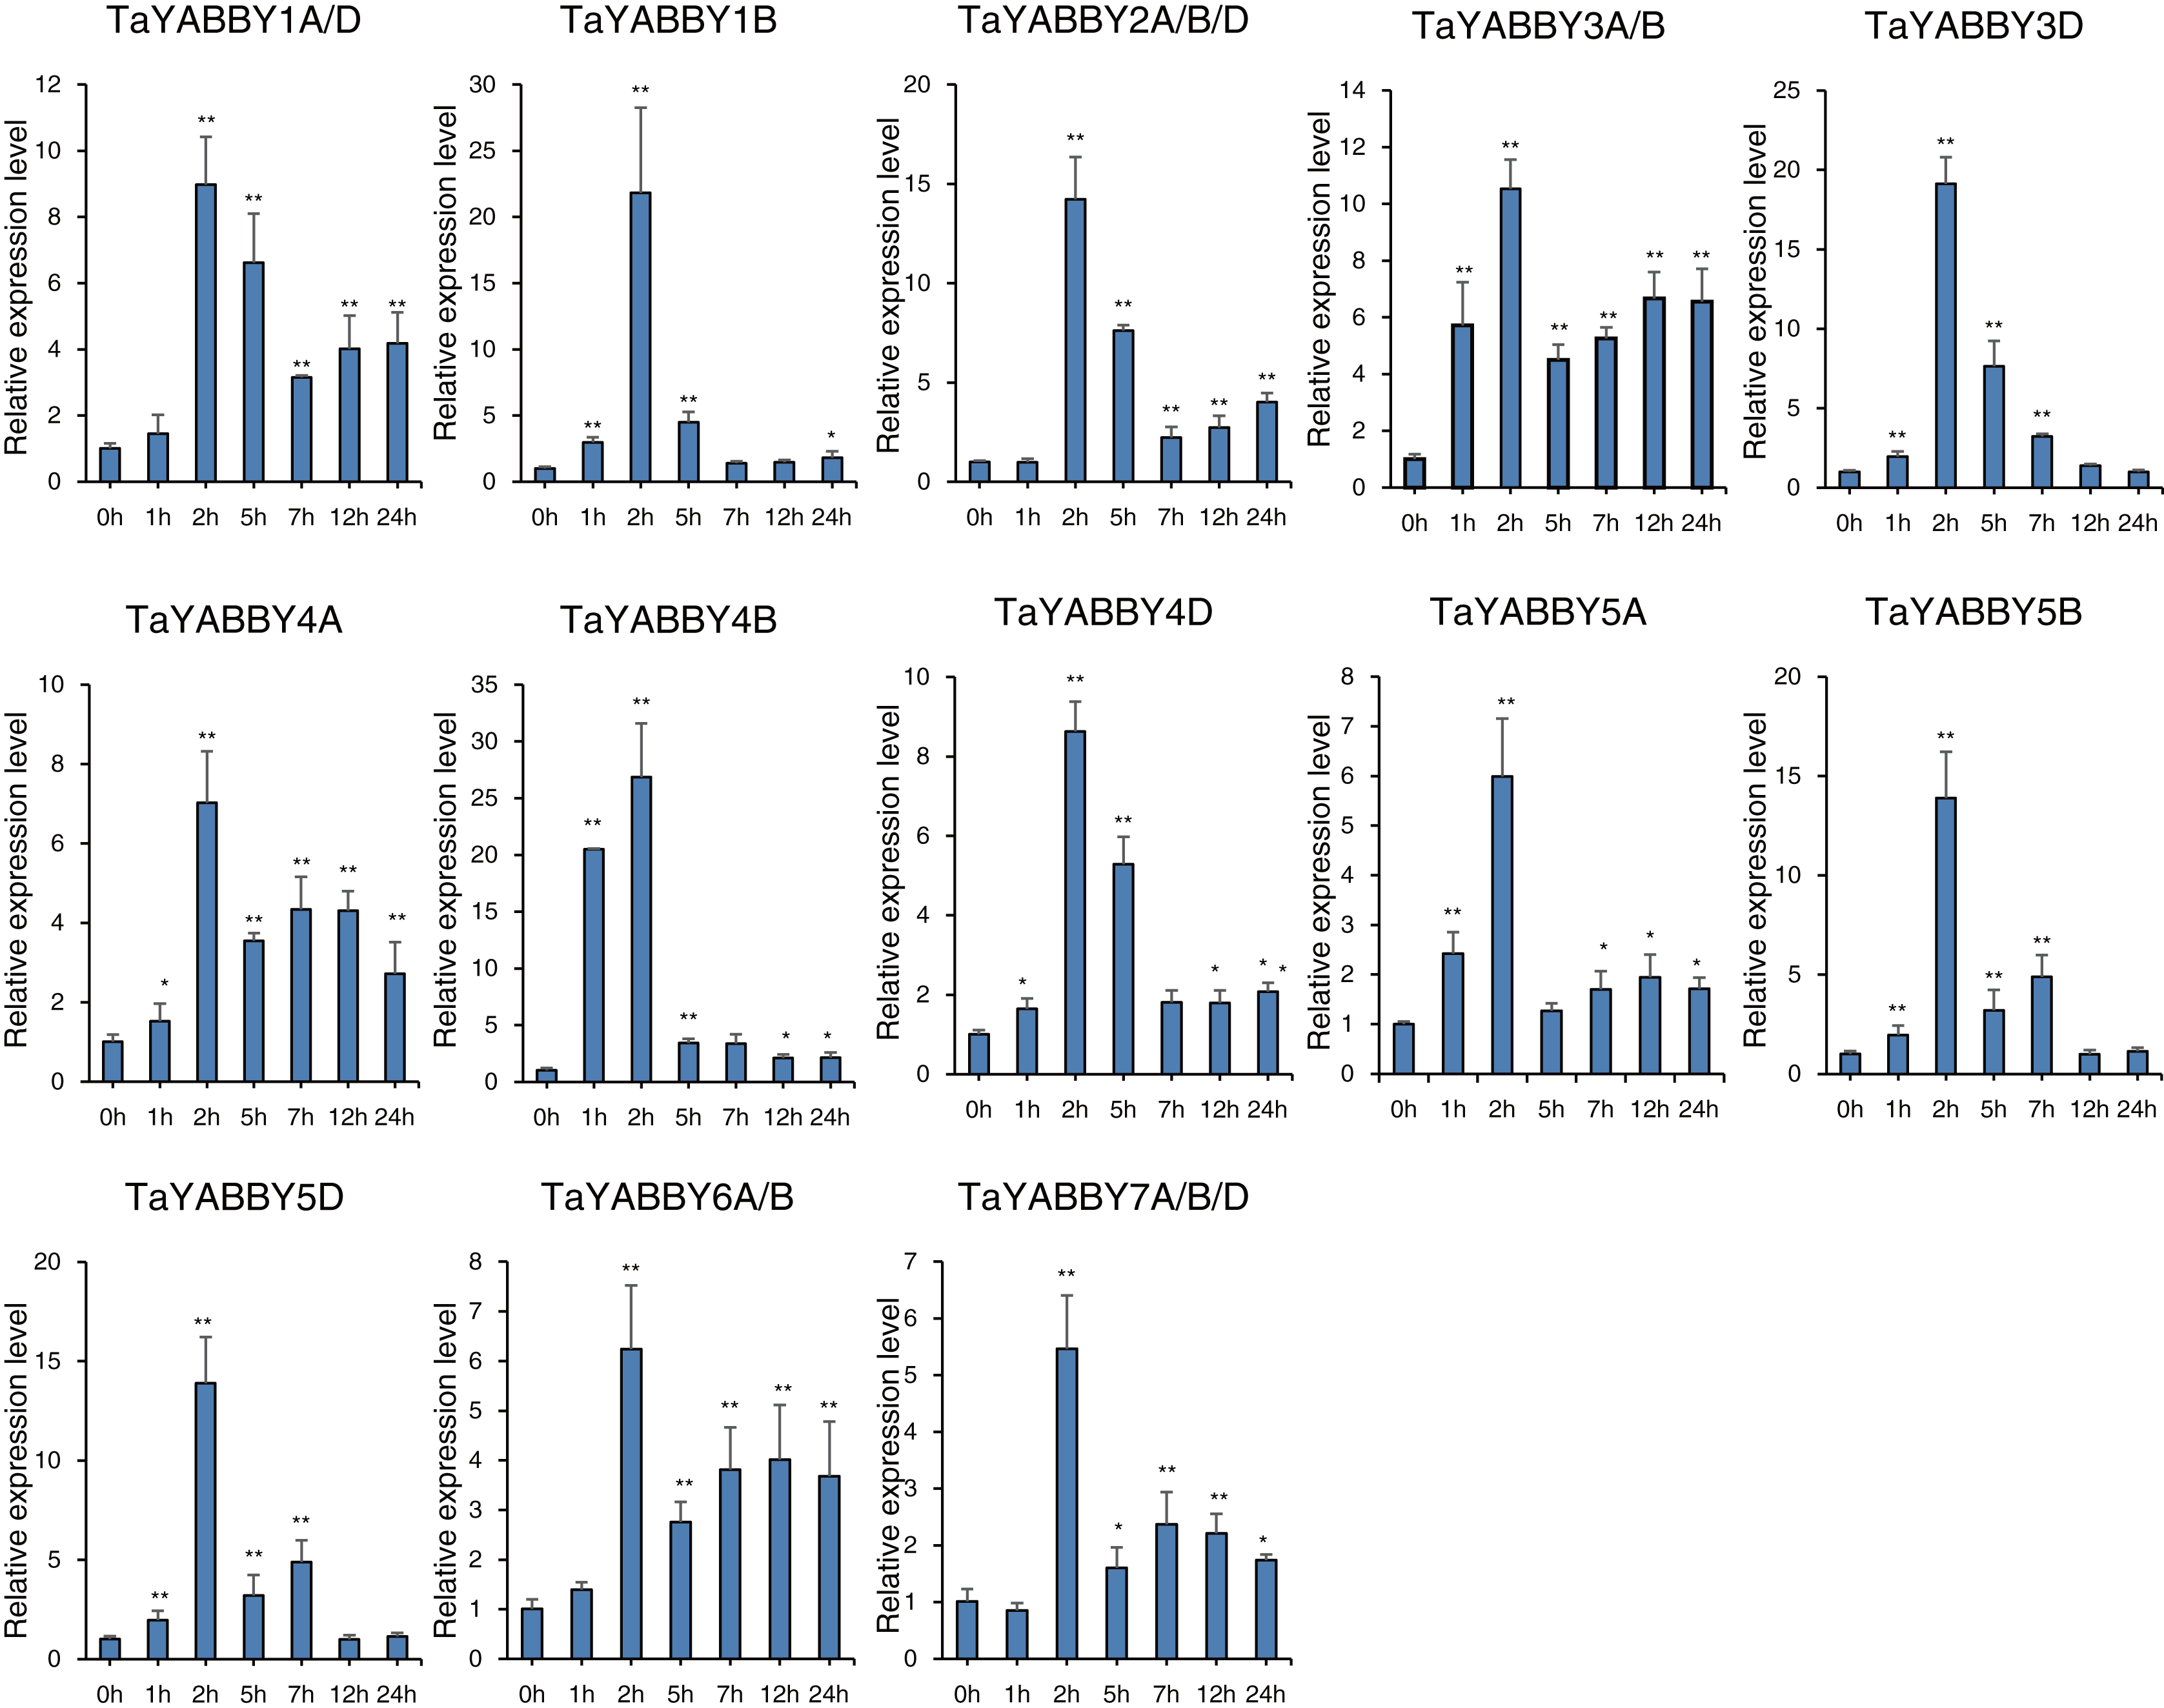
Discussion
In the present study, 20 YABBY TFs were identified in wheat. There are more YABBY members in wheat than in rice (Toriba et al., 2007), Arabidopsis (Siegfried et al., 1999), soybean (Zhao et al., 2017), tomato (Huang et al., 2013), and Moso Bamboo (Ma et al., 2021), indicating that wheat YABBY has a more complex function. This reason is because wheat is a heterozygous polyploid. Phylogenetic analysis revealed that all TaYABBY TFs are classified into four clades: FIL, YAB2, INO, and CRC. The YAB5 clade does not exist in rice and other monocots (Toriba et al., 2007), perhaps because YABBY has undergone functional differentiation during the process of plant evolution.
A collinearity analysis showed that wheat YABBY genes are more closely related to those in monocot plants and have no collinearity relationship with dicotyledonous plants, further indicating that monocotyledonous and dicotyledonous species diverged functionally during evolution. Wheat YABBY TFs in the same group shared similar gene structures with each other and contained highly conserved domains, indicating that they have similar functions. Among the motifs, 1, 2, 3, and 4 were found in all wheat YABBY members, and each of them contained only six or seven exons, further indicating that they have similar functions.
Studies have shown that YABBY plays a role in plant growth and development, including floral organ development (Murai, 2013), leaf development (Ohmori et al., 2011), and lateral organ development (Sarojam et al., 2010). In wheat, TaDL (TaYABBY4A in this study) has been shown to regulate pistil specification (Murai, 2013); while overexpression of TaYAB1 in Arabidopsis affects the formation of leaf adaxial polarity (Zhao et al., 2006); and overexpression of TaYAB2 (TaYABBY6A in this study) in Arabidopsis causes adaxial epidermis abaxialization (Zhao et al., 2012). Compared with other studies in rice and Arabidopsis, the phylogenetically related members share conserved functions, for example, CRC members are functionally conserved in the development of floral organs (Ohmori et al., 2011; Villanueva et al., 1999; Yamaguchi et al., 2004). In this study, qRT-PCR analysis showed that all TaYABBY genes were highly expressed in leaf tissue, and some gene were highly expressed in spikes. It is evident that YABBY genes play an important role in plant growth and development.
YABBY genes also play a role in plant responses to abiotic stresses. For example, overexpression of pineapple AcYABBY4 in Arabidopsis results in sensitivity to salt (Li & Li, 2019), and overexpression of soybean GmYABBY10 results in sensitivity to drought, salt, and abscisic acid (ABA) (Zhao et al., 2017). In this study, expression profiles showed that the expression patterns of TaYABBY genes were up- and down-regulated under abiotic stresses, especially in response to salt stress. Moreover, qRT-PCR analysis showed that all TaYABBY genes were induced by salinity and were significantly regulated. These results suggest that TaYABBY genes play vital roles in plant responses to abiotic stress, especially salt stress, further indicating that the expression levels of TaYABBY genes are altered by abiotic stress.