

Abstract
The diagnosis of liver fibrosis using an ultrasound B-mode image has the advantages of real-time observation and noninvasive properties. We proposed a multi-Rayleigh model to express a probability density function (PDF) of echo envelope from a fibrotic liver. By using the multi-Rayleigh model, fibrotic parameters can be estimated. To quantitatively evaluate liver fibrosis using the multi-Rayleigh model, it is important to establish a high estimation accuracy method of multi-Rayleigh model parameters for clinical data. In this paper, by using the simulated ultrasound B-mode image, the relationship between the moments of echo data as input parameters for the evaluation of liver fibrosis based on the multi-Rayleigh model and the estimation accuracy of the multi-Rayleigh model parameters was examined. From the simulation results, we can determine the optimal combination of moments that can improve the estimation accuracy of the multi-Rayleigh model by focusing on the distribution of estimated values in the multi-Rayleigh model parameters' space.
Export citation and abstract BibTeX RIS
1. Introduction
The ultrasound imaging for liver fibrosis is a real-time and noninvasive diagnostic method, compared with other imaging modalities, such as computed tomography or magnetic resonance imaging.1) However, a high level of skill and experience is needed for an operator to read the image accurately; therefore, in the clinical diagnosis of liver fibrosis, a quantitative diagnosis method is required.
We have examined the methods for analyzing an echo envelope to realize the quantitative evaluation of liver fibrosis as a series of "quantitative diagnostic ultrasound" studies. We measured the acoustical property of liver tissue accurately2–4) and developed a tissue structure model to investigate the relationship between the progress of liver fibrosis and ultrasound images.5–7) A method of quantifying the stage of diffuse liver disease has been demonstrated8–11) and the quantitative evaluation of the degree of liver fibrosis has been examined.12–19)
To evaluate liver fibrosis quantitatively, analyzing the probability density function (PDF) of the echo envelope is effective.20–25) In a previous study, we proposed a multi-Rayleigh model to express a PDF of echo envelope from liver fibrosis and proposed a probability imaging method of tissue characteristics on the basis of the multi-Rayleigh model.26–28)
The multi-Rayleigh distribution model enabled us to extract the fibrosis parameters from the B-mode image. Because the parameters of the multi-Rayleigh model are directly related to the liver fibrosis parameters [fibrotic mixture rate Rm and fibrosis progressive ratio (variance ratio) Rv], a high estimation accuracy of multi-Rayleigh model parameters is important to evaluate the liver fibrosis quantitatively. To estimate the multi-Rayleigh model parameters, moments of the echo envelope of the clinical B-mode image are used as input parameters. Multi-Rayleigh model parameters are numerically solved as the inverse problem from several moments; therefore, the combination of moments used in the estimation algorithm affects the estimation accuracy of multi-Rayleigh model parameters.
The main purpose of this study is to determine the optimal input moments to realize a high estimation accuracy of multi-Rayleigh model parameters. In this paper, examination results for the multi-Rayleigh model with two components and its estimation method using moments are presented. In the estimation method, moments are analytically calculated for each set of multi-Rayleigh model parameters to prepare a look-up table. Then, by using the simulated ultrasound B-mode image, the relationship between the input parameters for the evaluation of liver fibrosis based on the multi-Rayleigh model and the estimation accuracy of the multi-Rayleigh model parameters was examined. Finally, we can determine the moments that cause a high estimation accuracy by using the distribution area in the multi-Rayleigh model parameters' space.
2. Evaluation method for liver fibrosis based on multi-Rayleigh model
2.1. Multi-Rayleigh model
When many scattered points are distributed randomly and homogeneously, such as in normal liver tissue, the PDF of the echo amplitude can be approximated by a Rayleigh distribution. The Rayleigh distribution is given by
where x and σ2 are the echo amplitude and the variance of the echo amplitude, respectively.
On the other hand, in an inhomogeneous medium, such as a fibrotic liver, the PDF of the echo amplitude deviates from the Rayleigh distribution. It is considered that a fibrotic liver is composed of various types of tissue, such as normal and fibrotic tissues. We proposed a multi-Rayleigh distribution model that is a combination of Rayleigh distributions with different variances.
The multi-Rayleigh model with two components24) is given by

where plow(x) is the Rayleigh distribution with a low variance (normal tissue),  , and phigh(x) is the Rayleigh distribution with a high variance (fibrotic tissue),
  . Rm is a mixture rate of Rayleigh distributions with high variances. By approximating the PDF of echo envelope using the multi-Rayleigh model, the fibrotic mixture rate Rm, which is an indicator of the amount of fibrotic tissue, and the fibrotic variance ratio
  , which is an indicator of the fibrosis progressive ratio, can be estimated.28)
2.2. Estimation method of multi-Rayleigh model
Because the multi-Rayleigh model with two components has two degrees of freedom, model parameters can be estimated by using the combination of two moments. Moments are indicators of the shape of the PDF. The n-th moment around the average value, Mn, for normalized echo envelope is calculated as
where x is the echo amplitude. μ and σ are the average value and the standard variance of the echo amplitude, respectively.
We present the estimation procedure. First, the echo amplitude x is normalized such that the power of echo signals becomes 1. Then, two moments (Mn1 and Mn2) of normalized echo amplitudes are calculated, and the multi-Rayleigh model parameters  are obtained by resolving reversely a look-up table of moments-model parameters. A look-up table contains the n-th order moments of the multi-Rayleigh model, pmix2(x), with various model parameters,
  . The n-th order moments are calculated numerically by changing Rm (from 0.05 to 0.7 by 0.001) and Rv (from 1.2 to 8 by 0.01). By resolving reversely this look-up table, the model parameters
  can be calculated stably at high speed. The order n was changed from 0.05 to 3 in steps of 0.05. When the moment is larger than order 3, even a slight deviation at high amplitude causes a large change in the moments.28) Thus, the upper limit of moment order was set to 3. The moment orders in which the relationship between the moment values and the model parameters does not satisfiy a one-to-one relation were exclued. When moment values (Mn1 and Mn2) and model parameters
  satisfy the one-to-one relation, a stable estimation of the inverse problem can be achieved.
Figure 1 shows an example of parameter estimation. Using echo image simulation with the setting model parameters  , PDF of echo data was obtained, as shown in Fig. 1(a). From the echo data, arbitrary order moments of data can be calculated. If the selected moments are 0.15th and 1.5th moments, M0.15 and M1.5 are calculated to be 0.860 and 0.477, respectively, as shown in Fig. 1(a). Figure 1(b) shows the relationship between (0.15th, 1.5th) moments pair and model parameters
  . This relationship can be obtained numerically by using Eqs. (2) and (3). In this figure, the red line and blue dotted line correspond to the fibrotic mixture rate and variance ratio contours, respectively. The crossing point at M0.15 = 0.860 and M1.5 = 0.477 is plotted in Fig. 1(b). Then, we can estimate the parameters by resolving reversely the look-up table. In the look-up table, we can find the setting value whose distance between the theoretical moments and the moments of echo data is minimum and that of the setting value is estimated as the model parameters. In this case, the estimated model parameters
  are
are  . The two components in the estimated multi-Rayleigh model are shown in Fig. 1(c).
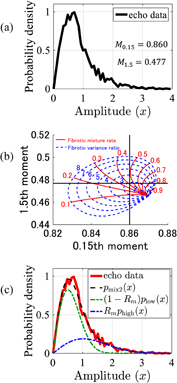
Fig. 1. (a) Probability density function of echo data. (b) Relationship between moments (0.15th and 1.5th orders) and fibrotic parameters calculated theoretically. (c) Estimation result of parameters.
Download figure:
Standard image High-resolution imageFigure 2 shows the relationship between the (0.25th, 2.75th) moments pair and model parameters  . The red line and blue dotted line correspond to the fibrotic mixture rate and variance ratio contours, respectively. In this figure, the model parameters' coordinate is folded over and overlaps in the moments' plane. Using this moments pair, it is impossible to uniquely determine the model parameters. This moments pair was excluded from the look-up table to solve the inverse problem. Similar moment pairs that do not satisfy a one-to-one relation with model parameters were also excluded from the look-up table in advance. Using this look-up table, a stable estimation of the inverse problem can be achieved.
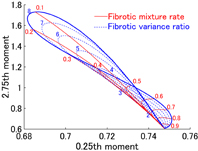
Fig. 2. Overlapping moment map (0.25th and 2.75th moments).
Download figure:
Standard image High-resolution imageMoments of echo envelope are used to estimate the multi-Rayleigh model parameters, and clinical data moments have statistical variation. The statistical variation causes the variation of estimation results.29) The estimation variation depends on the combination of input moments; therefore, the combination of moments used in the estimation algorithm affects the estimation accuracy of multi-Rayleigh model parameters. Thus, the selection of the optimal combination of moments is important to estimate the multi-Rayleigh model parameters stably.
3. Relationship between statistics of ultrasound echo envelope and the estimation accuracy of multi-Rayleigh model parameters
By using the ultrasonic simulation, the relationship between the statistics of ultrasound echo envelope and the estimation accuracy of multi-Rayleigh model parameters is studied.
3.1. Ultrasonic simulation
From the scatterer distribution model, an ultrasound image was calculated using Field II, which is a tool for ultrasonic simulation.30,31) The scattered points are distributed randomly and the scattered density is set to be 11 points per point spread function (PSF). The scatterer distribution model was located 10 to 40 mm from the transducer. The center frequency was 7.5 MHz. The focal position was moved dynamically from 5 to 80 mm at 1 mm intervals to realize a uniform ultrasonic beam width in an image; therefore, the effect of beam width on the quantitative estimation of liver fibrosis can be ignored.32) The lateral size of the scatterer distribution model was 15 mm. The B-mode images of normal and fibrotic tissues shown in Figs. 3(a) and 3(b), respectively, can be made by changing the reflection strength of the scatterer. The B-mode image of the tissue model which has a multi-Rayleigh distribution with two components, can be made by combining the normal and fibrotic tissues marked with a red frame. The result is shown in Fig. 3(c). The size of the red frame is determined by the fibrotic mixture rate. The mixture rate and variance ratio in Fig. 3(c) are 0.3 and 3, respectively.
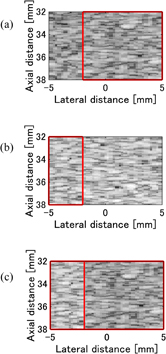
Fig. 3. (a) Normal tissue. (b) Fibrotic tissue. (c) Tissue model with multi-Rayleigh distribution.
Download figure:
Standard image High-resolution image3.2. Evaluation of estimation accuracy of multi-Rayleigh model parameters
To improve the estimation accuracy of the multi-Rayleigh model, we try to determine the input moments by focusing on the distribution in the multi-Rayleigh model parameters' space.
Figure 4(i) shows the distribution of two different moments of echo envelopes, the PDF of which can be approximated using the multi-Rayleigh model with the setting model parameters (Rm = 0.3, Rv = 3). In this figure, the red line and blue dotted line correspond to the fibrotic mixture rate and variance ratio contours, respectively. Each red dot in the figure is plotted using one B-mode image. The trial of B-mode simulation was iterated 1000 times. The 1000 B-mode images following the multi-Rayleigh model with two components were made, and 1000 points are plotted in Fig. 4(i) using the calculated moments of echo PDF as a scatter diagram. The boundary of the area, which statistically contains 95% of the data, is shown in black. The black boundary is converted into the multi-Rayleigh model parameters' space as shown in Fig. 4(ii). The distribution area of the multi-Rayleigh model parameters' space is different with different combinations of moments. When the distribution area shown in Fig. 4(ii) becomes smaller, the estimation accuracy of the multi-Rayleigh model parameters becomes higher; therefore, we should choose the combination whose distribution area of the multi-Rayleigh model parameters' space is small. To determine the optimal input parameters that have high estimation accuracy, the deviation of mixture rate and variance ratio with different combinations of two moments  ,
,  , are calculated.
  is given as
where Rm and Rv are those of setting values, respectively. Rm,max and Rm,min are the maximum and minimum values of estimated mixture rate on the projected contour in Fig. 4(ii), respectively. Rv,max and Rv,min are the maximum and minimum values of estimated variance ratio, respectively. A small U value means a high estimation accuracy.
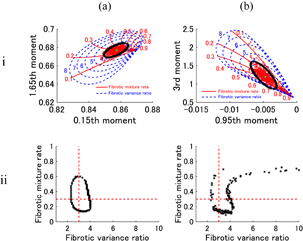
Fig. 4. (i) Moment map. (ii) Projection of contour line. (a) 0.15th and 1.65th moments. (b) 0.95th and 3rd moments. Setting model parameters (Rm = 0.3, Rv = 3.0).
Download figure:
Standard image High-resolution imageTo determine the optimal combination of moments,  , for different combinations of two moments, m1 and m2, the orders of which were set from 0.05 to 3 at 0.05 intervals, were calculated. As mentioned in Sect. 2, the upper limit of moment order for stable estimation was determined to be 3 using preliminary results. The results are shown in Fig. 5 when Rm = 0.3, Rv = 3. The minimum and maximum values of U in Fig. 5 are marked with a circle and a cross, respectively. The combinations of moments that cannot determine the multi-Rayleigh model parameters uniquely are excluded. The excluded area is shown with a white color in Fig. 5. We can see that the estimation accuracy is higher when
  is smaller; therefore, the combination moments m1 and m2 with high estimation accuracy can be determined by the smallest
  . Results in Fig. 5 show that the multi-Rayleigh model parameters can be estimated with the highest estimation accuracy by using the 0.15th and 1.65th moments (open circle). By using the 0.95th and 3rd moments (cross mark), the multi-Rayleigh model parameters can be estimated with the lowest estimation accuracy. Figures 4(ii)-(a) and 4(ii)-(b) are the figures for the highest and lowest cases, respectively.
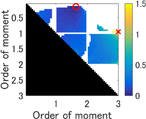
Fig. 5. Range of fibrotic parameters with setting model parameters (Rm = 0.3, Rv = 3.0).
Download figure:
Standard image High-resolution imageIn previous studies, we used the 1st and 3rd moments around zero for the estimation of multi-Rayleigh model parameters. Figure 6 shows the comparison between the highest (a), the lowest (b), and the previous (c) estimation cases. Figure 6(a)(iii) shows the histogram of fibrotic parameters estimated using the 0.15th and 1.65th moments. To compare with the results shown in Figs. 6(b) and 6(c), the histogram of fibrotic parameters estimated using the 0.95th and 3rd moments and that using the 1st and 3rd moments around zero, which have worse concentration, are shown in Figs. 6(b) and 6(c), respectively. From these results, we can see that the multi-Rayleigh model parameters can be estimated with the highest estimation accuracy by using the 0.15th and 1.65th moments when Rm = 0.3, Rv = 3.
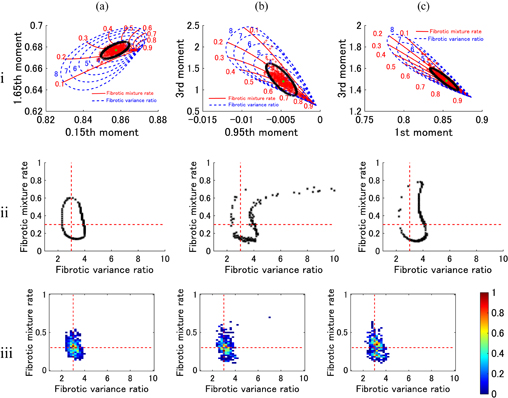
Fig. 6. (i) Moment map. (ii) Projection of contour line. (iii) Histogram of fibrotic parameters estimated using (a) 0.15th and 1.65th moments and (b) 0.95th and 3rd moments. (c) Previous combination (1st and 3rd moments around zero). Setting model parameters (Rm = 0.3, Rv = 3.0).
Download figure:
Standard image High-resolution image4. Discussion
Figure 5 shows the deviation of fibrotic parameters with the setting model parameters (Rm = 0.3, Rv = 3). To further study the relationship between the input parameters for the evaluation of liver fibrosis based on the multi-Rayleigh model and the estimation accuracy of the multi-Rayleigh model parameters, we calculated  for different combinations with the setting value
  of
of  . The results are shown in Figs. 7 and 8. Figure 7 shows that the multi-Rayleigh model parameters can be estimated with the highest estimation accuracy by using the 0.2th and 1.15th moments (open circle). By using the 0.95th and 2.95th moments (cross mark), the multi-Rayleigh model parameters can be estimated with the lowest estimation accuracy. The combinations of moments that cannot determine the multi-Rayleigh model parameters uniquely are excluded as shown with the white-colored area. These optimal input moments are slightly different from those for Rm = 0.3, Rv = 3. In Fig. 8, the estimation results of the multi-Rayleigh model parameters are compared in cases of the highest (a), the lowest (b), and the previous (c) estimations. The shape of the projected error contours in the multi-Rayleigh model parameters' space in Fig. 8(ii) is different from that in Fig. 6(ii).
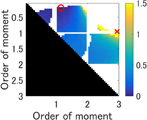
Fig. 7. Range of fibrotic parameters with setting model parameters (Rm = 0.4, Rv = 5.0).
Download figure:
Standard image High-resolution image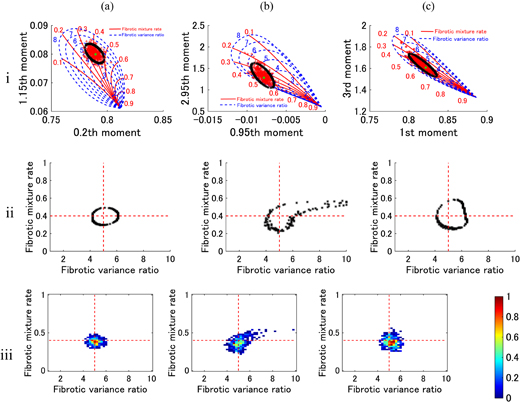
Fig. 8. (i) Moment map. (ii) Projection of contour line. (iii) Histogram of fibrotic parameters estimated using (a) 0.2th and 1.15th moments and (b) 0.95th and 2.95th moments. (c) Previous combination (1st and 3rd moments around zero). Setting model parameters (Rm = 0.4, Rv = 5.0).
Download figure:
Standard image High-resolution imageWe evaluate the optimal input moment using the same simulation with the mixture rate Rm that was set from 0.1 to 0.5 at 0.1 intervals and the variance ratio Rv that was set from 3 to 6 at 0.5 intervals. Figure 9 shows the evaluation results. The minimum and maximum values of U in Fig. 9 are marked with a circle and a cross, respectively. The combinations of moments, which cannot determine the multi-Rayleigh model parameters uniquely, are excluded as shown with the white-colored area. Optimal input moments change while Rm and Rv change. Figure 10 shows the distribution of moments combination,  , where U is the minimum with setting values
  in Fig. 9. From Fig. 10, we found that the optimal input moment in Fig. 9 generally concentrates in the range of Rm greater than 0.2; therefore, we can determine the moments that have high estimation accuracy in the range of Rm greater than 0.2. Rm and Rv values are determined by disease stage. A small Rm value means an early stage of fibrosis. It is important to realize high estimation accuracy in the early stage of fibrosis. However, it is not easy to determine the optimal input moments at a very early stage of fibrosis from the Fig. 10(a) result. Furthermore, the evaluation of the optimal input moments is limited for the multi-Rayleigh model with two components. Further investigation is required.
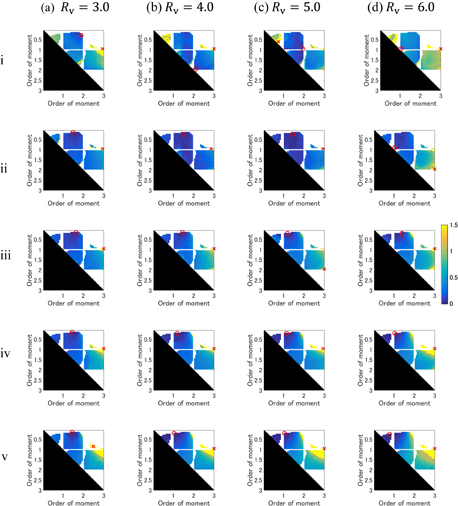
Fig. 9. Optimal input moments evaluation. The setting fibrotic parameters,  , are (i–v) Rm = 0.1, 0.2, 0.3, 0.4, 0.5 and (a–d) Rv = 3.0, 4.0, 5.0, 6.0.
Download figure:
Standard image High-resolution image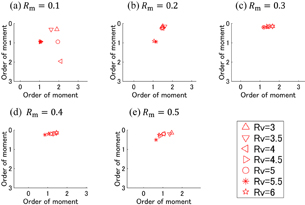
Fig. 10. Distribution of minimum in Fig. 9. The setting fibrotic mixture rates are (a–e) Rm = 0.1, 0.2, 0.3, 0.4, 0.5.
Download figure:
Standard image High-resolution image
5. Conclusions
In this study, by using the simulated ultrasound B-mode image, the relationship between the input parameters for the evaluation of liver fibrosis based on the multi-Rayleigh model with two components and the estimation accuracy of the multi-Rayleigh model parameters was examined. From the simulation results, we can determine the input moments that cause high estimation accuracy by using the distribution area in the multi-Rayleigh model parameters' space. We concluded that the optimal input parameters for the estimation of the multi-Rayleigh model parameters with high estimation accuracy can be determined at other than the very early stage of fibrosis.
Acknowledgment
This work was supported by JSPS KAKENHI Grant Numbers JP25282153, JP17H02108.