

Abstract
In this work, we analyzed the discharge process and optical emission spectra from the microarc discharges operated in three types of highly conductive liquids: artificial seawater with 10 main components, reference solutions each containing a single component, and a standard Fe solution. Microarc discharges were operated at a low breakdown voltage (below 600 V) using a needle-to-plate electrode system immersed in each liquid in a quartz cuvette. Optical emission spectra were collected from discharges ignited in each liquid. Owing to the complex composition of seawater, spectra from discharges in different liquids were compared to assign the emission peaks. The proposed method showed good potential for the detection of Fe and other metals in seawater. Using the present setup, it was possible to detect Fe impurities at a concentration of 300 ppm. The possibility of using atomic emission spectroscopy of microarc discharges in seawater for on-site elemental composition analysis has been demonstrated.
Export citation and abstract BibTeX RIS
1. Introduction
In recent years, there is continuous contamination of available marine resources with industrial and biochemical pollutants from various sources, which leads to issues of pollution control and ecological monitoring. On the other hand, with the growing needs in industrial resources there is significant interest in new sources of materials that can meet the growing demands for materials. The problem of limited availability of resources for industry can be solved partially by using marine resources and underwater deposits.1,2) However, owing to the huge amount of water under various conditions (e.g., elemental composition, temperature, pressure, electrical conductivity), ecological and pollution monitoring, elemental composition analysis, and exploration of underwater deposits are still challenging.3–7) Commonly used techniques for water quality assessment and composition analysis require liquid sampling, sample transport, sample preparation, and laboratory analysis at specialized locations. There are many laboratory methods of determining of the composition of seawater, such as UV absorption spectroscopy of the water and plasma spectroscopy.3–12) In the case of UV absorption spectroscopy, analysis is even more complicated owing to the necessity of fitting and processing absorption spectra and analysis of the reference solutions in order to identify elements.13) In the case of plasma spectroscopy, commonly, water samples are sprayed into various types of plasma, and optical emission or absorption spectroscopy is carried out to determine the elemental composition of water and the quantity of impurities.4,7,8,14–17) The necessity of sampling, high power consumption, and large equipment (depending on the accuracy of measurements, the sizes of laboratory devices can vary from a table top to a room) make the analysis of deep seawater using the above-mentioned methods complicated, long and costly. Considering these problems, a perfect solution will be the development of diagnostic tools that enable rapid on-site elemental composition monitoring and contaminant detection.12,18–21)
One of the possible ways of detecting impurities in water is the spectral analysis of different types of plasmas generated in the water examined. In this case, if plasma could be generated and analyzed in a liquid, there would be no need for sampling and transport of samples, which could hasten measurements and reduce the cost.17,19,20,22) However, stable generation of plasmas in liquids under various conditions (especially in highly conductive and chemically active seawater) is still challenging.19,23) Plasmas that come in contact with and in dielectric and low-conductivity liquids have been studied extensively and are already used in various applications, such as water treatment, plasma medicine, and nanoparticle formation.13,24–26) However, in the case of highly conductive seawater, the operation of reproducible plasma discharges directly in liquid is extremely difficult. One of the reasons for that is the mechanism of plasma generation in a highly conductive liquid. Because of a high conductivity, applied voltage produces high currents through the liquid resulting in rapid boiling and bubble formation. Upon the formation of bubbles, plasma is generated in a gaseous medium.19,27–35) Conventional systems for generating plasma discharges in water require high voltages (1–100 kV), which makes on-site measurements problematic owing to the necessity of using a high voltage power supply and complex control units.36–38) One of the ways to solve this problem is to use microplasma discharges; this enables the operation of discharges using breakdown voltages below 1 kV, which may be considered a low-voltage discharge.
There are many ways to generate microplasma discharges in highly conductive liquids, where the liquid is used as the electrode, such as a liquid electrode plasma (LEP). Moreover, there already are designed prototypes of on-chip devices for compositional analysis and impurity detection.6,11,20,21,39,40) However, in approaches using a liquid electrode, a microchannel system is commonly used to form the microplasma. The use of microchannels has limitations in the adjustment of the discharge gap and problems with the generation of microplasmas at a high pressure (deep sea) and in water with variable conductivity. The above-mentioned problems could be solved by the use of electrode systems with microgaps controlled by a precise micromanipulator. Recent research shows that in the case of microgaps, plasma discharges can be reproducibly ignited in different conductive liquids by applying low voltages (less than 1 kV) to the electrodes. Microplasmas generated using low voltages could potentially be applied to on-site measurements in seawater and elemental composition analysis.19,23,33) For that purpose, atomic emission spectroscopy of short (1–100 µs) microplasma discharges is highly promising, owing to its low energy consumption and simple discharge setup.5,19,21) Moreover, the utilization of microarc discharges is potentially useful for on-site analysis of deep seawater (depth of 1 km and more), owing to the increase in the optical emission intensity of arc discharges with increasing pressure.41)
In this study, the applicability of optical emission spectroscopy (OES) of microarc discharges in liquids to the on-site elemental composition analysis of seawater and detection of metal impurities was investigated. In the present experiments, Fe was used as the target of detection because of its strong optical emission and the wide commercial availability of reference solutions with Fe. A method developed for detecting Fe in seawater could be used for the exploration of underwater Fe deposits. Moreover, the detection of trace amounts of Fe in seawater is an important topic owing to numerous marine biochemical studies being conducted, such as those on growth of phytoplankton, chlorophyll production, and nutrition of marine microorganisms.42–44) Investigation of the measured optical emission spectra confirmed that the proposed method is applicable to the composition analysis and detection of Fe and other metals with strong optical emissions (such as rare metals).
2. Experimental methods
Three types of liquid were used for the experiments: artificial seawater composed of 10 main components (10ASW, elemental composition shown in Table I), reference solutions of each of the main components (1 M NaCl, 1 M MgCl2+H2O, 1 M Na2SO4, 1 M CaCl2, 1 M KCl, 1 M NaHCO3, 1 M KBr, 1 M NaHCO3, 1 M H3BO3, 1 M SrCl2+H2O, 0.1 M NaF, 0.1 M HCl, and 0.25 M NaOH) and standard 1000 ppm Fe solution [Wako JCJ9591, Fe(NO3)3 in 0.1 M HNO3].
Table I. Elemental composition of 10ASW in grams for 1 kg of water.
| Ingredient | Mass (g) |
|---|---|
| NaCl | 23.939 |
| MgCl2+6H2O | 10.849 |
| Na2SO4 | 3.994 |
| CaCl2 | 1.123 |
| KCl | 0.667 |
| NaHCO3 | 0.196 |
| KBr | 0.098 |
| H3BO3 | 0.027 |
| SrCl2+H2O | 0.004 |
| NaF | 0.003 |
Microarc discharges were operated using a needle-to-plane electrode system placed in a quartz cuvette with a microgap precisely controlled using a micromanipulator. The experimental setup is shown in Fig. 1. In the present experiments, the gap length was set at 200 µm, and a tungsten (W) needle with a tip radius of 100 µm and a polished W plate were used as the electrodes. The liquid to be examined was introduced in the quartz cuvette with a final depth of 2 mm, considering the surface tension effect.
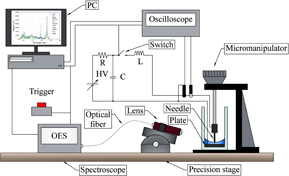
Fig. 1. Experimental setup.
Download figure:
Standard image High-resolution imageA pulse current source, consisting of a capacitor (C = 220 or 440 nF), an inductor (L = 67 µH), and a MOSFET switch, which is the impulse generator circuit, was used to supply the discharge. The capacitor was charged through a resistor by a regulated DC power supply to a final voltage of 750 V. The circuit generated a single pulse with current and voltage waveforms that depended on the parameters C, L, and resistance (R) of the liquid between the electrodes. The voltage and current waveforms were stored in a digital oscilloscope using a high-voltage probe and a current probe (IWATSU-LeCroy AP015).
The optical emission spectra from the plasma were collected using a quartz UV lens (mid size collimator 88–181 and focus guide 88–186; Fiberguide Industries Limited) and recorded using a multichannel spectrometer (Ocean Optics USB4000; measurement range 200–850 nm; optical resolution 1.34 nm) through a quartz optical fiber (Ocean Optics P400-1-SR; core diameter 400 µm). The lens was carefully arranged using a precision stage to focus in the microgap between the electrodes. The spectrometer was calibrated to evaluate absolute spectral irradiance in µW/cm2/nm at the entrance of a quartz fiber (after focusing) using a standard light source (deep-UV deuterium and tungsten halogen light source; Ocean Optics DH-2000-DUV). Discharges were manually operated using a push switch shot by shot at sufficient intervals such as 30 s. The exposure of the spectrometer was set at 8 ms and synchronized to the trigger of discharges for the accumulation of emission for the entire microarc discharge in each shot.
3. Results and discussion
Typical current and voltage waveforms for microarc discharges in 10ASW operated using 220 and 440 nF capacitors charged to 750 V (all other conditions were the same) are shown in Figs. 2(a) and 2(b), respectively. The discharge process can be separated into three phases: the (1) preheating phase, (2) microplasma discharge, and (3) following oscillation due to reversed charge on the capacitor.

Download figure:
Standard image High-resolution image
Download figure:
Standard image High-resolution image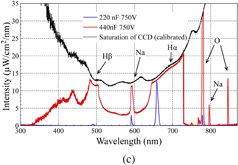
Fig. 2. Typical current and voltage waveforms for microarc discharges operated in 10ASW using (a) 220 nF capacitor and (b) 440 nF capacitor, and (c) optical emission spectra for 220 and 440 nF cases.
Download figure:
Standard image High-resolution imageDuring the preheating phase, liquid in the discharge gap and its surroundings was heated by the electric current between the electrodes, resulting in local boiling and bubble formation. After the preheating phase, the discharge gap was filled by vapor, resulting in the electrical breakdown and plasma generation in a gaseous medium. More detailed study of the discharge generation process under such conditions is presented in Ref. 23. The oscillation phase after the termination of the microplasma discharge does not have any potential application and was not precisely studied in the present work.
One of the important requirements for the application of microarcs in OES measurements and elemental composition analysis is the control of discharge duration and optical emission intensity. From the current and voltage waveforms of discharges operated using 220 and 440 nF capacitors, it can be noted that capacitance has a strong effect on discharge duration. This effect can be explained by the amount of energy stored in the capacitor at the start of the microplasma discharge. In the case the of the 440 nF capacitor, compared with that of 220 nF, a larger amount of energy stored in the capacitor at the end of the preheating phase enabled the increase in the duration of the microarc discharge from 10 to 15 µs and peak current from 12 to 21 A.
From the emission spectra, as shown in Fig. 2(c), it can be observed that the duration of the microplasma discharge and peak current causes significant differences in the measured optical emission spectra. In the case of the 220 nF capacitor, the duration of the microplasma discharge and peak current were 10 µs and 12 A, respectively, and, as a result, only four peaks (Hα, Hβ, Na, and O) with relatively low intensity are observed in the spectrum. For assigning the emission peaks, the NIST atomic spectra line database was used.45) However, in the case of the 440 nF capacitor, the discharge duration and peak current were increased to 16 µs and 21 A, respectively, resulting in a significant increase in emission intensity. The intensity of the dominant peaks exceeded the saturation level of the CCD detector of the spectrometer. The wavelength dependence of sensitivity was calibrated, resulting in the curvature of saturation level. In addition, new emission peaks appeared, which were not detected previously. It is challenging to assign emission peaks in the region below 750 nm owing to the intensity of continuum emission, occasional saturation, significant noise, and numerous emission peaks from W and seawater. In the region greater than 750 nm, however, because of the longer duration of discharge with higher intensity when using the 440 nF capacitor, it becomes possible to observe some sharp emission peaks. Those peaks are not affected by continuum emission nor surrounded by a large number of very close emission peaks, which could be used for elemental analysis.
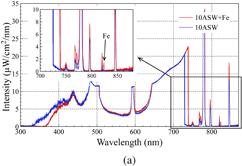
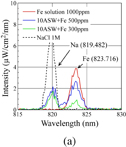
The optical emission spectra for microplasma discharges in 10ASW and a mixture of 10ASW with the standard Fe solution (the resulting concentration of Fe was 500 ppm) are shown in Fig. 3(a). It can be observed that in the case of the solution with Fe, an additional peak appeared in the spectrum at 823 nm, which was not observed in 10ASW. A small difference can be observed in the current and voltage waveforms [Fig. 3(b)] between these discharges. It can be assumed that the difference in discharge characteristic is related to an insignificant change in electrical conductivity upon the addition of Fe solution to 10ASW. Despite the small difference in discharge duration, the total energy delivered to the microplasma may be considered approximately the same owing to the small amount of current remaining at the end of the discharge. Moreover, similar shapes of the Hα and Hβ emission peaks confirm approximately the same plasma parameters for microarcs generated in 10ASW and the mixture of 10ASW and a Fe solution. Considering these similar plasma parameters, it can be concluded that the emission peak at 823 nm originates from Fe in the solution and can be assigned as Fe [823.716 nm, transition from level 3d6(5D)5s to level 3d6(5D)5p].
Download figure:
Standard image High-resolution image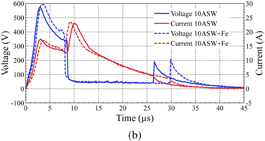
Fig. 3. (a) Optical emission spectra and (b) current and voltage waveforms for discharges operated in 10ASW and mixture of 10ASW and standard Fe solution.
Download figure:
Standard image High-resolution imageTo examine the detection limit of Fe concentration in the present system, discharges were operated in the mixtures of 10ASW and standard Fe solutions of different concentrations (200, 300, 500, and 1000 ppm of Fe). The enlarged spectra for the solutions with different concentrations of Fe are shown in Fig. 4(a). Moreover, to confirm the assignment of the emission peak at 819 nm, the emission spectra of the NaCl reference solution is added to Fig. 4(a) as an example. Considering the observation that the emission peak at 819 nm appeared only in solutions that contained Na, the peak can clearly be assigned to Na (819.482 nm).
Download figure:
Standard image High-resolution image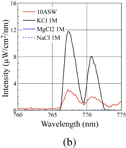
Fig. 4. Optical emission spectra of microarc discharges generated in (a) solutions with various concentrations of Fe for defining detection limit and (b) reference solutions for assigning emission peaks.
Download figure:
Standard image High-resolution image
For the comparison of OES measurements at different Fe concentrations, owing to some instabilities of discharges with variation of the measured optical emission intensity, the similarity of clearly identified peaks, such as Na (819.482 nm), Hα, and Hβ, was confirmed. In the spectra, a strong correlation of the Fe emission peak (823.716 nm) intensity with the Fe concentration in solutions was observed. The Fe emission intensity was maximum in the standard Fe solution (1000 ppm) without 10ASW. The Fe emission intensity gradually decreased with decreasing concentration of Fe from 500 to 300 ppm. However, it can be noted that the Fe peak intensity was not proportional to the concentration of Fe. Despite choosing spectra with similar intensities and shapes of well-assigned peaks, it was challenging to find spectra with exactly the same intensity of all emission peaks except for Fe. This noted problem causes variations of the intensity of the Fe emission peak, which makes concentration analysis challenging and limits the present setup to impurity-detection applications. With the decrease in the concentration of Fe to 200 ppm, there was no significant Fe peak appearing at the wavelength close to 823.716 nm. The emission peak for Fe at a concentration of 200 ppm was comparable to the noise level in this experiment. It can be concluded that the detection limit of Fe in seawater when using this experimental configuration is 300 ppm.
Additionally, by using the same approach as that for the Na emission peak, unidentified peaks at 767 and 771 nm could be assigned to K, owing to the observation that the emission peaks appeared only in the solutions containing K (10ASW, KCl) but not in the other solutions (MgCl2, NaCl), as shown in Fig. 4(b).
The proposed method can be used for the on-site detection of metals (such as Fe or rare metals) or other elements with high optical emission in seawater. It is possible to conduct the measurements with a simple spectroscopy setup, which appears applicable to the design of a compact system for on-site measurements. The proposed method can be potentially applied to the exploration of underwater metal deposits, because of the higher concentrations of metal ions in water close to the deposits. For precise concentration analysis, however, further improvements of plasma stability (electrode system and discharge circuit) and the optical emission measurement system (reducing the signal-to-noise ratio, improving the focusing system, use of a spectroscope with a higher resolution, time-resolved spectroscopy) are required.
4. Conclusions
In this study, the applicability of microarc discharges in seawater to water composition analysis and impurity detection was investigated. Microplasma discharges were operated in 10ASW with Fe solution as an additive using the needle-to-plate electrode system and impulse current generator. It was confirmed that reproducible microarc discharges were operated in highly conductive water using the proposed setup and that the emission intensity could be significantly increased by the optimization of experimental conditions. An emission peak corresponding to the incorporated Fe was successfully and clearly identified in the emission spectra. The intensity of the Fe peak increased with increasing Fe concentration. The detection limit in this experiment was 300 ppm. In addition, the emission peaks corresponding to the K and Na elements in 10ASW were assigned by comparing emission spectra with the spectra of reference solutions. The proposed method potentially enables the design of a compact device for on-site elemental composition analysis of seawater, owing to its simple experimental setup and small power supply.
Acknowledgments
This work was supported by JSPS KAKENHI Grant Number 26600129. 10ASW and the standard Fe solution were provided by Professor Kei Okamura of Kochi University.
Biographies

Vladislav Gamaleev received his M.Sc. degree in nanotechnologies in electronics from the Southern Federal University, Russia, in 2011. He is currently pursuing a Ph.D. degree in electrical engineering at Kochi University of Technology, Kami, Japan. His research interests include plasma generation in various liquids and plasma diagnostics by optical emission spectroscopy. Currently, he is focusing on the generation of microplasma discharges in seawater and the investigation of the elemental composition of sea water using measured optical emission spectra.

Hiroshi Furuta received his Ph.D. degree in science (physics) from Osaka University, Osaka, Japan, in 1999. In 1998, he was a JSPS Research Fellow engaged in research on porous silicon and ESR applications. In 2004, he became Lecturer at the Research Institute for Nanodevices, Kochi University of Technology, Kochi, Japan. In 2011, he was made an associate professor in the Department of Electronic and Photonic Systems Engineering, Kochi University of Technology, Kochi, Japan. His research interest includes application of carbon nanotubes, growth process of carbon nanomaterials, plasma process for thin film-technology, and metamaterials. He is a member of JSAP and FNTG.

Akimitsu Hatta received his B.E. and M.E. degrees from Kyoto University, Japan, in 1987 and 1989, respectively, and completed his doctoral program coursework at Kyoto University in 1992. From 1992 to 1998, he was an assistant professor at Osaka University. In 1996, he received his Doctor of Engineering degree from Osaka University. From 1998 to 2003 he was an associate professor at Kochi University of Technology. He is currently a professor at the School of Systems Engineering, Kochi University of Technology. His research subjects include gas discharge and plasma application to material syntheses, ultraviolet light source, and spectroscopic analysis. He is also engaged in Energy and Environmental Education. He is a member of JSAP, IEEJ, IEIJ, IESJ, and JAEEE.