
Abstract
In this article, we review the development of scientific instruments for obtaining information on the evolution of physical properties and chemical species of solution plasma (SP). When a pulsed high voltage is applied between electrodes immersed in an aqueous solution, SP is formed in water vapor bubbles transiently generated in the solution under atmospheric pressure. To clarify how SP emerges in water vapor bubbles and is sustained in solutions, an instrument with micrometer spatial resolution and nanosecond temporal resolution is required. To meet these requirements, a microscopic system with a custom-made optical discharge cell was newly developed, where the working distance between the SP and the microscopic objective lens was minimized. A hollow electrode equipped in the discharge cell also enabled us to control the chemical composition in water vapor bubbles. To study the spatial and temporal evolutions of chemical species in micrometer and nano- to microsecond regions, a streak camera with a spectrometer and a CCD detector with a time-gated electronic device were combined with the microscope system. The developed instrument is expected to contribute to providing a new means of developing new schemes for chemical reactions and material syntheses.
Export citation and abstract BibTeX RIS
1. Introduction
Plasmas formed in solutions under atmospheric pressure have attracted considerable attention as characteristic reaction fields.1,2) The plasma has been referred to as solution plasma (SP), which is formed by a discharge and sustained in bubbles formed in solutions.3,4) When SP is formed in aqueous solutions, it is formed in water vapor bubbles generated in the solutions. The characteristic features of SP are summarized as follows. First, the environmental pressure of SP is much higher, up to atmospheric pressure or higher, than that of other conventional plasmas, which are usually formed under low pressure ranging from about 10−3 to 1 Torr.5) In addition, the chemical composition in SP is strongly affected by that of the surrounding solution. This is because the constituent plasma gases including ions and radicals are originally generated from the vaporization from the surrounding solution. Thus, the chemical composition in the plasma gas can be changed by varying that of the surrounding solution.3) These chemical species and their derivatives are utilized as reactants in SP reaction fields. In addition, due to the atmospheric pressure of SP, the collision frequencies between transient and/or reactive particles should be much higher than those in a plasma gas formed under low pressure or vacuum. Further, collisions between the highly reactive particles formed in SP and those at interfaces between bubbles and the surrounding solution at room temperature are expected. These interfacial reactions may induce novel chemical reactions that hardly occur in the bulk. Another important feature of SP is that hot products in the plasma reaction field are released into the surrounding cold solution, namely, the SP and the surrounding solution form a highly nonequilibrium system.6,7) The temperature of the plasma generally reaches up to ∼4,000 K or higher, but that of the surrounding solution can remain at room temperature.8) Thus, the released hot products are immediately cooled in the cold solution and the reactions are suddenly quenched.3) Due to the rapid quenching process, it is expected that thermodynamically semistable products, which are difficult to synthesize under a general gradual cooling condition, can be synthesized.
To elucidate the formation and sustaining mechanisms of SP and to control its physical properties and chemical species for various applications, a new measurement instrument has been strongly desired that meets the requirements of micrometer spatial resolution and nanosecond temporal resolution.4,8) In addition, to obtain desired product molecules and materials by an SP process, it is also crucial to develop a new device that allows the injection of arbitrary gases into the SP reaction field in the bubbles formed in solutions.9)
In this article, we review the recent progress in the development of such a measurement instrument that meets the requirements for both spatial and temporal resolutions. In addition, the development of an arbitrary gas injectable system to control the chemical composition of SP sustained in water vapor bubbles in aqueous solutions is also reported.
2. Development of a new microscopic apparatus for the investigation of SP
2.1. Combination with a microscope: minimization of the working distance between SP and the microscope objective lens and enhanced throughput of UV light
As mentioned above, SP is formed in bubbles and sustained in solutions.3,4) For example, when we form SP in an aqueous solution, the SP is sustained in water vapor bubbles generated in the solution. Thus, the spatial distributions of the physical properties and chemical species of the SP in a bubble should vary in inhomogeneous environments, namely, with coexisting plasma (partially ionized gas), bubbles (gas), and surrounding solution (liquid phase). In general, the bubbles with micrometer size bridge the tips of a pair of electrodes immersed in solutions, and SP is formed and sustained in the bubbles.
To obtain information on the spatial distributions of the physical properties and chemical species of SP, microscopic observation is crucial. If we can combine a discharge cell for SP generation with a conventional microscope, various measurements will be available by combining suitable detection apparatus with the microscope such as charge-coupled device (CCD) cameras, spectrometers, and high-speed cameras. However, such an optical discharge cell system for SP is not yet commercially available. Thus, the research on SP with microscopic resolution has to start with the construction of a new optical discharge cell that allows us to observe SP images with a conventional microscope.
Figure 1 shows a schematic illustration and a photograph of our custom-made optical discharge cell combined with an objective lens. The important requirements of the system are as follows.
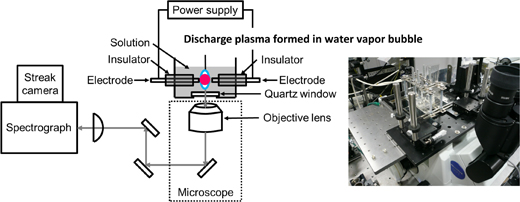
Fig. 1. Experimental setup for microscopic spectroscopy for investing SP generated in vapor bubbles formed between electrodes in solutions. The right panel shows a photograph of an optical discharge cell loaded on the stage of an inverted microscope.
Download figure:
Standard image High-resolution image(1) The working distance between the SP and the objective lens should be minimized. This allows the use of an objective lens with high numerical aperture (NA), which enables us to observe the spatial distribution of SP with higher magnification.
(2) The optical window should be transparent to UV light. This is because when SP is formed in an aqueous solution, OH radicals are abundantly formed, which are observable through the characteristic UV light emission from OH radicals. OH radicals are one of the most important intermediate chemical species, which strongly accelerate the oxidation of material surfaces and enable the efficient degradation of hazardous chemical compounds in the environment.10–12) Thus, extending the observable optical window of the light toward the UV region is important for the application of SP processing to various chemical reactions. For this purpose, the material of the interfacial window of the discharge cell was chosen as quartz.
For the magnification of the image and the connection of various types of detection instruments, the constructed optical discharge cell was loaded on an inverted microscope (Olympus IX-71, shown in the inset of Fig. 1). In addition, to enhance the throughput of the UV light in the signal, a reflection type objective lens was typically used (Newport, NA = 0.4, magnification: ×15). Mirrors in the optical pathway were also chosen to be ones that reflect UV light with high efficiency. These arrangements allow us to measure the spatial distribution and temporal changes of the OH radicals in SP reaction fields.4)
To obtain spatial images of SP reaction fields, a CCD camera (Olympus DP20) was connected to the microscope. For spectroscopic imaging, the CCD camera with enhanced sensitivity in the UV region (ANDOR DU-420BU) was connected via optical filters that pass only narrow wavelengths to image the emission only from corresponding target chemical species. As a pulsed high-voltage source, an electric power supply (Kurita Kogyo MPS-06K02C-WP1F) was used. The typical amplitude of the voltage was ca. 1 kV and the duration of the pulsed voltage was ca. 1 ms. The short duration of the applied high-voltage pulse avoids unexpected excess heating of the surrounding solution. The repetition rate of the applied high-voltage pulse was 25 kHz.
2.2. Increase in the spatial stability of SP
For measurements with fine spatial resolution, not only the combination with a microscope but also the position stability of the SP becomes crucial. Typical diameters of the cross section of the electrodes are ca. 1 mm. This size allows SP to move easily around the electrodes within a region of ms order. This is due to the kHz-order repetition rate of the applied pulsed high voltage, and the low-density bubbles formed in condensed solutions move around the tips of the electrodes due to the thermal fluctuation and the gravitational force.
For the stabilization of the spatial position of the SP, sharpening and rounding the tips of the electrodes were found to be effective. Figure 2 shows electrodes with a typical diameter and with sharpened and rounded tips. The stability of the spatial position of the SP was clearly enhanced. This allows us to accumulate the signal over 1 s and obtain clearer images of the chemicals with high spatial resolution in the SP reaction fields. The results of imaging are shown later in Sect. 3.1.
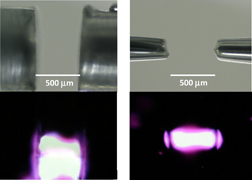
Fig. 2. Stabilization of the spatial position of SP toward achieving measurements with micrometer spatial resolution. (Left) Before the sharpening and rounding of the tips of electrodes (upper panel) and corresponding spatial fluctuation of the SP (lower panel). (Right) After the procedure.
Download figure:
Standard image High-resolution image2.3. Extending of the application of SP towards chemical reactions and material syntheses
For the application of SP to characteristic chemical reactions utilizing plasma chemistry and highly nonequilibrium conditions, it is also important to control the gas composition in the bubbles that sustain SP in solutions.13–15) To control the gas composition in an SP reaction field, we used hollow metals for the discharge electrodes. Figure 3 shows photographs of hollow-type metal electrodes (tantalum, Ta), the connection to the discharge cell via an insulator tube, and the whole system comprising the instruments. Typical dimensions of the hollow metal electrodes are 2 mm in outer diameter and 1 mm in inner diameter. The total amount of the gas and its composition are controllable by mass-flow controllers and connectors. In our system, four different gases (oxygen O2, nitrogen N2, carbon dioxide CO2, and argon Ar) can be utilized and freely mixed.9)
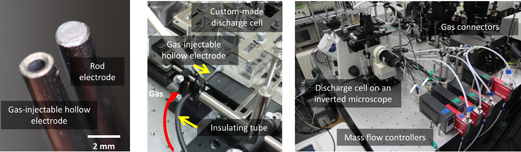
Fig. 3. Photographs of a hollow electrode (left panel), connection between the hollow electrode and the insulator tube to introduce gases into the SP reaction field (center), and the whole system with mass-flow controllers and connectors for mixing gases (left).
Download figure:
Standard image High-resolution image3. Application of the apparatus to spectroscopic analyses
3.1. Spatially resolved analysis of SP
First, images of spatial distributions of electrons, hydrogen radicals ( H), and hydroxyl radicals (OH) in SP are presented. Electrons, H, and OH are the most important and characteristic intermediate chemicals in SP generated in water vapor bubbles formed in aqueous solutions. The number density and temperature of electrons (ne and Te) are strongly related to the physical properties of the SP. H, and OH are strongly reducing and oxidizing chemicals, respectively. Chemical contrast imaging is achieved by utilizing optical narrow band-pass filters that only allow the passage of light with identical wavelengths to the chemicals that we want to measure. To investigate the effect of the electrode polarity on their spatial distributions, monopolar and bipolar discharges were tested.
The obtained images are shown in Fig. 4. Free electrons were found to be localized in the vicinity of the cathode. This result indicates that most of the electrons are generated from the cathode by collisions between the cathodic electrode and positively charged ions accelerated by the electric field applied between the electrodes, called secondary electron generation.

Fig. 4. Chemical-contrast microscopic images of the reactive species in SP. Left column, monopolar discharge (positive voltage is applied to the right electrode); center column, bipolar discharge; and right column, monopolar discharge (negative voltage applied to the right electrode). Microscopic images for reference are shown at the top of each column. The species and the observed wavelengths are shown on the left side.
Download figure:
Standard image High-resolution imageAs also shown in Fig. 4, the spatial distributions of H and OH are localized in the vicinity of the cathode, as well as the free electrons. However, the spatial distribution for H in the plasma is wider than that for OH. This result may indicate that H is more rapidly spatially dispersed than OH owing to its lighter weight. These results demonstrate that the apparatus enables us to measure the spatial distributions of radicals and free electrons formed in a discharge plasma in water vapor bubbles.4)
3.2. Time-resolved analysis of SP for controlling the physical properties of the SP reaction field
Time-resolved analysis of each species can be realized by combining the above-mentioned system with a spectrometer and a streak camera. The most important feature of SP for its application to the chemical reactions and material syntheses is its temperature. The spectral shape of a continuum emission has been explained on the basis of Planck's theory for blackbody radiation in some previous studies.16–20) It is most probable that a continuum emission results from the blackbody radiation from heated materials. It may also result from a heated bubble, similarly to Ref. 19. The chemical species in a bubble are heated by collisions with free electrons and ions accelerated by the applied electric field. Therefore, the blackbody temperature (Tb) should not exceed the electronic and ionic temperatures in the plasma. Namely, Tb should indicate the lower limit of the electronic or ionic temperatures. Here, we estimate Tb by applying Planck's theory to the time-resolved spectrum at each time delay.
The obtained temporal evolution of Tb is shown in Fig. 5. The detailed analytical procedure and experimental conditions were reported elsewhere.8) We found that Tb increases up to 7400 K within about 0.05 µs. After that, it remains between 7300 and 7600 K. The temporally resolved measurement enables us to obtain information on the energy distribution. Further, it was clarified that Tb almost reaches a steady state within 0.05 µs in SP formed in water vapor bubbles under atmospheric pressure.

Fig. 5. Temporal evolutions of the electron density (ne), blackbody temperature (Tb), H temperature (TH), and OH temperature (TOH).
Download figure:
Standard image High-resolution imageThe hydrogen radical temperature (TH) was also estimated using the intensity ratio between two different emission lines of the Balmer series.21) When the system is assumed to be thermalized, the obtained population ratio between different electronic states is expressed using the Boltzmann equation. The temporal evolution of TH was calculated with the Hβ and Hγ lines at 486 and 434 nm, respectively, at each time delay, as shown in Fig. 5. TH increases to more than 6000 K within 0.15 µs. After that, TH fluctuates between 4000 and 8000 K with an average value of 5500 K. In addition, TH changes rapidly on the timescale of nanoseconds, as shown in Fig. 5.
The temporal evolution of the hydroxyl radical temperature (TOH) was also estimated from the spectral shape of the emission band at around 310 nm. The emission spectrum exhibits fine structures owing to the rotational transitions between the electronically excited and ground states. In addition, the population distribution among the vibrational levels does not contribute to the spectral shape in the present wavelength region.22) The emission spectra of OH at 3000 to 6000 K were simulated using the reported spectrum at 3000 K by assuming the Boltzmann distribution. The simulated spectra were convoluted by the Gaussian function with a width of 0.09 nm, which corresponds to the spectral resolution of our experimental setup. Detailed simulation conditions were reported elsewhere.8) By fitting with the simulation, we found that the temporal average of TOH is about 4000–5000 K. TOH increases to 6000 K within 0.15 µs. After that, TOH, as well as TH, fluctuates between 2000 and 6000 K around an average value of 3700 K, and the fluctuation occurs on the nanosecond timescale.
To control the temperature of an SP reaction field, finding parameters that control the temperature is crucial. As mentioned above, TH and TOH fluctuate after increasing. The energies of the particles should be transferred to other particles by interparticle collisions in the SP. Therefore, the rate at which the radical temperature increases should increase as ne increases.
In Fig. 6, the time profile of ne and the first derivatives of the time profiles of TH, TOH,  , and
, and  are compared in the fluctuating stage. When ne shows local maxima or minima,
  and
and  also exhibit local maxima or minima values, respectively.
  and
and  appear to be correlated with ne. It is concluded that ne, namely, the collision frequency between the radicals and accelerated charged particles, makes a large contribution to the radical temperature. Time-resolved measurements clarified that the parameter controlling the temperature of the reactive radicals in SP is electron density.8)
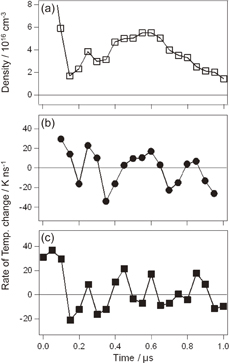
Fig. 6. Temporal evolutions of the electron density (top), the first derivative of the temporal evolution of the H temperature,  (middle), and the first derivative of the temporal evolution of the OH temperature,
  (bottom).
Download figure:
Standard image High-resolution image3.3. Arbitrary gas injection system for controlling the chemical reaction in SP
SP was successfully generated while directly injecting O2, CO2, N2, and Ar through the hollow electrodes by mass-flow controllers.9) The change in the color of SP was easily observed when other gases were introduced into the SP reaction field (Fig. 7). Unfortunately, when these gases were injected, spatial fluctuation of the SP was unavoidable due to the successive formation of bubbles between the electrodes. However, we successfully measured the optical emission spectrum from the SP by setting the focus of the objective lens in the microscope to the center of the plasma. The temporally averaged emission spectra obtained from the plasma are shown in Fig. 8.
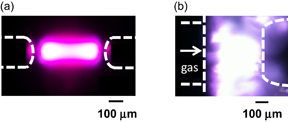
Fig. 7. Photographic images of SP. Gas is not injected (a) and CO2 is injected with a flow rate of 0.6 L min−1 (b). The dotted lines represent the positions of the electrodes.
Download figure:
Standard image High-resolution image
Fig. 8. Emission spectra from gas-injected SP. The gas species injected to the SP is indicated on the left side of each spectrum.
Download figure:
Standard image High-resolution imageAs shown in Fig. 8, several emission bands were observed in the emission spectrum in the wavelength range between 280 and 540 nm. An emission band due to OH was observed at around 310 nm, and emission bands due to H at 434 and 486 nm were commonly observed for the SP in aqueous solutions with the injection of four different gases. Interestingly, as shown in Fig. 8, several additional bands were observed when each gas was injected: bands at 390 and 420 nm for O2, at 360, 390, 430, 460, and 510 nm for CO2, at 340, 350, 380, 410, and 460 nm for N2, and at 360 and 420 nm for Ar. These bands were assigned to the emissions from transient species derived from the injected gas species.23–26) For example, the emission bands at 390 and 420 nm with the O2 injection were assigned to the triplet oxygen atom [O (3P)].23) From these results, it is concluded that the injected gas is taken into the SP reaction field, and the transient species derived from the injected gas are expected to act as the reactive species in the reaction field. A demonstration of the enhanced degradation of a dye by O2 injection is reported elsewhere.9)
3.4. Extension to separate-mode SP
Finally, we also show the recent application of the instrument to the spectroscopic analyses of separate-mode SP reaction fields. When the distance between the electrodes is increased to more than mm order, SP spatially connecting both edges of the electrodes is separated into two plasmas, localized in the vicinity of the anodic and cathodic electrodes, called-separate mode SP.27–29) A photographic image of a separate-mode SP formed by the application of a monopolar voltage is shown in Fig. 9. Despite the simultaneous discharge, the colors of the plasmas around the anode (+plasma) and cathode (−plasma) are markedly different, i.e., purple and orange, respectively. These different colors from the plasmas indicate that the physical properties and/or the chemical compositions of the two plasmas are different. We examined the electron density and the temperatures of the two plasmas separately with a microscopic time-resolved emission spectrometer.4)
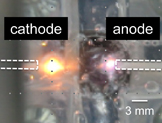
Fig. 9. Photographic image of separate-mode SP generated by applying a monopolar pulsed voltage. The dotted lines represent the positions of the electrodes.
Download figure:
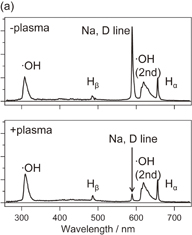
Standard image High-resolution imageAmong the various parameters of the two plasmas, the relative intensity of the Na D line for the −plasma was found to be about eight times larger than that for the +plasma, as shown in Fig. 10(a). The amount of Na contained in the −plasma is larger because Na+ in the solution is attracted to the side of the cathode by the application of the monopolar voltage. It was also found that the width of the Hβ emission line for the −plasma is larger than that for the +plasma, as shown in Fig. 10(b). The Hβ line is broadened by the free electrons around H in the plasma, called Stark broadening.25) From the linewidth, the electron density was estimated as 2.5 × 10¹⁵ and 2.5 × 1016 cm−3 for the +plasma and −plasma, respectively. From these results, two SPs with different properties were simultaneously generated by utilizing the separate-mode discharge and our system enables us to observe these differences separately with microscopic spatial resolution.30)
Download figure:
Standard image High-resolution image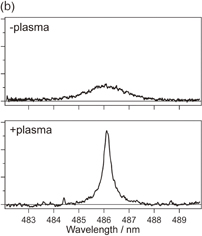
Fig. 10. Emission spectra from the separate-mode SP. A wide spectral range is shown in (a). The Hβ emission line is enlarged in (b).
Download figure:
Standard image High-resolution image
4. Summary
We reviewed the recent progress in instruments toward the spatially and temporally resolved analyses of SP formed in aqueous solutions. Microspectroscopic measurements enabled us to obtain spatial distributions of the transient and reactive species in the spatially inhomogeneous and nonequilibrium SP reaction field. In addition, time-resolved analyses of the emission spectra provided important parameters for controlling the temperature of these transient species. Furthermore, the development of a gas-injectable electrode system for chemical applications and the observation of the different physical properties of separated-mode SP were also demonstrated. Microspectroscopic analyses of SP with the reviewed instruments will provide information on the physical properties and chemical species of SP with both spatial and temporal resolution. This is important for advancing the science of SP and inventing new reaction schemes for chemical and material syntheses through control of the properties of SP reaction fields.
Acknowledgement
The authors acknowledge Professor Dr. Nagahiro Saito of Nagoya University for providing the opportunity for the investigation of SP and for the valuable discussion on the experimental setup and obtained results.
Biographies

Hiroharu Yui received a Bachelor of Technology (University of Tokyo, 1995), Master of Technology (University of Tokyo, 1997), and Doctor of Technology (University of Tokyo, 2003). He became a research associate at Graduate School of Frontier Sciences, University of Tokyo (1999), a researcher of Core Research for Evolutional Science and Technology (CREST) (2001). He became a lecturer (2005), an associate professor (2008), and a professor (2013) at Faculty of Science, Tokyo University of Science. His research focuses on laser spectroscopy, colloid and interfacial chemistry, and solution chemistry.

Motohiro Banno received a Bachelor of Science (University of Tokyo, 2002), Master of Science (University of Tokyo, 2004), and Doctor of Science (University of Tokyo, 2009) and became an assistant professor at the Molecular Photoscience Research Center, Kobe University (2006), and an assistant professor at the Department of Chemistry, Faculty of Science, Tokyo University of Science (2012). His research focuses on development and application of time- and space-resolved vibrational spectroscopy.