
Abstract
Spin motive force (SMF) is induced by a time and spatial derivative of magnetizations and is dependent on spin polarization. We compare the SMF in FeNi with positive spin polarization with that in a magnetite (Fe3O4) with negative spin polarization. We observe the SMF induced by a nonuniform ferromagnetic resonance in Fe3O4 and find that the SMF in Fe3O4 is opposite to that in FeNi. This result originates from the negative spin polarization of Fe3O4. Our clear observation of the SMF depending on the sign of the spin polarization agrees well with the framework of the SMF theory.
Export citation and abstract BibTeX RIS
Spin motive force (SMF) is induced by a time and spatial derivative of magnetizations1–3) as represented by
where P is the spin polarization, ħ is the Planck constant, e is the elementary charge, and m is a normalized magnetization vector.  is a time derivative of the magnetization and
  is a spatial derivative of the magnetization.
  is finite when structures such as a domain wall and a vortex core possess spatially nonuniform magnetizations. The equation indicates that the dynamics of the spatially nonuniform magnetizations induce a motive force Ei. The SMF has been observed in magnetic dynamics in various systems such as a domain wall motion in an FeNi wire,4,5) magnetization dynamics in MnAs nanoparticles in a magnetic tunnel junction,6) a vortex core motion in an FeNi disc,7) and a ferromagnetic resonance in asymmetrically patterned FeNi wires.8) The SMF has a prospect for spintronic applications that can effectively convert the energy of magnetic dynamics into electric energy. Equation (1) indicates that the polarity of the SMF is dependent on the sign of the spin polarization of the ferromagnetic material. Although most of the SMFs measured so far are in FeNi having positive spin polarization, there are no reports on the SMF induced in materials with negative spin polarization.
In this report, we investigate the SMF in a magnetite (Fe3O4) having negative spin polarization and compare it with that in FeNi having positive spin polarization.9) Fe3O4 is one of the good candidates for testing the spin polarization dependence of the SMF, which has a unique character of ferrimagnetism and a half-metallic character with negative spin polarization.10–15)
We prepared fully epitaxial 50-nm-thick Fe3O4 films covered with 2-nm-thick Au on a MgO(001) single-crystal substrate. The quality of the epitaxy is described elsewhere.16) We then patterned it into a wedged wire followed by the deposition of a coplanar waveguide as shown in Fig. 1(a). In order to detect the SMF, we measure the dc voltage longitudinal to the wire under the excitation of magnetic resonance. The measurement is performed by flowing an rf current through the wire while varying the magnitude of an in-plane magnetic field. The applied rf power is up to 16 dBm. θH is the in-plane magnetic field angle away from the x-axis [see Fig. 1(a) for the coordinate system]. The wedge shape is designed so that the rf current generates a nonuniform oscillatory Ampère field around the wire. This nonuniform field induces a spatially nonuniform magnetization dynamics in the longitudinal direction to the wire, as shown in blue arrows in Fig. 1(a). Since this configuration can involve parasitic dc voltages originating from the rectification effect due to the nonlinear coupling between the oscillation of anisotropic magnetoresistance and the rf current, the dc voltage spectrum is expected to be a superposition of a symmetric and antisymmetric Lorentzian17–20) around the resonant frequency as shown in Fig. 1(b). We expect it to be composed of three different contributions:


Download figure:
Standard image High-resolution image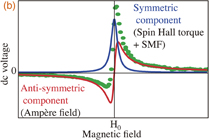
Fig. 1. (a) Schematic illustration of the measurement and a sample. In a wedged sample, a spatially nonuniform FMR is induced (blue arrows). (b) Predicted dc voltage dependence on magnetic field. H0 is the resonant magnetic field. The symmetric components originate from the spin Hall torque and SMF. The antisymmetric component comes from the Ampère field.
Download figure:
Standard image High-resolution imageThe first term on the right-hand side originates from the spin Hall torque due to the spin Hall effect (SHE) of the Au layer.21,22) The resistance oscillation upon the magnetization precession induced by the spin Hall torque by the Au layer couples with the rf current, leading to the rectified dc voltage. The phase of the resistance oscillation is the same as that of the rf current, resulting in a dc voltage spectrum with a symmetric Lorentzian shape at the resonant frequency,20)

S(ω) is the normalized symmetric Lorentzian given by
where σ is the linewidth, ω0 is the resonant frequency, and ω is the frequency of the rf current. It should be noted that this dc voltage is proportional to sin 2θH.
The second term originates from the Ampère field induced by the current flowing in the Au layer. The resistance oscillation upon the magnetization precession due to the Ampère field around the Au layer couples with the rf current, leading to the rectified dc voltage. The phase of the resistance oscillation differs from that of the rf current by π, resulting in a dc voltage spectrum of an antisymmetric Lorentzian at the resonant frequency,

where
is the normalized antisymmetric Lorentzian. It should be noted that this dc voltage is proportional to sin θH sin 2θH.
The third term is from the dc voltage induced by the SMF. Setting θH = 90°, we rewrite Eq. (1) as

where the coordinate corresponds to that shown in Fig. 1(a). The coordinate originates from the long edge of the wire. Here, ϕL and ϕ0 are the precessional angles of the magnetization at y = 0 and y = L, respectively. When ϕ is small, Eq. (5) is approximately
In our experiment, ![$[m_{x}^{2}(L) - m_{x}^{2}(0)]$](https://content.cld.iop.org/journals/1882-0786/8/12/123001/revision1/AP150590if004.gif) is nonzero because of the excitation of the spatially nonuniform magnetization dynamics. With P = 1, θH = 90°, and
is nonzero because of the excitation of the spatially nonuniform magnetization dynamics. With P = 1, θH = 90°, and  , we can obtain
  V/GHz. We emphasize that the SMF is linearly proportional to the resonant frequency, whereas the two other parasitic dc voltages are not. Therefore, it is possible to separate VSMF from VSHE and VAmpère by looking into the frequency dependence.
In the experiment, we mainly focus on the dc voltage under the magnetic field θ = 90° at which the parasitic voltage contributions are negligible [see Eqs. (3) and (4)]. FeNi(20 nm)/Au(3 nm) control samples are also investigated in the same manner for comparison.
We measure the dc voltage while varying the magnitude of the magnetic field ranging from 0 to about 1600 Oe at the field angle θH of 90°. Typical results of wedged samples are shown in Figs. 2(a) and 2(b) for Fe3O4 and FeNi samples, respectively. The peak amplitude in Fe3O4 is small but is clearly visible above the noise level. To specify the dynamics of the resonance, we fit it with Kittel's equation  , where γ = 1.76 × 10¹¹ s−1 T−1, M, and Hk are the gyromagnetic ratio, saturation magnetization, and anisotropy field, respectively. The fitting yields M = 573 mT and Hk = 26 mT for Fe3O4, and M = 1113 mT and Hk = 3.2 mT for FeNi, as shown in Figs. 2(c) and 2(d), respectively. These values are in good agreement with previous reports.23–27) Since the resonant mode in the Fe3O4 sample is well explained by Kittel's equation, the observed resonance is ferromagnetic and we do not observe any ferrimagnetic resonances.

Fig. 2. (a, b) DC voltage spectra of the measurements of (a) FeNi and (b) Fe3O4 samples with thicknesses of 20 and 50 nm, respectively. The shapes of the samples are shown in the inset. The magnetic field angle θ is 90°. (c, d) Resonant frequency dependence on the magnitude of the magnetic field. These results are well fitted by Kittel's function, suggesting that the dc voltage peaks are attributed to ferromagnetic resonance.
Download figure:
Standard image High-resolution imageIn Figs. 3(a) and 3(b), we show the symmetric component of the dc voltage at the field angle θH of 90° as a function of resonant frequency. We observe that the symmetric dc component is linearly proportional to the resonant frequency. Although no gradient of the dc voltage as a function of frequency is observed in the rectangular wire, a finite gradient is observed in wedged wires. The sharper the sample, the larger the gradient observed. This is consistent with ![$[m_{x}^{2}(L) - m_{x}^{2}(0)]$](https://content.cld.iop.org/journals/1882-0786/8/12/123001/revision1/AP150590if008.gif) being larger in sharper samples because a larger precession is induced by a larger Ampère field at the sharp end. Therefore, these frequency-dependent dc voltages are SMFs. Furthermore, we found that the gradient of Fe3O4 is opposite to that of FeNi, suggesting that Fe3O4 induces the opposite SMF owing to the negative spin polarization. The results indicate that the measurement of the SMF can be a way of determining the sign and magnitude of the spin polarization. This measurement technique for determining the spin polarization is potentially advantageous over other methods since it does not require any adjoined materials for reference.12) The nonzero extrapolation of the dc voltage at 0 GHz for the wedged samples implies a residual rectified voltage due to the magnetic inhomogeneity in the wire edge. In Figs. 3(c) and 3(d), we also show antisymmetric components of dc voltage for various shapes of samples. These components are almost 0 for all the samples and do not depend on the resonant frequency. The absence of antisymmetric components shows that there is no significant experimental error of the field angle θH of 90°.
being larger in sharper samples because a larger precession is induced by a larger Ampère field at the sharp end. Therefore, these frequency-dependent dc voltages are SMFs. Furthermore, we found that the gradient of Fe3O4 is opposite to that of FeNi, suggesting that Fe3O4 induces the opposite SMF owing to the negative spin polarization. The results indicate that the measurement of the SMF can be a way of determining the sign and magnitude of the spin polarization. This measurement technique for determining the spin polarization is potentially advantageous over other methods since it does not require any adjoined materials for reference.12) The nonzero extrapolation of the dc voltage at 0 GHz for the wedged samples implies a residual rectified voltage due to the magnetic inhomogeneity in the wire edge. In Figs. 3(c) and 3(d), we also show antisymmetric components of dc voltage for various shapes of samples. These components are almost 0 for all the samples and do not depend on the resonant frequency. The absence of antisymmetric components shows that there is no significant experimental error of the field angle θH of 90°.

Fig. 3. (a) Frequency dependence of symmetric dc voltage in FeNi samples. The shapes of the samples are shown in the inset. Negative gradients are observed for wedged wires. (b) Frequency dependence of symmetric dc voltage in Fe3O4 samples. The shapes of the samples are shown in the inset. Positive gradients are observed for wedged wires, suggesting that the SMF opposite to that in FeNi is induced in Fe3O4. (c) Frequency dependence of the antisymmetric dc voltage in FeNi samples. (d) Frequency dependence of the antisymmetric dc voltage in Fe3O4 samples.
Download figure:
Standard image High-resolution imageOne may be still concerned with a few other possibilities of parasitic dc voltages. However, we will be able to rule those out because of the following reasons. One possibility is the temperature gradient of the wire that induces the Seebeck effect. Upon magnetic resonance, a magnon–phonon scattering can induce heat in the system. The cross section of the magnon–phonon scattering depends on the precessional angle. Since the precessional cone angle is different between the narrow and wide parts of the wire, a thermal gradient along the y-axis is possible. Taking into account the Seebeck constants of −20 µV/K for FeNi, −60 µV/K for Fe3O4, and 1.7 µV/K for Au,28,29) we would expect the induced voltage to be in the same polarity for both FeNi and Fe3O4. However, in our results, the gradient of dc voltage against the resonant frequency of Fe3O4 is opposite to that of FeNi, which cannot be solely explained by the Seebeck effect. Another possibility is the Nernst effect as well as the anomalous Nernst effect. These can develop the dc voltage perpendicular to both the magnetic field and the temperature gradient. With both the temperature gradient and the magnetic field being in the y-axis, there should be no Nernst voltages in our voltage measurement direction. Lastly, the frequency dependence of the rf magnetic susceptibility could also induce the gradient of the dc voltage. A higher resonant frequency makes the precessional cone angle smaller, giving a smaller resistance oscillation and, therefore, inducing a smaller rectified dc voltage. However, in Fig. 3, the dc voltage of Fe3O4 increases when the resonant frequency increases. This result cannot be explained by the frequency dependence of the ac magnetic susceptibility.
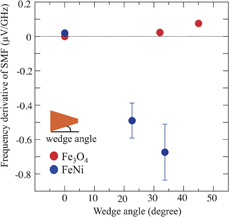
In Fig. 4, we show SMF per GHz as a function of wedge angle. The definition of the wedge angle is shown in the inset. We obtain −0.67 and 0.08 µV/GHz at maximum for FeNi and Fe3O4, respectively. With the frequency vs field data shown in Figs. 2(c) and 2(d), these values translate to 5.5 and 0.53 nV/Oe for FeNi and Fe3O4, respectively. We suspect that the smaller SMF in Fe3O4 is due to a shunt resistance of the Au layer. The resistivity of Fe3O4 is  Ω m, which is much higher than that of FeNi (2.2 × 10⁻⁷ Ω m). By assuming that the SMF is shunted by the surface Au layer, we can calculate
  for Fe3O4 samples and
  for FeNi samples. In the calculation, we used the resistivities ρAu = 2.2 × 10⁻⁸ Ω m, ρPy = 2.2 × 10⁻⁷ Ω m, and ρFe3O4 = 4.0 × 10⁻⁵ Ω m for each material. Here, VSMF is the corrected SMF and
  is the measured SMF. Therefore, the Au shunt resistance is more effective in Fe3O4 samples, resulting in the underestimation of SMF in Fe3O4.
Fig. 4. The frequency derivative of the SMF (µV/GHz) is calculated from the results shown in the figure.
Download figure:
Standard image High-resolution image
In summary, we observed the SMFs induced in the nonuniform ferromagnetic resonance of Fe3O4 with negative spin polarization and in that of FeNi with positive spin polarization. By ruling out the parasitic dc voltage irrelevant to the SMF, Fe3O4 is found to induce the SMF that is opposite to that in FeNi. This originates from the opposite spin polarizations between FeNi and Fe3O4.
Acknowledgment
This work was partly supported by a Grant-in-Aid for Scientific Research (S), a Grant-in-Aid for Young Scientists (B), and a Research Fellowship for Young Scientists from the Japan Society for the Promotion of Science (JSPS).