
Abstract
We investigated the hollow whispering gallery mode (WGM) microcavity, in which the WGM resonance position is transferred when ncore = nwall (referred to as a "jump point"). Via numerical simulation, we verified the WGM resonance trajectory from the wall to the core with changes in the core refractive index from ncore < nwall to ncore > nwall. Owing to the transfer of the WGM resonance characteristics, the refractive-index sensitivity, Q value, and free spectral range of the WGM resonance differed markedly after the jump point. This study can be considered as a proof of concept and can be extended to higher-quality microspheres or microbubbles.
Export citation and abstract BibTeX RIS

Content from this work may be used under the terms of the Creative Commons Attribution 4.0 license. Any further distribution of this work must maintain attribution to the author(s) and the title of the work, journal citation and DOI.
Optical microcavities are typically microscale dielectric structures that trap light to exploit total internal reflection. As resonators, they support whispering gallery modes (WGMs) with a high quality (Q) factor and small mode volume.1,2) Whispering gallery microcavities have garnered considerable interest owing to their practical applications as filters, modulators, sensors, and lasers.3–5) In recent decades, WGM resonators have been molded into a wide variety of geometries, ranging from the simplest ones, i.e., the microspheres,6) microdisks,7) and microrings,8) to more exotic shapes, such as microbottles9–11) and microbubbles,12–14) each with their own specific advantages and disadvantages.
Recent years have seen the design and fabrication of many innovative sensors based on WGM microcavities for measuring the physical, chemical, and biological properties of the surrounding environment. Compared with other WGM resonators, such as microspheres, microdisks, and microrings, the main advantage of hollow WGM microcavities is that the samples can be confined inside the resonator, rather than outside, which ensures that the outer surface — where total internal reflection occurs — always remains in air. This markedly extends the tuning range of the sensor.15,16) Hollow whispering gallery microcavities have already exhibited remarkable potential for optical component integration and cost-effective mass manufacturing.17,18) Many researchers have applied hollow microcavities experimentally, but very few have explored the phenomenon whereby the core refractive index (from ncore < nwall to ncore > nwall) can be adjusted to change the WGM resonance characteristics.
This paper reports a hollow glass microsphere (HGM) with nanoscale wall thickness for use as an optical whispering gallery microcavity. We numerically simulated the core refractive-index cross-sectional electric-field distributions of the HGM and theoretically analyzed the transfer of the WGM resonant position from the wall to the core at the jump point. We opened a microhole on the surface of the HGM, which is filled with liquids of varying refractive index, and observed typical WGM resonance via coupling with a tapered fiber. Owing to the transfer of the WGM resonance characteristics at the jump point (nj), the refractive-index sensitivity, Q value, and free spectral range (FSR) of the WGM resonance spectrum of the HGM filled with liquids of different refractive indices differed markedly after the jump point.
WGM resonance is formed by continuous total internal reflections at the curved boundary between the cavity and surrounding medium.15) When the HGM core has a higher or lower refractive index than the wall (that is, from ncore < nwall to ncore > nwall), total internal reflection may occur in different positions. Additionally, in the case of a thin wall, the WGM resonances induced by the wall surface and the WGM resonances induced by the core surface differ; thus, the WGM resonant properties are changed. The core refractive index has a certain value (nj), which forms the jump point for WGM resonance transfer. We performed a series of numerical simulations and experiments to verify the transfer of the WGM resonant properties inside the HGM with cores of different refractive indices at the jump point.
The numerical simulations were performed using COMSOL Multiphysics. The model consists of a hollow spherical shell surrounded by air, and the core was assigned different refractive indices. To ensure the accuracy of the numerical simulation, we examined the WGM electric-field distributions for cores of different refractive indices in the HGM by tracking the same angular mode number. Because the resonant wavelength of the same angular mode number changed with respect to the core refractive index, the resonance wavelengths for different refractive indices at the same angular mode number must be calculated. For simplicity, we consider transverse-magnetic (TM) modes only. The resonant wavelength of a TM WGM with the mode number l is determined by the following system of equations:19,20)

where z1 = n1kr1, z2 = n2kr1, z1 = n2kr2, z3 = n3kr2, S12 = n1/n2, S23 = n2/n3, and k = 2π/λ. n1, n2, and n3 are the refractive indices of the core, wall, and air, respectively. r1 and r2 are the inner and outer diameters of the HGM. ψl(z) = zjl(z) and χl(z) = znl(z), where jl and nl are the spherical Bessel and Neumann functions, respectively. There is a series of λ values that satisfy Eqs. (1) and (2) for a specific l. In the increasing order of λ, which are known as the 1st, 2nd and νth orders of the WGM.
To ensure the accuracy of the numerical simulation, we used different concentrations of the glycerol aqueous solution in the HGM core to change the core refractive index.21,22) Figure 1(a) shows a section view of the space electric-field distributions inside the HGM with outer diameters and wall thicknesses of 90 µm and 892 nm, respectively (angular mode number 255). We set the refractive indices of the air, wall, and core as 1, 1.45, and 1.43 (glycerol concentration 67.58%), respectively. WGM resonance formed at the equatorial plane of the spherical shell (resonant wavelength of 1,536.90 nm). We set the wall and air refractive indices to remain unchanged and changed the refractive index of the core from 1.43 to 1.47 (corresponding glycerol concentrations of 67.58, 74.54, 81.51, 88.48, and 95.45%) to obtain a series of section views of the electric-field distributions inside the HGM [Fig. 1(b)]. We found that as the core refractive index increases, the main energy in the HGM moves from the wall to the core; i.e., the WGM resonance moves from the wall to the core.
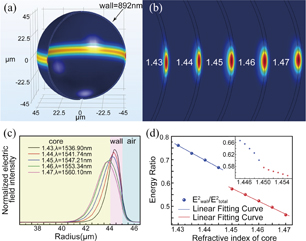
Fig. 1. (a) Section views of the space electric-field distributions inside HGMs with outer diameters and wall thicknesses of 90 µm and 892 nm, respectively. (b) Section views of the core electric-field distributions (TM mode) with different refractive indices (aqueous glycerol solutions concentration). (c) Normalized electric-field intensity distribution (TM mode) of cores with different refractive indices in the radial direction. (d) Ratio of the energy on the wall to the total energy.
Download figure:
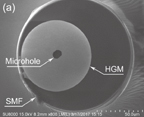
Standard image High-resolution imageThe HGMs used in this experiment have diameters ranging from 20 to 115 µm (Minnesota Mining and Manufacturing K25), are nearly perfectly spherical in shape, and have smooth surfaces according to scanning electron microscopy (SEM) results shown in Fig. 2(a). The HGM was fixed on the end face of the single-mode fiber (SMF) with a low-refractive index ultraviolet curable adhesive to ensure stable and effective operation. A Cu rod with a sharp tip (diameter ≈ 5 µm) was immersed in hydrofluoric acid (HF) and held close to the HGM. Then, a 10-µm-diameter microhole was formed on the HGM surface via HF acid etching [Fig. 2(a)]. We controlled the microhole size by adjusting the etching time and HF concentration. We found that the HGM wall thickness was not a fixed value, as indicated by SEM images of several broken HGMs. However, the wall thickness was mainly distributed at 900 nm. Figure 2(b) shows an SEM image of sample HGM fragments with a wall thickness of approximately 892 nm.
Download figure:
Standard image High-resolution image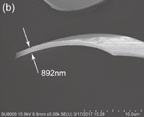
Fig. 2. (a) SEM images of HGM fixed on the end faces of the SMF. (b) SEM image of fragments of a deliberately broken HGM.
Download figure:
Standard image High-resolution imageUsing the same HGM to ensure a consistent wall thickness, we investigated the influence of liquids of various refractive indices filling the HGM on the WGM resonance. A schematic of our experimental setup is shown in Fig. 3(a). The light output from the amplified spontaneous emission (ASE) light source (wavelength range: 1,525 to 1,570 nm) and the tunable laser source (resolution of 1 pm, centered at 1,550 nm) was coupled to the optical fiber through a optical fiber couple (OFC) and connected to a 1–2-µm tapered fiber [Fig. 3(a), inset] via a polarization controller (PC). The PC was used to effectively excite the TM mode. The transmission signal at the output ports of the fiber taper was connected to a 50/50 inline beam splitter (BS). One output of the BS was sent to a digital oscilloscope (DSO) via a photodiode (PD), and the other one was connected to an optical spectrum analyzer (OSA) with a minimum resolution of 0.02 nm. The tapered fiber was fabricated using a flame-heated drawing technique. The positions of the liquid-filled HGM and the fiber taper were controlled using a three-dimensional X–Y–Z stage to ensure a high coupling efficiency. A 9-µm-diameter capillary [Fig. 3(a), inset], which was also prepared via the flame-heated drawing, was connected to a micro-injection pumper, which we used to control the air pressure inside the capillary and achieve liquid injection and extraction, as well as other operations.

Fig. 3. (a) Schematic of the experimental setup. Inset: micrograph of a liquid-filled HGM coupled to a tapered fiber. (b) Transmission spectra of a liquid-filled HGM. (c) Micrograph of a capillary-injected liquid-filled HGM.
Download figure:
Standard image High-resolution imageFigure 3(c) shows a micrograph of the HGM filled with liquid that was injected through a capillary. The liquid did not leak, owing to its surface tension and the size of the microhole. The inside of the HGM was completely filled with the liquid, and there were no microbubbles of air inside the hollow cavity. Figure 3(b) shows the typical WGM resonance spectrum of (diameter ≈ 90.4 µm) the liquid-filled HGMs (ncore = 1.434 at 25 °C, refractive-index matching liquids, Cargille Lab) received by an oscilloscope. The corresponding Q-factor (defined as Q = λ/Δλ, where Δλ is the linewidth of the peak) was 0.565 × 10⁵.
We needed to repeatedly fill liquids into the same HGM for the purposes of our experiment. First, we siphoned the liquid form the HGM by simply manipulating the micro-injection pumper status. We used alcohol to flush the residual liquid inside the HGM and then allowed the inside of the HGM to dry. We investigated the shift in the WGM spectra as the HGM was cleaned repeatedly, as shown in Table I. We found that the WGM resonance wavelength and FSR recovered to the state with no injected liquid (that is, the effect of the residual liquid was eliminated) once the liquid-filled HGM was cleaned three times.
Table I. WGM resonance with respect to the HGM cleaning time.
| Resonance wavelength (nm) | FSR (nm) | Q-value | |
|---|---|---|---|
| Air-filled HGM | 1546.07 ( ) ) |
5.81 | 0.848 × 10⁵ |
| Liquid-filled HGM | 1549.87 ( ) ) |
5.85 | 0.542 × 10⁵ |
| First cleaning HGM | 1546.09 ( ) ) |
5.82 | 0.813 × 10⁵ |
| Second cleaning HGM | 1546.07 ( ) ) |
5.81 | 0.842 × 10⁵ |
| Third cleaning HGM | 1546.07 ( ) ) |
5.81 | 0.845 × 10⁵ |
Traditionally, there is a strong evanescent electromagnetic field on the surface of the WGM microcavity. Any slight variation in the refractive index near the WGM microcavity introduces either a change in the linewidth or a resonant-wavelength shift.2) Any variations in the refractive index of the HGM core also lead to a change in the FSR and a resonant-wavelength shift. We performed a systematic study on the changes in the WGM resonance after the jump point via experimental analysis and theoretical calculation.
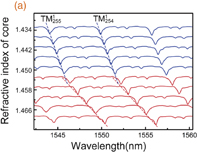
We designed an experiment based on the HGM filled with liquids of different refractive indices to study the characteristics of the WGM resonance at the jump point. During the experimental process, for real-time monitoring of the transmission spectra, the input port was connected to the ASE, and the output ports of the fiber taper were connected to an OSA. Figure 4(a) shows the transmission spectra of the HGM (diameter ≈ 84.0 µm) filled with liquids of different refractive indices. The angular mode number l of the WGM can be expressed as l = λl+1/(λl − λl+1) + 1, where λl and λl+1 are the wavelengths of two successive modes with the same polarization.23) The l values are calculated as 253–255. By tracking the same angular mode number (for modes  and
and  ), we found that the WGM resonance wavelength spectra redshifts as the liquid-core refractive index increases. Figure 4(b) shows the resonant wavelengths of the liquid-filled HGM with respect to the liquid-core refractive index, ranging from 1.434 to 1.470 in intervals of 0.004. When ncore < nj, the refractive-index sensitivities reach 103.5 and 102.8 nm/RIU for the
  and
and  modes, respectively. When ncore > nj, the refractive-index sensitivities reach 252.6 and 259.5 nm/RIU for the
  and
and  modes, respectively. The refractive-index sensitivities exhibit an obvious jump point (nj) around 1.45. In addition, the refractive-index sensitivity is relatively stable across different angular mode numbers before the jump point. However, the refractive-index sensitivity of different angular mode numbers exhibits larger differences after this point.
Download figure:
Standard image High-resolution image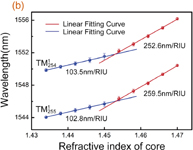
Fig. 4. (a) Transmission spectra of an HGM filled with liquids of different refractive indices. (b) Resonant wavelengths (for modes  and
and  ) of the liquid-filled HGM with respect to the liquid-core refractive index.
Download figure:
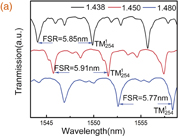
Standard image High-resolution imageWe also found that the FSR of the WGM spectrum of the HGM filled with liquids of different refractive indices exhibited larger differences at the jump point. Figure 5(a) shows the transmission spectra of the HGM filled with liquids of three different refractive indices; there are considerable FSR variations in the WGM resonance among them. Figure 5(b) shows the FSR and Q values of the WGM resonance with respect to the core refractive index; the FSR remains stable as the core refractive index increases before the jump point but significantly decreases after the jump point. In addition, the Q values change significantly at the jump point: when the WGM resonance moves from the HGM wall to the liquid-core surface, the increase of the scattering loss and liquid absorption loss reduces the Q value.
Download figure:
Standard image High-resolution image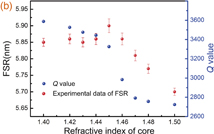
Fig. 5. (a) Transmission spectra of the HGM filled with liquids of three different refractive indices. (b) FSR and Q values of the WGM resonance with respect to the core refractive index.
Download figure:
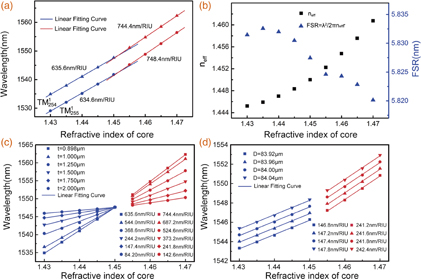
Standard image High-resolution imageWe then verify the variation of the WGM resonance of hollow spheres with cores of different refractive indices via theoretical calculation. The resonant wavelength λ for the cores of different refractive indices was calculated using Eq. (1), as shown in Fig. 6(a). We found that the refractive-index sensitivity of the theoretical calculation is higher than that of the experiment [Fig. 4(b)]. This is mainly because some liquid remains inside the HGM during the cleaning process. In addition, the HGM wall thickness is not fixed, which contributes to the sensitivity difference.
Fig. 6. (a) Resonant wavelengths (for modes  and
and  ) of the liquid-filled HGM calculated using Eq. (1). (b) neff and FSR of the WGM resonance with respect to the core refractive index. (c) Resonance wavelength (for mode
  ) with respect to the core refractive index at different wall thicknesses. (d) Resonance wavelength (for mode
  ) with respect to the core refractive index at different HGM diameters.
Download figure:
Standard image High-resolution image
Next, we investigate the theoretical resonance transfer with cores of different refractive indices for different wall thicknesses (t) and HGM diameters (D), as shown in Figs. 6(c) and 6(d), respectively. In Fig. 6(c), it is observed that when the HGM diameter (84 µm) and angular mode number (254) are constant, the sensitivity decreases as the wall thickness increases. When the refractive index of the core is equal to that of the wall (ncore = 1.45), the liquid-filled HGM can be considered as solid microspheres with a uniform refractive index; thus, the WGM resonance wavelengths of hollow spheres with different wall thicknesses are the same at 1.45. In Fig. 6(d), it is observed that when the wall thickness (1.75 µm) is constant, the sensitivity decreases as the HGM diameter decreases. We found that when the wall thickness and HGM diameter are 1.75 and 83.96 µm, respectively, the theoretical results agree well with the experimental results. However, owing to the transfer of the WGM resonance characteristics at the jump point (nj), the refractive-index sensitivities for Figs. 4(b) and 6 exhibit an obvious jump around 1.45.
The FSR of the WGM can be expressed as FSR = λ2/2πneffr, where λ is the resonance wavelength, neff is the effective refractive index of the HGM, and r refers to the radius of the WGM resonance.2,24) The effective refractive index of the WGM resonance in the HGM is strongly dependent on the refractive index of the fluid in the core, as well as the thickness of the wall.25) In the experiment, we used the same HGM to ensure a consistent wall thickness; thus, neff is only related to the core refractive index. neff is defined as follows:1,26)
The refractive index of the core and wall is a fixed value after the HGM is filled with liquid. After the above simplifications, Eq. (3) becomes
where Ecore, Ewall, and Eair are the energy of the core, wall, and air. Figure 6(b) shows the results of the neff and the FSR formula calculation (angular mode number 255), which coincide with the experimental results. When ncore < nwall, the simulation results show that the WGM resonance occurs on the wall of the HGM. The effective refractive index neff and radius r (HGM radius) remain almost unchanged as the core refractive index increases; thus, the FSR remains unchanged. When ncore > nj, as the core refractive index increases, neff increases, and r (liquid-core radius) remains unchanged; thus, the FSR decreases. Owing to the decrease in the FSR after the jump point, the refractive-index sensitivity of different angular mode numbers exhibits larger differences after the jump point.
In conclusion, the WGM resonance mechanism of the HGM was unambiguously verified via numerical simulation. The WGM resonance moves from the HGM wall to the core because of the changes in the core refractive index. Owing to the transfer of the WGM resonance characteristics at the jump point (nj), the refractive-index sensitivity, Q value, and FSR of the WGM resonance spectrum exhibit an obvious jump, which is consistent with the theoretical calculation results. In principle, this mechanism can be extended to higher-quality hollow microcavity resonators. In addition, the liquid-filled HGM exhibits potential for highly sensitive sensing applications, and the maximum sensitivity reaches 259.5 nm/RIU.
Acknowledgments
This work was supported by the National Key R&D Program of China under Grants 2016YFF0200700 and 2017YFB0405502, as well as the National Science Foundation (NSF) 61635007.