Reciprocal regulation among TRPV1 channels and phosphoinositide 3-kinase in response to nerve growth factor
- University of Washington, United States
- Seattle Children’s Research Institute, United States
Abstract
Although it has been known for over a decade that the inflammatory mediator NGF sensitizes pain-receptor neurons through increased trafficking of TRPV1 channels to the plasma membrane, the mechanism by which this occurs remains mysterious. NGF activates phosphoinositide 3-kinase (PI3K), the enzyme that generates PI(3,4)P2 and PIP3, and PI3K activity is required for sensitization. One tantalizing hint came from the finding that the N-terminal region of TRPV1 interacts directly with PI3K. Using two-color total internal reflection fluorescence microscopy, we show that TRPV1 potentiates NGF-induced PI3K activity. A soluble TRPV1 fragment corresponding to the N-terminal Ankyrin repeats domain (ARD) was sufficient to produce this potentiation, indicating that allosteric regulation was involved. Further, other TRPV channels with conserved ARDs also potentiated NGF-induced PI3K activity. Our data demonstrate a novel reciprocal regulation of PI3K signaling by the ARD of TRPV channels.
https://doi.org/10.7554/eLife.38869.001Introduction
Although the current opioid epidemic highlights the need for improved pain therapies, in particular for pain in chronic inflammation (Johannes et al., 2010), too little is known about the mechanisms that mediate increased sensitivity to pain that occurs in the setting of injury and inflammation (Ji et al., 2014). Inflammatory hyperalgesia, the hypersensitivity to thermal, chemical, and mechanical stimuli (Cesare and McNaughton, 1996), can be divided in two phases, acute and chronic (Dickenson and Sullivan, 1987). Locally released inflammatory mediators, including growth factors, bradykinin, prostaglandins, ATP and tissue acidification (Kozik et al., 1998; Lardner, 2001; Tissot et al., 1989; Burnstock, 1972), directly stimulate and sensitize nociceptive fibers of primary sensory neurons (Cesare and McNaughton, 1996; Bevan and Yeats, 1991; Trebino et al., 2003; Hamilton et al., 1999; Mcmahon et al., 1995).
One of the proteins that has been studied for its role in hyperalgesia is Transient Receptor Potential Vanilloid Subtype 1 (TRPV1). TRPV1 is a non-selective cation channel that is activated by a variety of noxious stimuli including heat, extracellular protons, and chemicals including capsaicin, a spicy compound in chili pepper (Caterina et al., 1999). TRPV1 is expressed in sensory nociceptive neurons, which are characterized by cell bodies located in the dorsal root ganglia (DRG) and trigeminal ganglia (Caterina et al., 1999). Sensory afferents from these neurons project to skin and internal organs, and synapse onto interneurons in the dorsal horn of the spinal cord (Willis, 1978). TRPV1 activation leads to sodium and calcium influx, which results in action potential generation in the sensory neuron and, ultimately, pain sensation (Caterina et al., 1997).
The importance of TRPV1 in inflammatory hyperalgesia was demonstrated by findings that the TRPV1 knock-out mouse showed decreased thermal pain responses and impaired inflammation-induced thermal and chemical hyperalgesia (Caterina et al., 2000). TRPV1 currents are enhanced during inflammation which leads to increased pain and lowered pain thresholds (Davis et al., 2000; Zhang et al., 2005; Shu and Mendell, 1999). TRPV1 is modulated by G-protein-coupled receptors (GPCRs) and receptor tyrosine kinases (RTKs), but the mechanisms by which these receptors modulate and sensitize TRPV1 are controversial (Suh and Oh, 2005; Shu and Mendell, 1999; Cesare and McNaughton, 1996).
Nerve growth factor (NGF) is one of the best studied RTK agonists involved in inflammatory hyperalgesia (Vetter et al., 1991). NGF acts directly on peptidergic C-fiber nociceptors (Donnerer et al., 1992), which express RTK receptors for NGF: Tropomyosin-receptor-kinase A (TrkA) (Mcmahon et al., 1995) and neurotrophin receptor p75NTR (Lee et al., 1992). NGF binding to TrkA/p75NTR induces receptor auto-phosphorylation and activation of downstream signaling pathways including phospholipase C (PLC), mitogen-activated protein kinase (MAPK), and Type IA phosphoinositide 3-kinase (PI3K) (Vetter et al., 1991; Raffioni and Bradshaw, 1992; Dikic et al., 1995). We and others have previously shown that the acute phase of NGF-induced sensitization requires activation of PI3K, which increases trafficking of TRPV1 channels to the PM (Stein et al., 2006; Bonnington and McNaughton, 2003). In chronic pain, NGF also produces changes in the protein expression of ion channels such as TRPV1 and NaV1.8 (Ji et al., 2002; Thakor et al., 2009; Keh et al., 2008). The acute and chronic phases of the NGF response result in increased ‘gain’ to painful stimuli.
Type 1A PI3K is a lipid kinase, which phosphorylates the signaling lipids Phosphatidylinositol (4) phosphate (PI4P) and Phosphatidylinositol (4,5) bisphosphate (PIP2) into Phosphatidylinositol (3,4) bis phosphate (PI(3,4)P2)and Phosphatidylinositol (3,4,5) trisphosphate (PIP3), respectively (Auger et al., 1989). PI(3,4)P2 and PIP3 are signaling lipids as well, and their role in membrane trafficking and other downstream signaling is well-established (Insall and Weiner, 2001; Hawkins and Stephens, 2016). PI3K is an obligatory heterodimer that includes the catalytic p110 subunit (with α, β, and γ isoforms) and regulatory p85 subunit (with α and β isoforms) (Hiles et al., 1992; Vanhaesebroeck et al., 2010). The p85 subunit contains two Src homology 2 (SH2) domains (Escobedo et al., 1991), which recognize the phospho-tyrosine motif Y-X-X-M of many activated RTKs and adaptor proteins (Songyang et al., 1993). In the resting state, p85 inhibits the enzymatic activity of p110 via one of its SH2 domains (Miled et al., 2007). This autoinhibition is relieved when p85 binds to a phospho-tyrosine motif (Miled et al., 2007). NGF-induced PI3K activity leads to an increase in the number of TRPV1 channels at the PM (Bonnington and McNaughton, 2003; Stein et al., 2006).
We have previously shown that TRPV1 and p85 interact directly (Stein et al., 2006). We localized the TRPV1/p85 interaction to the N-terminal region of TRPV1 and a region including two SH2 domains of p85 (Stein et al., 2006). However, whether the TRPV1/p85 interaction contributes to NGF-induced trafficking of TRPV1 is unknown. Here, we further localized the functional interaction site for p85 to the region of TRPV1 N-terminus containing several conserved Ankyrin repeats (Ankyrin repeat domain (ARD)). Remarkably, we found that TRPV1 potentiated the activity of PI3K and that a soluble TRPV1 fragment corresponding to the ARD was sufficient for this potentiation. Because the ARD is structurally conserved among TRPV channels, we tested whether other TRPV channels could also potentiate NGF-induced PI3K activity. We found that TRPV2 and TRPV4 both potentiated NGF-induced PI3K activity and trafficked to the PM in response to NGF. Together, our data reveal a previously unknown reciprocal regulation among TRPV channels and PI3K. We speculate that this reciprocal regulation could be important wherever TRPV channels are co-expressed with PI3K-coupled RTKs.
Results and discussion
NGF-induced trafficking of TRPV1 channels to the PM is preceded by activation of PI3K
To study events that underlie NGF-induced trafficking of TRPV1 to the PM, we used TIRF microscopy to visualize fluorescently labeled TRPV1 (rat) (YFP-fusion, referred to as TRPV1) in transiently transfected F-11 cells. Cells were also transfected with the NGF receptor subunits TrkA and p75NTR (referred to as TrkA/ p75NTR). TIRF microscopy isolates ~ 100 nm of the cell proximal to the coverslip (Ambrose, 1961; Axelrod, 1981), capturing the PM-proximal fluorescent signals. A change in TRPV1 fluorescence reflects a change in the number of TRPV1 channels at the PM.
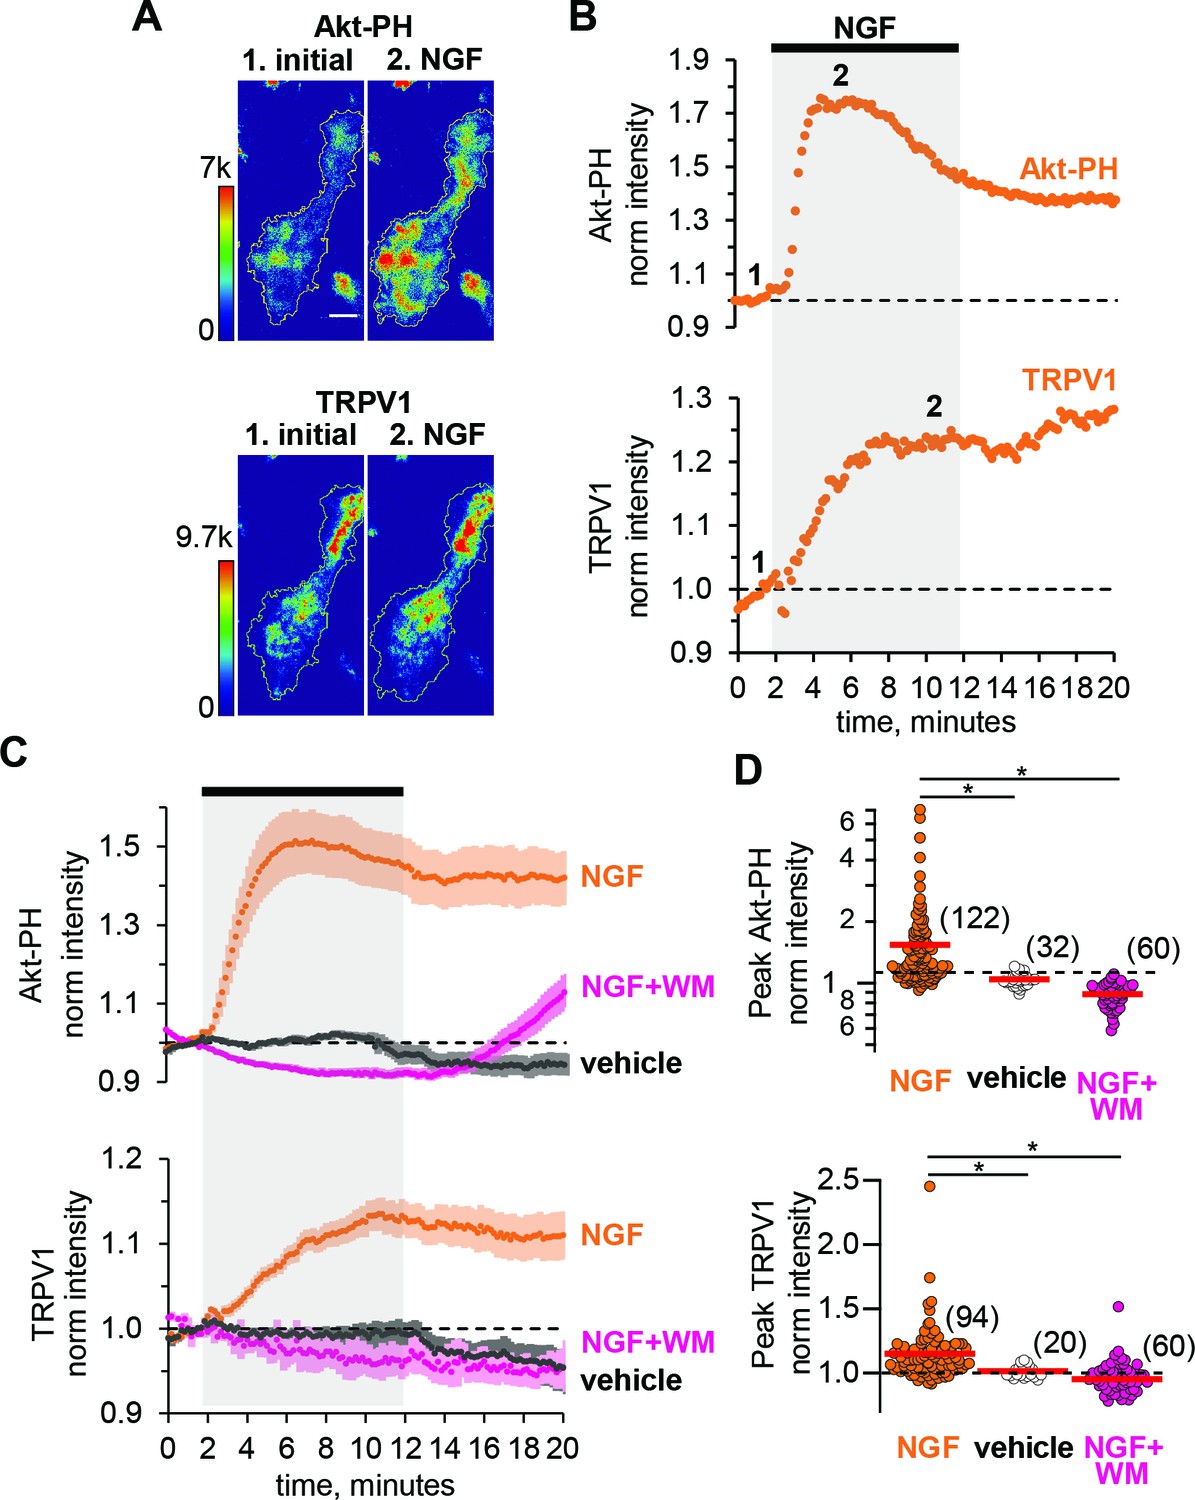
We examined NGF-dependent changes in PM-associated TRPV1 before (Figure 1A, time point 1), during, and following (Figure 1A, time point 2) a 10-min exposure of the cells to NGF (100 ng/ml) via its addition to the bath (bar with gray shading in Figure 1B,C). Figure 1A, bottom panel shows representative TIRF images of TRPV1 fluorescence of an individual F-11 cell footprint. Consistent with previous findings (Stein et al., 2006), upon addition of NGF, TRPV1 levels at the PM increased, with time point two depicting the cell footprint intensity at steady state. For each cell, we normalized the mean fluorescence intensity within the footprint at each time point to the mean between 0 and 60 s prior to the application of NGF. The signal for TRPV1 for the cell in Figure 1A is shown in Figure 1B, and the collected data, showing the mean and standard error of the mean, are illustrated in Figure 1C.
Figure 1 with 4 supplements see all
NGF increases PIP3 and recruits TRPV1 to the PM.
(A) TIRF images of a representative F-11 cell transfected with TrkA/p75NTR, TRPV1 and Akt-PH. Images labeled one were collected before NGF application and those labeled two were collected at the plateau during NGF application, as indicated by the time points labeled in B. Scale bar is 10 µm. LUT bars represent background-subtracted pixel intensities. The yellow border represents the outline of the cell footprint. (Top) Fluorescence intensity from Akt-PH. (Bottom) Fluorescence intensity from TRPV1. (B) Time course of NGF-induced changes in fluorescence intensity for the cell shown in A. NGF (100 ng/mL) was applied during the times indicated by the black bar/gray shading. Intensity at each time point was measured as the mean gray value within the footprint (yellow outline in A). Data were normalized to the mean intensity values during the two minutes prior to NGF application. (C) And (D) Collected data for the group of cells tested. (C) Time course of NGF-induced changes in fluorescence intensity. Averaged time courses of TIRF intensity normalized as in B. Cells treated with either NGF (orange), vehicle (black) or NGF +wortmannin (NGF +WM, magenta), as indicated. TRPV1 (bottom) and Akt-PH (top). Error bars are SEM (D) NGF-induced change in fluorescence intensity. Cells were treated with NGF (orange), vehicle (open symbols) or NGF +wortmannin (NGF +WM, magenta), as indicated. Averaged normalized TIRF intensity during NGF application (6–8 min for Akt-PH (top) and 10–12 min for TRPV1 (bottom)). The red bars indicate the mean Akt-PH fluorescence (top) and TRPV1 fluorescence (bottom). Asterisks indicate Wilcoxon rank test significance p value < 0.001.
To evaluate NGF-induced PI3K activity, we used fluorescently tagged Btk-PH and Akt-PH, PH (Pleckstrin Homology) domain probes that recognize primarily PIP3 or both PI(3,4)P2 and PIP3, respectively (James et al., 1996). Btk-PH and Akt-PH are soluble proteins that localize to the cytosol at rest, when PI(3,4)P2/PIP3 levels are very low, and are recruited to the PM upon stimulation with NGF, when PI3K becomes active and generates PI(3,4)P2/PIP3 (Hawkins et al., 2006; Lemmon, 2008). A change in PH domain probe fluorescence reflects a change in PI(3,4)P2/PIP3 concentration at the PM, thus serving as an indirect measure of PI3K activity. Because PH domain probes have been reported to interfere with PI3K signaling (Várnai et al., 2005), we tested whether Btk-PH and Akt-PH are compatible with NGF signaling to TRPV1. We found that Btk-PH completely abrogated NGF-induced trafficking of TRPV1 to the PM (Figure 1—figure supplement 1). In contrast, Akt-PH was fully compatible with NGF-induced trafficking of TRPV1 (Figure 1).
As an additional control, we used an orthogonal approach to evaluate the compatibility of the Akt-PH probe with NGF signaling in our cell system. Phosphorylation of the protein kinase Akt (also known as PKB) is a well-studied signaling event downstream of PI3K (Burgering and Coffer, 1995; Kohn et al., 1995). Akt is phosphorylated in a PI(3,4)P2/PIP3-dependent manner at two sites, T308 and S473, by PDK1 (Alessi et al., 1997; Stokoe et al., 1997; Frech et al., 1997) and mTORC2, respectively (Sarbassov et al., 2005). Phosphorylation of Akt at these two sites leads to full activation of Akt, regulating a variety of cellular processes, including the inflammatory response to NGF (Xu et al., 2007; Sun et al., 2007; Xu et al., 2011). Therefore, we tested whether co-expression of the Akt-PH probe altered NGF-induced Akt phosphorylation. We performed western blot analysis using anti-pAKTt308, anti-pAKTs473, and anti-panAKT antibodies. Figure 1—figure supplement 2 shows that NGF-induced Akt phosphorylation was preserved in cells expressing the Akt-PH probe. We therefore utilized the Akt-PH probe as a readout of PI3K activity in the remaining experiments.
We used two-color TIRF microscopy to measure PI3K activity and TRPV1 trafficking to the PM simultaneously. Treatment of cells with NGF produced an increase in plasma-membrane associated Akt-PH, indicating that PI(3,4)P2/PIP3 levels in the PM increased. The increase was relatively rapid, with kinetics determined by both PI3K activity and the affinity of Akt-PH for PI(3,4)P2/PIP3. The increased Akt-PH signal partially decreased over time even in the continued presence of NGF (Figure 1B and C orange, top), possibly due to TrkA/p75NTR receptor internalization (Grimes et al., 1996; Ehlers et al., 1995) and activation of phosphoinositide 3-phosphatases, e.g. PTEN (Malek et al., 2017). NGF treatment also increased the PM TRPV1 signal without an apparent reversal to baseline over the duration of our experiments (Figure 1B and C orange, bottom). The peak levels of Akt-PH and TRPV1 for all cells, represented as the normalized intensities measured at 4–6 min (for Akt-PH) and 8–10 min (for TRPV1) after the start of NGF application, are shown in the scatterplot of Figure 1D. The distributions were not normal, but skewed toward larger values. This distribution shape is characteristic of NGF-induced TRPV1 sensitization reported previously in DRG neurons (Stein et al., 2006; Bonnington and McNaughton, 2003), indicating that our cell expression model behaves similarly to isolated DRG neurons. NGF induced a significant increase in Akt-PH levels compared to vehicle (Mean ± SEM: 1.54 ± 0.08, n = 122 compared to 1.01 ± 0.01, n = 32, Wilcoxon rank test p = 10−12, Figure 1C, top panel, orange and black symbols respectively, see also Figure 1—figure supplement 3), and a significant increase in TRPV1 levels compared to vehicle (Mean ± SEM: 1.15 ± 0.02, n = 94 compared to 0.99 ± 0.01, n = 20, Wilcoxon rank test p = 10−6; Figure 1C, bottom panel, orange and black symbols respectively, see also Figure 1—figure supplement 3). Consistent with a PI3K-dependent mechanism, the NGF-induced increases in both PM-associated Akt-PH and TRPV1 were prevented by the PI3K inhibitor wortmannin (20 nM) (Figure 1C and D, magenta, n = 60, Mean ±SEM for Akt-PH – 0.88 ± 0.01 and for TRPV1 – 0.95 ± 0.01; Wilcoxon rank test p value for Akt-PH – 10−13 and for TRPV1 – 10−10).
TIRF microscopy is often discussed as a method that isolates a fluorescence signal at the PM (Axelrod, 1981). Indeed, illumination falls off exponentially with distance from the coverslip (Ambrose, 1961). Nevertheless, with a typical TIRF setup such as that used for this study (see Materials and methods) ~90% of the signal comes from the cytosol (Figure 1—figure supplement 4, also see Materials and methods), assuming the incident light was at the critical angle and that the membrane bilayer and associated protein layer extends up to ~10 nm from the coverslip. The contamination of the TIRF signal with fluorescence from the cytosol leads to an underestimation of the change in PM-associated fluorescence from Akt-PH and TRPV1. Under our experimental conditions, we estimate that the ratio of the total fluorescence intensity measured after and before NGF application, FNGF, of 1.54 translates into about a 10-fold increase in PM-associated fluorescence, Rm (Figure 1—figure supplement 4; see Materials and methods), although this should be considered just a rough estimate.
TRPV1 potentiates NGF-induced PI3K activity
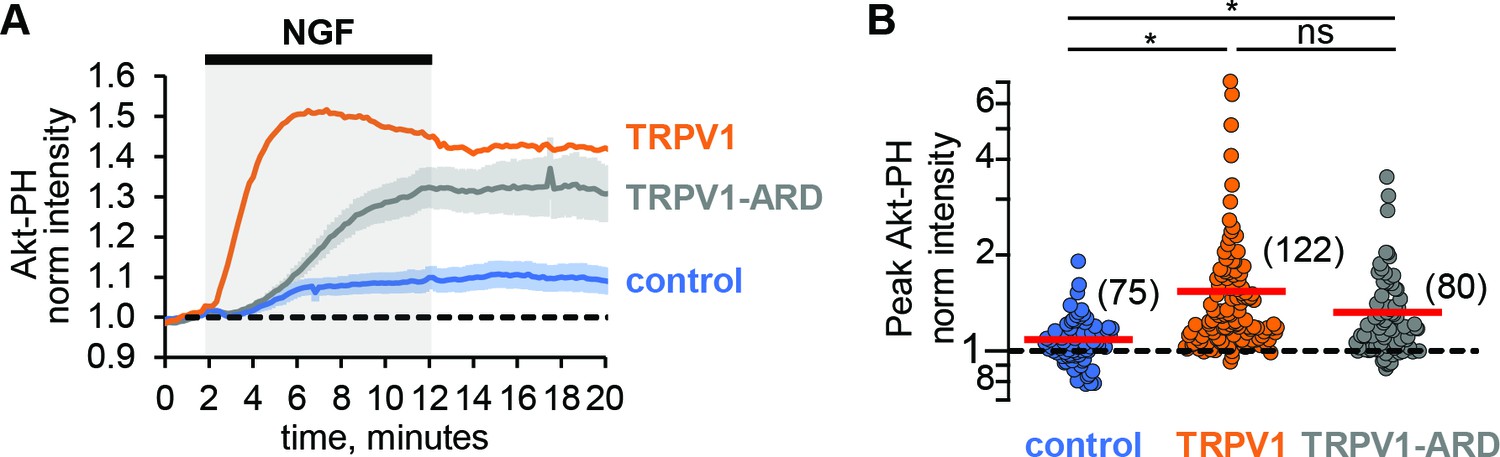
Comparing the NGF-induced increase in Akt-PH in control cells that did not express TRPV1 to that in cells expressing TRPV1, we made an unexpected observation: TRPV1 appeared to potentiate NGF-induced PI3K activity. Comparing the time course of the NGF response in cells without TRPV1 (Figure 2A, blue trace) to cells expressing TRPV1 (Figure 2A, orange), we found a pronounced increase in Akt-PH fluorescence intensity in TRPV1-expressing cells. This increase was statistically significant, with the peak normalized Akt-PH intensity value of 1.08 ± 0.03 (n = 75) in cells without TRPV1 and 1.54 ± 0.08 (n = 122) in cells expressing TRPV1 (Figure 2B, Wilcoxon rank test p = 10−12, see also Figure 2—figure supplement 1A). Interestingly, the dynamics of NGF-induced PI(3,4)P2/PIP3-generation in the absence of TRPV1 were also different in that PI(3,4)P2/PIP3 levels were sustained. As in TRPV1-expressing cells, the NGF-induced increases in PI(3,4)P2/PIP3 levels in control cells were prevented by treatment of cells with wortmannin (Figure 2—figure supplement 2, Mean ± SEM: 0.81 ± 0.02, n = 53; Student’s t-test p-value was 10−16).
Figure 2 with 3 supplements see all
TRPV1-ARD is necessary and sufficient for potentiation of NGF-induced PI3K activity.
(A) Time course of NGF-induced changes in Akt-PH fluorescence intensity. NGF (100 ng/mL) was applied during the times indicated by the black bar/gray shading. Averaged normalized TIRF intensity from cells transfected with TrkA/p75NTR and Akt-PH: control cells without TRPV1 (blue, n = 75), TRPV1 (orange, n = 122), or TRPV1-ARD (gray, n = 80). Traces represent the mean and error bars represent the SEM. TRPV1 data are the same as in Figure 1C, error bars removed for clarity. (B) NGF-induced changes in Akt-PH fluorescence intensity for control cells (blue), cells expressing TRPV1 (orange data are the same as in Figure 1D) and cells transfected with TRPV1-ARD (gray). Averaged normalized TIRF intensity during NGF application (6–8 min). Red bars indicate mean (see Table 2 for values). Asterisks indicate significance of Holm-Bonferroni post-hoc adjusted Wilcoxon rank test p value < 0.001 (see Table 2 for values).
One possible cause for the potentiation of NGF-induced PI3K activity we observed in TRPV1-expressing cells could be a change in PI3K expression levels in TRPV1 vs. control cells. To determine whether this was the case, we performed western blot analysis with an anti-p85α antibody to quantify the PI3K protein levels across transfection conditions. As shown in Figure 2—figure supplement 3A, expression of TRPV1 did not alter the expression level of the p85α subunit of PI3K. We quantified protein expression levels using densitometry, and normalized expression to tubulin, giving the relative expression levels shown in Figure 2—figure supplement 3B. Average relative p85α expression levels were similar between non-TRPV1 expressing cells and cells expressing TRPV1 (n = 5, Student’s t-test p value was 0.95). We conclude that a difference in PI3K expression in TRPV1-expressing vs. control cells did not account for the observed TRPV1-induced potentiation of NGF-stimulated PI3K activity.
The ARD of TRPV1 is sufficient for potentiation of NGF-induced PI3K activity
We have previously shown that the N-terminal region of TRPV1, consisting of 110 amino acids and the ankyrin repeat domain (TRPV1-ARD), interacts directly with the p85 subunit of PI3K in yeast two-hybrid assays, co-immunoprecipitation from cells, and using recombinant fragments in vitro (Stein et al., 2006). We hypothesized that the TRPV1-ARD might also mediate NGF-induced potentiation of PI3K. To determine whether the ARD is sufficient for potentiation of NGF-induced PI3K activity, we expressed the ARD as a fragment and then measured NGF-induced PI3K activity. As shown in Figure 2A (gray trace), NGF induced PI3K activity that was greater in TRPV1-ARD expressing cells than in control cells (blue trace). The increase in peak Akt-PH normalized intensity was statistically significant compared to control cells, with a mean of 1.32 (±0.02, n = 80; Figure 2B; Wilcoxon rank test p = 10−5, see also Figure 2—figure supplement 1B). The kinetics of this potentiation were somewhat slower with TRPV1-ARD compared to TRPV1 (Figure 2A, orange trace), so that Akt-PH reached steady-state levels somewhat later during NGF treatment. Nevertheless, the potentiation of NGF-induced PI3K activity by the ARD fragment was nearly as great as observed with full-length TRPV1 (Wilcoxon rank test p = 0.08). In addition, the ability of a soluble TRPV1 fragment to reconstitute potentiation suggests that the mechanism of potentiation is at least partly allosteric, involving more than just a tethering of PI3K at the membrane by TRPV1.
An orthogonal PI3K assay confirms that TRPV1 potentiates NGF-induced PI3K activity and generation of PI(3,4)P2/PIP3
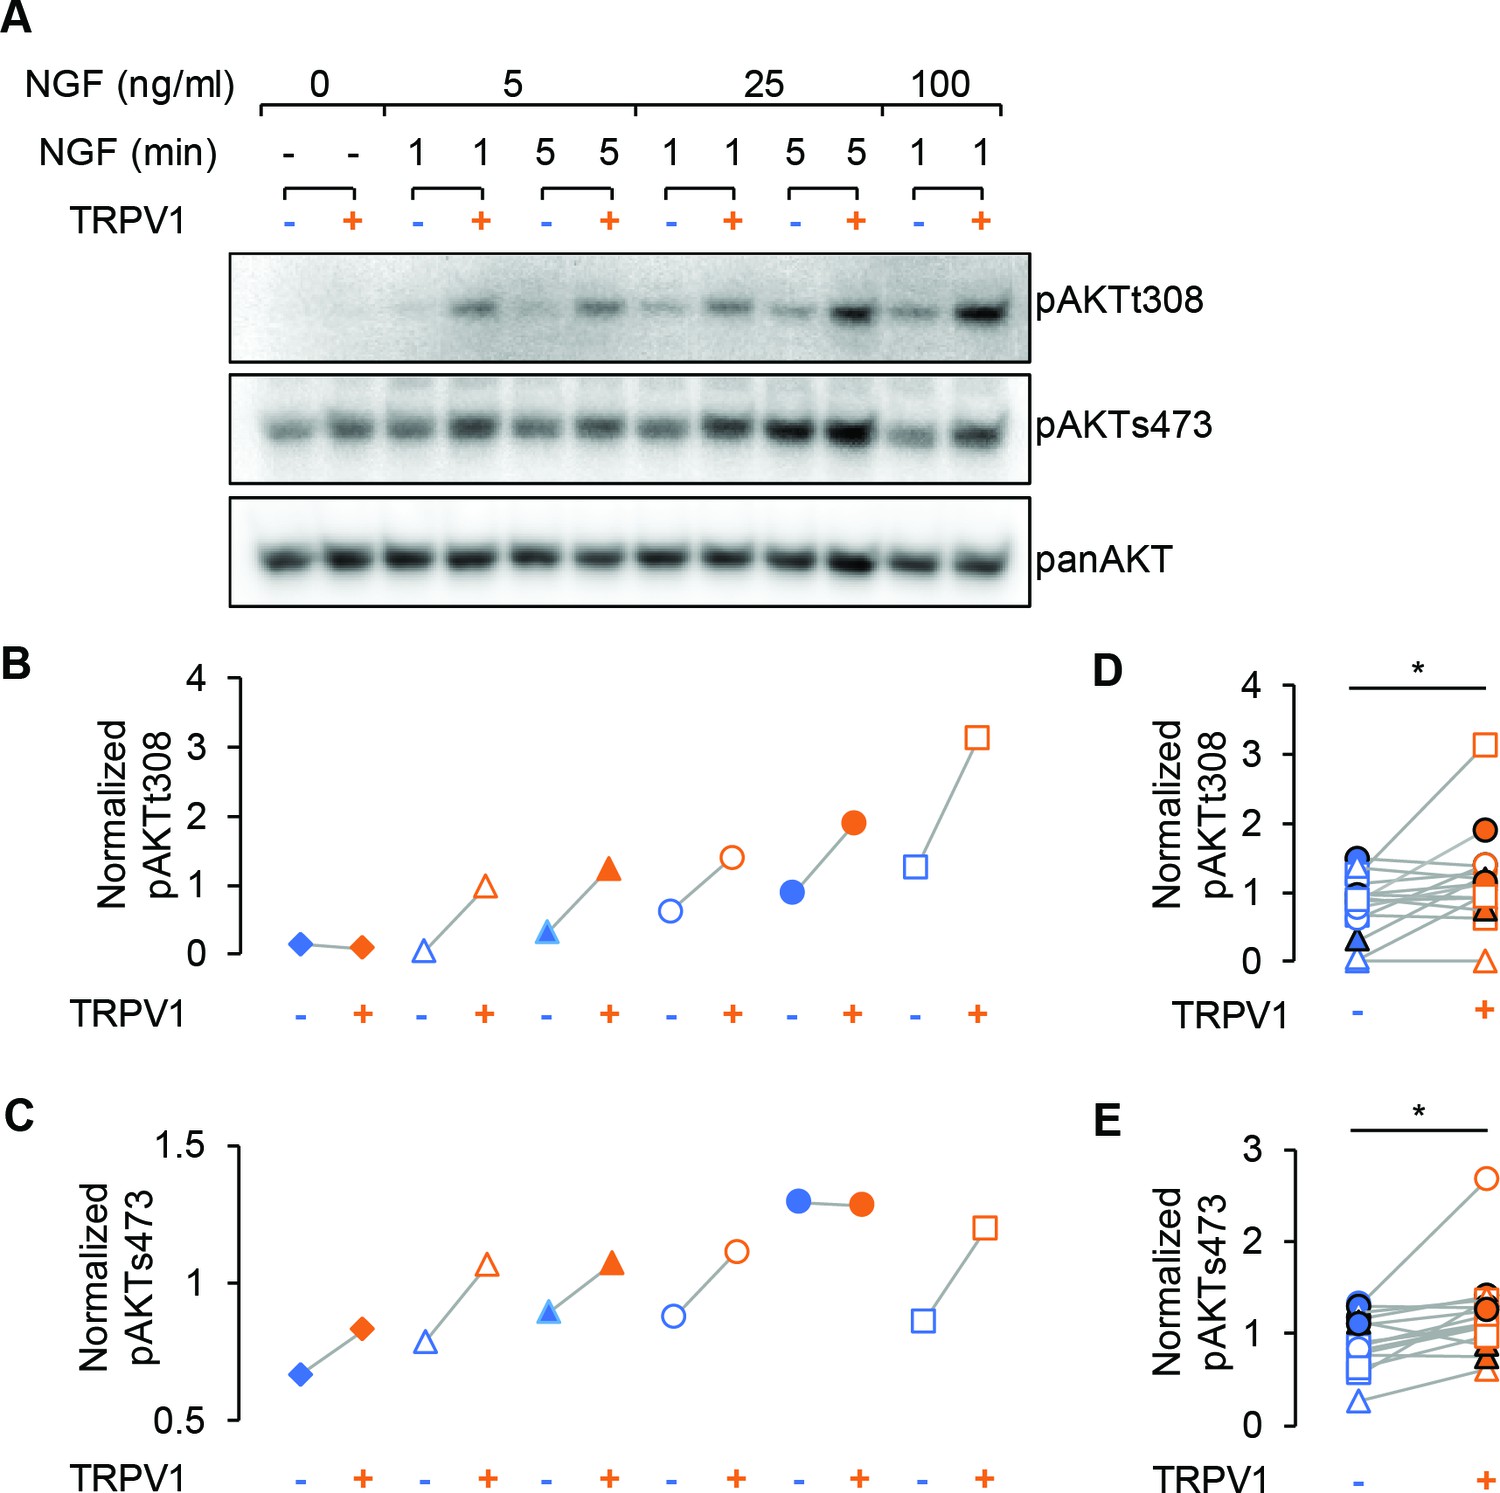
We used the Akt phosphorylation assay described above as an orthogonal method of examining the potentiation of NGF-induced PI3K activity in TRPV1-expressing cells. We performed western blot analysis using phospho-specific Akt antibodies, reprobing the blots with a pan Akt antibody for normalization purposes (Figure 3A). Because phosphorylation at T308 and S473 are differentially regulated, we used three concentrations of NGF (5, 25, and 100 ng/mL) and two incubation times (1 and 5 min). We observed increased phosphorylation at both T308 and S473 in TRPV1-expressing cells compared to control cells for almost all trials with all three NGF concentrations and both time points (Figure 3B,C). The enhanced NGF-induced Akt phosphorylation was statistically significant for both T308 and S473 sites for all conditions pooled together (Figure 3D,E; paired Student’s t-test for T308 p = 0.02 and S473 p = 0.008). Thus, TRPV1 potentiation of NGF-induced PI3K activity is sufficient to enhance PI(3,4)P2 and/or PIP3 levels to increase Akt phosphorylation.
Figure 3
TRPV1 enhances NGF-induced Akt phosphorylation.
(A) Representative immunoblot staining for analysis of Akt phosphorylation in F-11 cells transfected same as in imaging experiments. Cells were treated with indicated dose of NGF for an indicated amounts of time, lysed and loaded on SDS-PAGE. The same membrane was probed with pAKTs473, stripped and re-probed with pAKTt308 and again with panAKT antibodies (see Materials and methods). (B) and (C) Analysis of the representative blots shown in (A). Each band average intensity was normalized to the average of the blot and then divided by that of the corresponding lane of the panAkt blot. Akt phosphorylated at T308 (B) and S473 (C) from control cells (blue symbols) and cells expressing TRPV1 (orange symbols) treated with NGF (5, 25 or 100 ng/ml) for 1 or 5 min as indicated in (A). Triangles represent treatment with NGF 5 ng/ml, circles – 25 ng/m, squares – 100 ng/ml. Open symbols represent treatments for 1 min and filled symbols – 5 min. (D) and (E) Normalized phospho-Akt intensities from all indicated conditions are pooled together for the n = 3 of independent experiments. Paired Student's t-test for pAKTt308 p=0.02 and for pAKTs473 p=0.008.
-
Figure 3—source data 1
Full images of gels in Figure 3.
- https://doi.org/10.7554/eLife.38869.016
Finally, Figure 3 shows that the extent of Akt phosphorylation in unstimulated cells was indistinguishable in control vs. TRPV1-expressing cells at both S308 (IntensitypAkt/pan Akt: 0.075 ± 0.004 for control and 0.076 ± 0.004 for TRPV1, Mean ± SEM, n = 3, paired Student’s t-test p = 0.95) and T473 sites (IntensitypAkt/pan Akt: 0.3 ± 0.24 for control and 0.23 ± 0.14 for TRPV1, Mean ± SEM, n = 3, paired Student’s t-test p = 0.44), indicating that TRPV1 did not perturb the levels of PI(3,4)P2/PIP3 at rest. Importantly, we examined whether NGF-induced phosphorylation at both T308 and S473 required expression of TrkA/p75NTR. NGF-induced phosphorylation of Akt was not observed in cells in which TrkA/p75NTR were not expressed (Figure 1—figure supplement 2). Together with the data using Akt-PH in TIRF microscopy experiments, these data indicate that NGF-induced PI3K activity is greater, and PI(3,4)P2/PIP3 production is greater, in TRPV1-expressing cells than in those that do not express TRPV1.
Potentiation of PI3K and NGF-induced trafficking are conserved among TRPV channels
The ARD of TRPV1 is highly conserved among other members of the TRPV family of ion channels (Gaudet, 2008). Given the sufficiency of the TRPV1 ARD in potentiation of NGF-induced PI3K activity, we postulated that reciprocal regulation among other TRPV family members and PI3K would occur as well. We examined whether other ARD-containing TRP channels, TRPV2 (rat) and TRPV4 (human) were trafficked to the plasma membrane in response to NGF. Using TRPV2 and TRPV4 fused to fluorescent proteins, we found that they were both trafficked to the PM in response to NGF compared to vehicle (Holm-Bonferroni post-hoc adjusted Wilcoxon rank test p < 0.05 see Table 1, Figure 4C,D, see also Figure 4—figure supplement 1 for representative images). In addition, we found that the NGF-induced increase in Akt-PH was significantly greater in TRPV2- and TRPV4-expressing cells compared to control cells (Holm-Bonferroni post-hoc adjusted Wilcoxon rank test p < 0.05 see Table 2, Figure 4A,B). The effects of TRPV2 and TRPV4 on PI(3,4)P2/PIP3 levels were significantly smaller than those elicited by TRPV1 (Holm-Bonferroni post-hoc adjusted Wilcoxon rank test p < 0.05 see Table 2). Further experiments would be required to determine whether the differences were due to differences in expression level, differences in the affinity of PI3K for the TRPV ARDs, or differences in the effect of each ARD on the catalytic activity of PI3K. We conclude that potentiation of NGF-induced PI3K activity and traffic to the PM in response to NGF are conserved among TRPV1, TRPV2, and TRPV4.
Figure 4 with 1 supplement see all

Potentiation of PI3K and NGF-induced trafficking are conserved among TRPV channels.
Time course of NGF-induced changes in fluorescence intensity. NGF (100 ng/mL) was applied during the times indicated by the black bar/gray shading. Traces represent the mean, error bars are SEM. Control and TRPV1 data same as in Figure 2 with error bars removed for clarity. (A) Averaged normalized TIRF intensity of Akt-PH from cells transfected with TrkA/p75NTR and Akt-PH and: (A) no channel (control; blue; n = 75); TRPV1 (orange; n = 122); TRPV2 (black; n = 61); TRPV4 (yellow; n = 29). (B) Averaged normalized Akt-PH intensity during NGF application (6–8 min). The red bars indicate the mean. Asterisks indicate significance (Holm-Bonferroni post-hoc adjusted Wilcoxon rank test p < 0.05, see Table 2 for values). (C) Averaged normalized TIRF intensity of individual TRP channels. Color scheme as in (A) with the cell numbers as follows: TRPV1 (n = 94); TRPV2 (n = 62); TRPV4 (n = 48). (D). Averaged normalized TRP channel intensity during NGF application (8–10 min). The red bars indicate the mean. Asterisks indicate significance (Holm-Bonferroni post-hoc adjusted Wilcoxon rank test p < 0.05, see Table 1 for values).
Table 1
Normalized TRP channel fluorescence intensities measured during NGF application for all discussed conditions.
The number of cells in the data set collected over at least three different experiments is given by n. Non-adjusted Wilcoxon rank test two tail p values was performed for pairwise comparisons as indicated.
| NGF Mean ± SEM | N= | TRPV1 | Vehicle | |
|---|---|---|---|---|
| TRPV1 | 1.15 ± 0.02 | 94 | - | - |
| vehicle | 1.01 ± 0.01 | 20 | 10−6 | - |
| TRPV2 | 1.12 ± 0.02 | 62 | 0.24 | 0.002 |
| TRPV4 | 1.11 ± 0.02 | 48 | 0.13 | 0.002 |
Table 2
Normalized Akt-PH fluorescence intensities measured during NGF application for all discussed conditions.
The number of cells in the data set collected over at least three different experiments is given by n. Non-adjusted Wilcoxon rank test two tail p values for pairwise comparisons as indicated.
| Akt-PH from | NGF Mean ± SEM | N= | Control | TRPV1 |
|---|---|---|---|---|
| control | 1.08 ± 0.03 | 75 | - | - |
| TRPV1 | 1.54 ± 0.8 | 122 | 10−12 | - |
| TRPV1-ARD | 1.32 ± 0.2 | 80 | 10−5 | 0.08 |
| TRPV2 | 1.23 ± 0.18 | 61 | 0.04 | 0.0002 |
| TRPV4 | 1.28 ± 0.14 | 29 | 0.02 | 0.02 |
Increased trafficking of TRPV1 to the cell surface is essential for sensitization to noxious stimuli produced by NGF and other inflammatory mediators (Morenilla-Palao et al., 2004; Ferrandiz-Huertas et al., 2014). Although the involvement of PI3K in NGF-induced sensitization has been known for over a decade (Bonnington and McNaughton, 2003; Stein et al., 2006), the role, if any, of direct binding of TRPV1 and PI3K was unclear. Here, we show that ARD region of TRPV1 that binds PI3K is sufficient to potentiate NGF-induced PI3K activity. Although it is possible that TRPV1 inhibition of the PI(3,4)P2/PIP3 phosphatase PTEN (Malek et al., 2017) could contribute to TRPV1 potentiation of NGF-induced increases in PI(3,4)P2/PIP3 levels, this and other more complex models are not needed to explain our data. In addition, whereas the present work does not rule out that the potentiation of PI3K we describe requires an effector that mediates signaling between the TRPV1 ARD and PI3K, we favor a simpler model in which the previously described direct interaction between TRPV1 and PI3K mediates the signaling. We speculate that, without TRPV1 potentiation of PI3K, NGF signaling would not produce sufficient PI(3,4)P2/PIP3 to promote channel trafficking during inflammation. Future studies that decouple potentiation of PI3K activity from the expression of TRPV channels will be needed to determine whether the reciprocal regulation between ARD-containing TRPV channels and PI3K serves an obligate role in channel sensitization.
Is reciprocal regulation among TRPV channels and PI3K relevant beyond pain signaling? TRPV channels have been proposed to be involved in RTK/PI3K signaling in a variety of cell types (Reichhart et al., 2015; Katanosaka et al., 2014; Jie et al., 2015; Sharma et al., 2017). For example, TRPV2 is co-expressed in muscle cells with the insulin like growth factor receptor (IGFR) and is known to be important in muscle loss during muscular dystrophy (Iwata et al., 2003). The mechanism is believed to involve IGFR activation leading to increased trafficking of TRPV2 to the sarcolemma, Ca2+ overload/cytotoxicity, and cell death (Iwata et al., 2003; Perálvarez-Marín et al., 2013; Katanosaka et al., 2014). Whether TRPV2 potentiates IGF-induced PI3K activity remains to be determined. The co-expression of TRPV channels with RTK/PI3K in other tissues, including nerve (TRPV1/NGF) (Tanaka et al., 2016), muscle (TRPV2/IGF) (Katanosaka et al., 2014) and lung (TRPV4/TGFβ1) (Rahaman et al., 2014) raises the question of whether reciprocal regulation among TRPV channels and PI3K plays a role in RTK signaling in cell development, motility, and/or pathology.
Materials and methods
TIRF microscopy and analysis
Request a detailed protocolFor imaging, we used an inverted microscope (NIKON Ti-E) equipped for total internal fluorescence (TIRF) imaging with a 60x objective (NA 1.49). Glass coverslips with adherent cells were placed in a custom-made chamber. The chamber volume (~1 ml) was exchanged using a gravity-driven perfusion system. Cells were acclimated to flow for at least 15 min prior to NGF application. Akt-PH fused to Cyan Fluorescent Protein (CFP) was imaged using excitation from a 447 nm laser and a 480/40 emission filter. TRPV1 fused to Yellow Fluorescent Protein (YFP) was imaged using the 514 nm line of an argon laser and a 530 long-pass emission filter. Time-lapse images were obtained by taking consecutive CFP and YFP images every 10 s. Movies were then processed using ImageJ software (NIH) (Rasband, 1997). Regions of interest (ROI) were drawn around the footprint of individual cells and the average ROI pixel intensity was measured. Measurements were analyzed using Excel 2013 (Microsoft Corporation), by subtracting the background ROI intensity from the intensity of each cell ROI. Traces were normalized by the average intensity during the 1-min time period prior to NGF application.
Depth of TIRF field and membrane translocation estimation
Request a detailed protocolBecause PI(3,4)P2/PIP3 levels reported by the Akt-PH fluorescence measured with TIRF microscopy include significant contamination from free Akt-PH in the cytosol, we used the characteristic decay of TIRF illumination to estimate the fraction of our signal due to Akt-PH bound to the membrane. We first estimated the fraction of the illumination at the membrane in resting cells, assuming that free Akt-PH is homogeneously distributed throughout the evanescent field. After stimulation with NGF, we then used this fraction of illumination at the membrane to determine the fraction of the emission light originating from this region. The estimation approach used below was not used to quantitatively evaluate our data. Rather, it demonstrates the general issue of cytosolic contamination causing underestimation of changes in membrane-associated fluorescence even when using TIRF microscopy.
The depth of the TIRF field was estimated as described in the literature (Axelrod, 1981; Mattheyses and Axelrod, 2006). Briefly, when laser light goes through the interface between a coverslip with refractive index n2 and saline solution with refractive index n1, it experiences total internal reflection at angles less than the critical incidence angle, θc, given by
The characteristic depth of the illuminated field d is described by
where λ0 is laser wavelength. The illumination decay τ, depends on depth of field as follows:
TIRF illumination intensity, I, is described in terms of distance from the coverslip, h, by
For simplicity, we measured the distance h in ‘layers’, with the depth of each layer corresponding to physical size of Akt-PH, which was estimated to be approximately 10 nm based on the sum of longest dimensions of Akt-PH and GFP in their respective crystal structures (PDB ID: 1UNQ and 1GFL). We solved for TIRF illumination intensity using the following values for our system: refractive indexes of solution n1 = 1.33 and coverslip n3 = 1.53, critical incidence angle θC = 60.8 degrees. The laser wavelength used in our experiments was λ0 = 447 nm, and the experimental angle of incidence was θexp = 63 degrees. This produces a characteristic depth of d63 = 127 nm and an illumination decay of τ63 = 0.008 nm−1. We plot TIRF illumination intensity over distance in molecular layers and nanometers in Figure 1—figure supplement 4.
The values determined above allow us to estimate the contributions to our TIRF signal from the membrane vs. the cytosol. According to our calculation, the TIRF illumination intensity approaches 0 at around 500 nm, or layer h49. We consider the membrane and associated proteins to reside in layer h0. Under these conditions, at rest, 5% of total recorded TIRF fluorescence arises from h0, with the remainder originating from h1-h49. At rest, we assume that Akt-PH molecules are distributed evenly throughout layers h0-h49, with no Akt-PH bound to the membrane because the concentration of PI(3,4)P2/PIP3 in the PM is negligible at rest. Total fluorescence intensity measured before NGF application, Finitial, depends on m, the number of molecules per layer at rest, B, the brightness of a single molecule of CFP, and TIRF illumination intensity, I:
Normalizing our time traces to Finitial, sets Finitial = 1. We solved for m numerically using Excel (Microsoft, Redmond, WA; see Figure 1—figure supplement 4—source data 1), and determined a value of 0.08. We assumed a fixed number of molecules in the field and that the only NGF-induced change was a redistribution of molecules among layers. The total fluorescence intensity measured after NGF application, FNGF, will reflect the redistribution of ∆m molecules between membrane layer h0 and all layers h0-h49, with free Akt-PH homogeneously distributed among these layers. Therefore, FNGF is a sum of fluorescence intensities of the number of bound molecules in the membrane layer h0 and the free molecules in layers h1-h49:
We solved for ∆m using Excel, constraining FNGF to the values we measured for control and TRPV1-expressing cells (data listed in the table in Figure 1—figure supplement 4B). Finally, we estimated the NGF-induced change in Akt-PH bound to the membrane as Rm, the ratio of molecules in h0 after NGF to that before NGF:
We compared Rm values to the FNGF values listed in the table Figure 1—figure supplement 4B. For example, in cells expressing TRPV1, FNGF of 1.54 led to 10 times more membrane-associated Akt-PH molecules. Note, that if we instead allow the number of molecules in cytosolic layers to remain constant as m0 increases with NGF treatment, we calculate an Rm value of 8, very similar to the value of 10 obtained with redistribution of a fixed number of molecules across all layers. Both of these scenarios are independent of the initial Akt-PH fluorescence intensity in a given cell.
Cell culture/transfection/ DNA constructs/solutions
Request a detailed protocolF-11 cells (a gift from M.C. Fishman, Massachusetts General Hospital, Boston, MA; (Francel et al., 1987)) were cultured at 37°C, 5% CO2 in Ham’s F-12 Nutrient Mixture (#11765–054; Gibco) supplemented with 20% fetal bovine serum (#26140–079; Gibco, Grand Island, NY), HAT supplement (100 µM sodium hypoxanthine, 400 nM aminopterin, 16 µM thymidine; #21060–017; Gibco), and penicillin/streptomycin (#17-602E, Lonza, Switzerland). F-11 cells were tested for mycoplasma contamination using Universal Mycoplasma Detection Kit (# ATCC 30–1012K, ATCC, Manassas, VA) and found to be free of contamination. F-11 cells for imaging experiments were plated on Poly-Lysine (#P1274, Sigma, St. Louis, MO) coated 0.15 mm x 25 mm coverslips (#64–0715 (CS-25R15), Warner Instruments, Hamden, CT) in a six-well plate. Cells were transfected with Lipofectamine 2000 (4 µl/well, Invitrogen, Grand Island, NY) reagent using 1–3 µg of cDNA per well. 24 hr post-transfection, media was replaced with HEPES-buffered saline (HBR, double deionized water and in mM: 140 NaCl, 4 KCl, 1 MgCl2, 1.8 CaCl2, 10 HEPES (free acid) and five glucose) for at least 2 hr prior to the imaging. During experiments, cells were treated with 100 ng/ml NGF 2.5S (#13257–019, Sigma), vehicle (HBR) or 20 nM wortmannin (Sigma W1628).
TRPV1-cYFP (rat) (Ufret-Vincenty et al., 2015), TRPV1-ARD-ctagRFP (rat), TRPV2-cYFP (rat) (Mercado et al., 2010) DNA constructs were made in the pcDNA3 vector (Invitrogen), where ‘-n’ or ‘-c’ indicates that the fluorescent protein is on the N- or C-terminus, respectively. TRPV4-EGFP (human) in pEGFP was obtained from Dr. Tim Plant (Charite-Universitatsmedizine, Berlin) (Strotmann et al., 2003). TrkA (rat) in the pcCMV5 vector and p75NTR (rat) in the pcDNA3 vector were obtained from Dr. Mark Bothwell (University of Washington, Seattle). PH-Akt-cCerulean in the pcDNA3-k vector was made based on the construct in the pHR vector from Dr. Orion Weiner's Lab (Toettcher et al., 2011). The function of the ion channels tested were confirmed using Ca2+ imaging and/or patch clamp electrophysiology (data not shown).
Western blotting
Request a detailed protocolFor detection of relative expression of PI3K p85α subunit, cells were transfected as described above for imaging experiments. 24 hr after transfection, cells were scraped off the bottom of 10 cm plates, washed with Phosphate Buffered Saline (PBS) 4 times and homogenized in Lysis buffer (1% Triton 25 mM Tris-HCl, 150 mM NaCl, 1 mM EDTA, pH 7.4) for 2 hr with mixing at 4°C. Lysates were spun down at 14000 rpm for 30 min at 4°C to remove the cell nuclei and debris. Cleared lysates were mixed with Laemmli 2x SDS sample buffer (#161–0737, Bio-Rad, Hercules, CA), boiled for 10 min and subjected to SDS PAGE to separate proteins by size. Gels were then transferred onto the PDVF membrane using Trans-Blot SD semi-dry transfer cell (Bio-Rad) at 15 V for 50 min. Membranes were blocked in 5% BSA Tris-Buffered Saline, 0.1% Tween (TBS-T) for 1 hr and probed with primary antibody for 1 hr at RT. Next, membranes were washed 6x times with TBS-T and probed with secondary antibodies conjugated with Horse Radish Peroxidase (HRP) for 1 hr. After another set of 6 washes membranes were developed by addition of the SuperSignal West Femto HRP substrate (#34096, Thermo, Grand Island, NY) and imaged using CCD camera-enabled imager. For quantification, blot images were analyzed in ImageJ. ROIs of the same size were drawn around the bands for p85 and tubulin, then mean pixel intensity was measured. Mean p85 intensities were normalized by dividing by mean tubulin intensities and plotted in Figure 2—figure supplement 3. Experiments were repeated with n = 5 independent samples. Primary antibodies used were: anti-PI3K (alpha) polyclonal (#06–497 (newer Cat#ABS234), Upstate/Millipore, Burlington, MA) at 1:600 dilution; β Tubulin (G-8) (#sc-55529, Santa Cruz, Dallas, TX) at 1:200 dilution. Secondary antibodies used: Anti-Rabbit IgG (#074–1506, KPL/SeraCare Life Sciences, Milford, MA) at 1:30,000 dilution; Anti-Mouse IgG (#NA931, Amersham/GE Healthcare Life Sciences, United Kingdom) at 1:30,000 dilution.
For detection of phosphorylated Akt, cells plated in six-well plates were treated for the indicated amount of time (Figure 3, Figure 1—figure supplement 2) in the CO2 incubator at 37°C. Immediately after treatment, wells were aspirated and scraped in ice-cold lysis buffer (H2O, TBS, 1% NP-40, 5 mM NaF, 5 mM Na3VO4 with added Protease inhibitors (#P8340, Sigma) and Phosphatase Inhibitor Cocktail 2 (#P5726, Sigma). After incubation on ice for 15 min, lysates were cleared by centrifugation at 15 k g for 15 min at 4°C. Protein contents of cleared lysates were measured using the BCA assay (#23225 Pierce) according to manufacturer’s protocol. Volumes of lysates were adjusted according to these measurements and subjected to SDS-PAGE. Gels were transferred onto PVDF membranes using wet-transfer. Membranes were blocked in TBS-T with 5% milk for 1 hr and incubated overnight at 4°C with one of the following primary antibodies: pAKTs473 clone D9E (#4060, Cell Signaling), pAKTt308 clone 244F9 (#4056, Cell Signaling) . Further procedures were as indicated in the previous paragraph. After development membranes were stripped using Pierce Restore Western Blot stripping buffer (#21059, Thermo Fisher), reprobed with the other anti-phospho-AKT antibody and then stripped and re-probed with panAKT clone 40D4 (#2920, Cell Signaling) antibody at 1:2500 dilution. Data was normalized by diving the average intensity of a band by the average intensity of a blot and then dividing by that of a pan-Akt blot (Figure 3).
Data availability
All data generated or analysed during this study are included in the manuscript and supporting files.
References
-
The movements of fibrocytesExperimental Cell Research 8:54–73.https://doi.org/10.1016/0014-4827(61)90340-8
-
Phosphatidylinositol 3-kinase and its novel product, phosphatidylinositol 3-phosphate, are present in Saccharomyces cerevisiaeThe Journal of Biological Chemistry 264:20181–20184.
-
Cell-substrate contacts illuminated by total internal reflection fluorescenceThe Journal of Cell Biology 89:141–145.https://doi.org/10.1083/jcb.89.1.141
-
Protons activate a cation conductance in a sub-population of rat dorsal root ganglion neuronesThe Journal of Physiology 433:145–161.https://doi.org/10.1113/jphysiol.1991.sp018419
-
Signalling pathways involved in the sensitisation of mouse nociceptive neurones by nerve growth factorThe Journal of Physiology 551:433–446.https://doi.org/10.1113/jphysiol.2003.039990
-
Shc binding to nerve growth factor receptor is mediated by the phosphotyrosine interaction domainJournal of Biological Chemistry 270:15125–15129.https://doi.org/10.1074/jbc.270.25.15125
-
NGF-stimulated retrograde transport of trkA in the mammalian nervous systemThe Journal of Cell Biology 130:149–156.https://doi.org/10.1083/jcb.130.1.149
-
A primer on ankyrin repeat function in TRP channels and beyondMolecular BioSystems 4:372–379.https://doi.org/10.1039/b801481g
-
Endocytosis of activated TrkA: evidence that nerve growth factor induces formation of signaling endosomesThe Journal of Neuroscience 16:7950–7964.https://doi.org/10.1523/JNEUROSCI.16-24-07950.1996
-
The effects of inflammation and inflammatory mediators on nociceptive behaviour induced by ATP analogues in the ratBritish Journal of Pharmacology 126:326–332.https://doi.org/10.1038/sj.bjp.0702258
-
Signalling through Class I PI3Ks in mammalian cellsBiochemical Society Transactions 34:647–662.https://doi.org/10.1042/BST0340647
-
Emerging evidence of signalling roles for PI(3,4)P2 in Class I and II PI3K-regulated pathwaysBiochemical Society Transactions 44:307–314.https://doi.org/10.1042/BST20150248
-
A novel mechanism of myocyte degeneration involving the Ca2+-permeable growth factor-regulated channelThe Journal of Cell Biology 161:957–967.https://doi.org/10.1083/jcb.200301101
-
Emerging targets in neuroinflammation-driven chronic painNature Reviews. Drug Discovery 13:533–548.https://doi.org/10.1038/nrd4334
-
A novel mechanism for bradykinin production at inflammatory sites. Diverse effects of a mixture of neutrophil elastase and mast cell tryptase versus tissue and plasma kallikreins on native and oxidized kininogensThe Journal of Biological Chemistry 273:33224–33229.https://doi.org/10.1074/jbc.273.50.33224
-
The effects of extracellular pH on immune functionJournal of Leukocyte Biology 69:522–530.https://doi.org/10.1189/jlb.69.4.522
-
Membrane recognition by phospholipid-binding domainsNature Reviews Molecular Cell Biology 9:99–111.https://doi.org/10.1038/nrm2328
-
Direct measurement of the evanescent field profile produced by objective-based total internal reflection fluorescenceJournal of Biomedical Optics 11:014006.https://doi.org/10.1117/1.2161018
-
Regulated exocytosis contributes to protein kinase C potentiation of vanilloid receptor activityJournal of Biological Chemistry 279:25665–25672.https://doi.org/10.1074/jbc.M311515200
-
TRPV4 mediates myofibroblast differentiation and pulmonary fibrosis in miceJournal of Clinical Investigation 124:5225–5238.https://doi.org/10.1172/JCI75331
-
BookImage J.U.S. National Institute of HealthMaryland: Scientific research an academic publisher.
-
Regulation of surface expression of TRPV2 channels in the retinal pigment epitheliumGraefe's Archive for Clinical and Experimental Ophthalmology 253:865–874.https://doi.org/10.1007/s00417-014-2917-7
-
TRPV4 ion channel is a novel regulator of dermal myofibroblast differentiationAmerican Journal of Physiology-Cell Physiology 312:C562–C572.https://doi.org/10.1152/ajpcell.00187.2016
-
Phosphoinositide 3-kinase binds to TRPV1 and mediates NGF-stimulated TRPV1 trafficking to the plasma membraneThe Journal of General Physiology 128:509–522.https://doi.org/10.1085/jgp.200609576
-
Ca2+-dependent potentiation of the nonselective cation channel TRPV4 is mediated by a C-terminal calmodulin binding siteThe Journal of Biological Chemistry 278:26541–26549.https://doi.org/10.1074/jbc.M302590200
-
Activation and activators of TRPV1 and their pharmaceutical implicationCurrent Pharmaceutical Design 11:2687–2698.https://doi.org/10.2174/1381612054546789
-
Prostanoid release by macrophages at a distance from an inflammatory siteBritish Journal of Experimental Pathology 70:525–531.
-
Mechanism for phosphoinositide selectivity and activation of TRPV1 ion channelsThe Journal of General Physiology 145:431–442.https://doi.org/10.1085/jgp.201511354
-
The emerging mechanisms of isoform-specific PI3K signallingNature Reviews Molecular Cell Biology 11:329–341.https://doi.org/10.1038/nrm2882
-
NGF rapidly increases membrane expression of TRPV1 heat-gated ion channelsThe EMBO Journal 24:4211–4223.https://doi.org/10.1038/sj.emboj.7600893
Article and author information
Author details
Anastasiia Stratiievska

Funding
National Eye Institute (R01EY017564)
- Sharona E Gordon
National Institute of General Medical Sciences (R01GM100718)
- Sharona E Gordon
National Institute of General Medical Sciences (R01GM125351)
- Sharona E Gordon
University of Washington (Royalty Research Fund)
- Sharona E Gordon
National Institute of Mental Health (R01MH113545)
- Stephen EP Smith
National Institute of Biomedical Imaging and Bioengineering (T32EB001650)
- Anastasiia Stratiievska
National Institutes of Health (S10RR025429)
- Sharona E Gordon
National Institutes of Health (P30DK017047)
- Sharona E Gordon
National Institutes of Health (P30EY001730)
- Sharona E Gordon
The funders had no role in study design, data collection and interpretation, or the decision to submit the work for publication.
Acknowledgements
We thank Mika Munari, Gilbert Martinez, Mark Bothwell, Bertil Hille, William Zagotta, Shao-En Ong, Tamara Rosenbaum and Gaby Bergollo for helpful discussions. We are grateful to the following individuals for providing cDNA constructs: Dr. Tim Plant (Charite-Universitatsmedizine, Berlin) for TRPV4; Dr. Mark Bothwell (University of Washington, Seattle) for TrkA and p75NTR; and Dr. Orion Weiner (UCSF) for PH-Akt.
Research reported in this publication was supported by the National Eye Institute of the National Institutes of Health under award numbers R01EY017564 (to SEG), by the National Institute of General Medical Sciences of the National Institutes of Health under award numbers R01GM100718 and R01GM125351 (to SEG), by the National Institute of Mental Health under award number R01MH113545 (to SEPS), by the National Institute of Biomedical Imaging and Bioengineering of the National Institutes of Health under award number T32EB001650 (to AS), by the following additional awards from the National Institutes of Health: S10RR025429, P30DK017047, and P30EY001730. and by a Royalty Research Fund Award from the University of Washington (to SEG). The content is solely the responsibility of the authors and does not necessarily represent the official views of the National Institutes of Health. The authors declare no competing financial interests.
Version history
- Received: June 2, 2018
- Accepted: December 6, 2018
- Accepted Manuscript published: December 18, 2018 (version 1)
- Version of Record published: December 31, 2018 (version 2)
Copyright
© 2018, Stratiievska et al.
This article is distributed under the terms of the Creative Commons Attribution License, which permits unrestricted use and redistribution provided that the original author and source are credited.
Metrics
-
- 2,117
- views
-
- 354
- downloads
-
- 17
- citations
Views, downloads and citations are aggregated across all versions of this paper published by eLife.
Download links
A two-part list of links to download the article, or parts of the article, in various formats.
Downloads (link to download the article as PDF)
Open citations (links to open the citations from this article in various online reference manager services)
Cite this article (links to download the citations from this article in formats compatible with various reference manager tools)
Reciprocal regulation among TRPV1 channels and phosphoinositide 3-kinase in response to nerve growth factor
eLife 7:e38869.
https://doi.org/10.7554/eLife.38869
Further reading
-
- Biochemistry and Chemical Biology
- Cell Biology
Mediator of ERBB2-driven Cell Motility 1 (MEMO1) is an evolutionary conserved protein implicated in many biological processes; however, its primary molecular function remains unknown. Importantly, MEMO1 is overexpressed in many types of cancer and was shown to modulate breast cancer metastasis through altered cell motility. To better understand the function of MEMO1 in cancer cells, we analyzed genetic interactions of MEMO1 using gene essentiality data from 1028 cancer cell lines and found multiple iron-related genes exhibiting genetic relationships with MEMO1. We experimentally confirmed several interactions between MEMO1 and iron-related proteins in living cells, most notably, transferrin receptor 2 (TFR2), mitoferrin-2 (SLC25A28), and the global iron response regulator IRP1 (ACO1). These interactions indicate that cells with high MEMO1 expression levels are hypersensitive to the disruptions in iron distribution. Our data also indicate that MEMO1 is involved in ferroptosis and is linked to iron supply to mitochondria. We have found that purified MEMO1 binds iron with high affinity under redox conditions mimicking intracellular environment and solved MEMO1 structures in complex with iron and copper. Our work reveals that the iron coordination mode in MEMO1 is very similar to that of iron-containing extradiol dioxygenases, which also display a similar structural fold. We conclude that MEMO1 is an iron-binding protein that modulates iron homeostasis in cancer cells.
-
- Biochemistry and Chemical Biology
- Structural Biology and Molecular Biophysics
NADPH oxidases (NOX) are transmembrane proteins, widely spread in eukaryotes and prokaryotes, that produce reactive oxygen species (ROS). Eukaryotes use the ROS products for innate immune defense and signaling in critical (patho)physiological processes. Despite the recent structures of human NOX isoforms, the activation of electron transfer remains incompletely understood. SpNOX, a homolog from Streptococcus pneumoniae, can serves as a robust model for exploring electron transfers in the NOX family thanks to its constitutive activity. Crystal structures of SpNOX full-length and dehydrogenase (DH) domain constructs are revealed here. The isolated DH domain acts as a flavin reductase, and both constructs use either NADPH or NADH as substrate. Our findings suggest that hydride transfer from NAD(P)H to FAD is the rate-limiting step in electron transfer. We identify significance of F397 in nicotinamide access to flavin isoalloxazine and confirm flavin binding contributions from both DH and Transmembrane (TM) domains. Comparison with related enzymes suggests that distal access to heme may influence the final electron acceptor, while the relative position of DH and TM does not necessarily correlate with activity, contrary to previous suggestions. It rather suggests requirement of an internal rearrangement, within the DH domain, to switch from a resting to an active state. Thus, SpNOX appears to be a good model of active NOX2, which allows us to propose an explanation for NOX2’s requirement for activation.


