Genetic analysis of the Arabidopsis TIR1/AFB auxin receptors reveals both overlapping and specialized functions
- Section of Cell and Developmental Biology, University of California San Diego, United States
- Plant Molecular and Cellular Biology Laboratory and Integrative Biology Laboratory, Salk Institute for Biological Studies, United States
- Plant and Crop Sciences, School of Biosciences, University of Nottingham, United Kingdom
Abstract
The TIR1/AFB auxin co-receptors mediate diverse responses to the plant hormone auxin. The Arabidopsis genome encodes six TIR1/AFB proteins representing three of the four clades that were established prior to angiosperm radiation. To determine the role of these proteins in plant development we performed an extensive genetic analysis involving the generation and characterization of all possible multiply-mutant lines. We find that loss of all six TIR1/AFB proteins results in early embryo defects and eventually seed abortion, and yet a single wild-type allele of TIR1 or AFB2 is sufficient to support growth throughout development. Our analysis reveals extensive functional overlap between even the most distantly related TIR1/AFB genes except for AFB1. Surprisingly, AFB1 has a specialized function in rapid auxin-dependent inhibition of root growth and early phase of root gravitropism. This activity may be related to a difference in subcellular localization compared to the other members of the family.
Introduction
The phytohormone auxin regulates diverse processes throughout the entire plant life cycle. Auxin acts as a signal to promote cell differentiation during morphogenetic events such as embryogenesis, root development, and shoot organ formation. Auxin also mediates responses to environmental cues such as light, gravity, water availability, and pathogens. Auxin regulation of transcription involves three families of proteins; AUXIN RESPONSE FACTOR (ARF) transcription factors, Aux/IAA transcriptional repressors, and TRANSPORT INHIBITOR RESPONSE1 (TIR1)/AUXIN-SIGNALING F-BOX (AFB) proteins. Auxins, of which indole-3-acetic acid (IAA) is the predominant natural form, are perceived by a co-receptor complex consisting of TIR1/AFB and Aux/IAA proteins. Formation of the co-receptor complex leads to degradation of the Aux/IAA protein and activation of ARF-dependent transcription (Reviewed in Lavy and Estelle, 2016). In addition to this established pathway, recent studies demonstrate that the TIR1/AFB proteins are required for very rapid auxin responses in the root and in developing root hairs that are independent of transcription (Dindas et al., 2018; Fendrych et al., 2018). The details of TIR1/AFB function in these rapid responses are currently unknown, but in the root, the response is thought to be important for early events in gravitropism.
Members of the TIR1/AFB protein family are encoded by three pairs of paralogs in the Arabidopsis thaliana genome. Each protein contains an amino-terminal F-Box followed by eighteen leucine-rich repeats (LRRs). Only tir1, afb2, and afb5 mutants have been identified in forward-genetic screens (Ruegger et al., 1997; Ruegger et al., 1998; Alonso et al., 2003; Walsh et al., 2006; Parry et al., 2009), but reverse-genetic analyses revealed functional redundancies between TIR1, AFB2, and AFB3 as well as between AFB4 and AFB5 (Dharmasiri et al., 2005; Prigge et al., 2016).
Gene duplication events provide the primary source material for the evolution of biological innovation. In plants, whole genome duplication (WGD) events have been especially important with events preceding the radiation of several key plant lineages including seed plants, flowering plants, and core eudicots (Jaillon et al., 2007; Jiao et al., 2011; Clark and Donoghue, 2018). Following duplication, the paralogs are often redundant, allowing one copy to degenerate into a pseudogene (Lynch and Conery, 2000). In Arabidopsis, the average half-life of a duplicate gene has been estimated at 17.3 million years (Lynch and Conery, 2003). In many cases, however, both duplicates are retained for one or a combination of reasons (reviewed in Panchy et al., 2016). Occasionally, one of the paralogs evolves a novel function (neofunctionalization), but often the two paralogs fulfill different aspects (enzymatically, temporally, or spatially) of the role of the ancestral gene (subfunctionalization). Following subfunctionalization, there may be changes in selective pressure allowing each paralog to evolve specialized functions without affecting functions carried out by the other paralog. This mechanism likely played a prominent role in the evolution of plant gene families and, in turn, in the radiation and diversification of land plants.
The TIR1/AFB, Aux/IAA, and ARF gene families expanded during land plant evolution after the divergence of bryophytes and vascular plants (Remington et al., 2004; Rensing et al., 2008; Mutte et al., 2018). Because auxin has a central role in many important adaptations that occurred during land plant evolution, such as vascular development, lateral root formation, and organ polarity; it seems likely that the acquisition of new roles for auxin was enabled by the duplication and diversification of these three gene families. Here we present the comprehensive genetic analysis of the TIR1/AFB gene family of Arabidopsis which revealed extensive functional overlap between even distantly related members as well as an essential role for the TIR1/AFB pathway in early embryos. In contrast the AFB1 protein appears to have adopted a special role in a rapid auxin response in the root.
Results
Major lineages of auxin receptors diverged prior to the fern–seed plant split
To better understand the timeframe during which the auxin receptor family diversified, we built upon previous phylogenetic analyses (Parry et al., 2009; Mutte et al., 2018) with more taxon sampling at key nodes. As shown earlier (Hori et al., 2014; Mutte et al., 2018), the TIR1/AFB genes likely evolved from a gene encoding an F-Box/LRR protein similar to those present in the genomes of extant streptophyte algae. These algal proteins form a sister clade to three distinct land plant F-Box families, the TIR1/AFB auxin receptors, the COI1 jasmonate-Ile (or dinor-OPDA) receptors, and the ‘XFB’ clade of unknown function conserved in the genomes of mosses and some lycophytes but not in other land plants (Prigge et al., 2010; Bowman et al., 2019). While the last common ancestors of land plants and of vascular plants had only one TIR1/AFB gene, three clades of auxin receptors were established prior to the radiation of euphyllophytes (ferns plus seed plants) over 400 million years ago (Morris et al., 2018; Figure 1—figure supplement 1A). Another gene duplication event prior to angiosperm radiation split the TIR1/AFB1 clade from the AFB2/AFB3 clade. Receptors from each of the four clades are not retained in the genome of every flowering plant. For example, AFB6 orthologs are not present in the genomes of core Brassicales species—including Arabidopsis—nor those of Poaceae species including rice and maize. The gene duplication event establishing the distinct TIR1 and AFB1 clades is coincident with the At-β WGD event at the base of Brassicales, while both the AFB2/AFB3 and the AFB4/AFB5 duplication events coincide with the more recent At-α WGD prior to divergence of the Brassicaceae family (Figure 1—figure supplement 1A; Schranz and Mitchell-Olds, 2006).
One noteworthy aspect of the phylogenetic tree is the pronounced branch-length asymmetry within the TIR1+AFB1 clade (Figure 1—figure supplement 1). Since the last common ancestor of Arabidopsis (Brassicaceae) and Tarenaya (Cleomaceae), the AFB1 gene has accumulated over three times as many non-synonymous changes as TIR1 (Figure 1—figure supplement 1B) despite being under selection based on the ratio of non-synonymous and synonymous substitutions (Delker et al., 2010; Wright et al., 2017). AFB1 also differs from the other TIR1/AFBs in that it contains two of three substitutions in the first α-helix of the F-Box that were each previously shown to weaken TIR1’s interaction with CUL1 (Yu et al., 2015). The substitution with the largest effect, Glu8Lys (equivalent to Glu12Lys in TIR1), appeared shortly after the At-β WGD that produced AFB1, and the Phe14Leu substitution appeared prior to the crown group of the Brassicaceae family (Figure 1—figure supplement 1C). Interestingly, AFB1 orthologs from members of the Camelina genus—C. sativa (all three homeologs), C. laxa, C. hispida, and C. rumelica—additionally contain the third substitution (Figure 1—figure supplement 1C).
Genetic analysis of the Arabidopsis TIR1/AFB gene family revealed extensive functional overlap
Previous studies have assessed the functional overlap between the TIR1, AFB1, AFB2 and AFB3 genes (Dharmasiri et al., 2005; Parry et al., 2009) and separately between the AFB4 and AFB5 genes (Prigge et al., 2016). To study the genetic interactions between all members of the family, and to determine the effects of the complete absence of TIR1/AFB-mediated auxin signaling, lines with strong loss-of-function mutations in the six TIR1/AFB genes were intercrossed to generate all sixty-three mutant combinations. We used the following alleles tir1-1, afb1-3, afb2-3, afb3-4, afb4-8, and afb5-5 (Figure 1—figure supplement 2A; (Ruegger et al., 1998; Parry et al., 2009; Prigge et al., 2016). The tir1-1 allele, which causes an amino acid substitution within the leucine-rich repeat domain of the protein, has been reported to act as a dominant-negative allele (Dezfulian et al., 2016; Wright et al., 2017). However, we found that the root elongation phenotype of plants heterozygous for the tir1-1, tir1-10, and tir1-9 alleles were not significantly different from each other and each displays a semi-dominant phenotype (Figure 1—figure supplement 2B). These results argue against a dominant negative effect for tir1-1 since neither tir1-9 or tir1-10 produce detectable levels of transcript (Ruegger et al., 1998; Parry et al., 2009). Nevertheless, because it is possible that a dominant-negative effect might be revealed in higher-order mutants and because the afb2-3 allele may not be a complete null allele (Parry et al., 2009), we generated selected mutant combinations also using the tir1-10 (Parry et al., 2009) and the afb2-1 (Dharmasiri et al., 2005) T-DNA insertion alleles. The afb2-1 allele was introgressed from the Ws-2 background into the Col-0 background through at least eight crosses. For brevity, mutant line names will be simplified such that ‘tir1afb25’ corresponds to the tir1-1 afb2-3 afb5-5 triple mutant line, for example, unless other allele numbers are specified.
The sixty-three mutant combinations displayed a wide range of phenotypes from indistinguishable from wild type to early-embryo lethality (Figure 1—figure supplement 3; Supplementary file 1). The non-lethal higher-order mutant combinations displayed a cohort of phenotypes associated with mutants defective in auxin signaling: smaller rosettes, reduced inflorescence height, reduced apical dominance, fewer lateral roots, and partially or wholly valveless gynoecia (Figure 1; Figure 1—figure supplement 3; Supplementary file 1). The three viable quintuple mutants—tir1afb1245, tir1afb1345, and afb12345—had rosettes approximately half the diameter and inflorescences less than half the height of WT Col-0. Despite being smaller, these lines produced approximately twice as many branches as WT (Figure 1A; Figure 1—figure supplement 3; Supplementary file 1). Remarkably, lines retaining only one copy of TIR1 (tir1/+ afb12345) or one copy of AFB2 (afb2/+ tir1afb1345) were viable. The rosettes of these two lines were much smaller than those of WT plants with the tir1/+ afb12345’s rosette phenotype being slightly more severe (Figure 1B). In contrast, afb2/+ tir1afb1345 plants developed shorter primary inflorescences and appeared to completely lack apical dominance as all axillary meristems became active upon flowering. The afb2/+ tir1afb1345 and tir1/+ afb12345 plants rarely produced seeds. Lines containing the alternate alleles—afb2-1/+ tir1-10 afb1345 and tir1-10/+ afb2-1 afb1345—displayed phenotypes indistinguishable from the corresponding lines (Figure 1B).
Figure 1 with 4 supplements see all
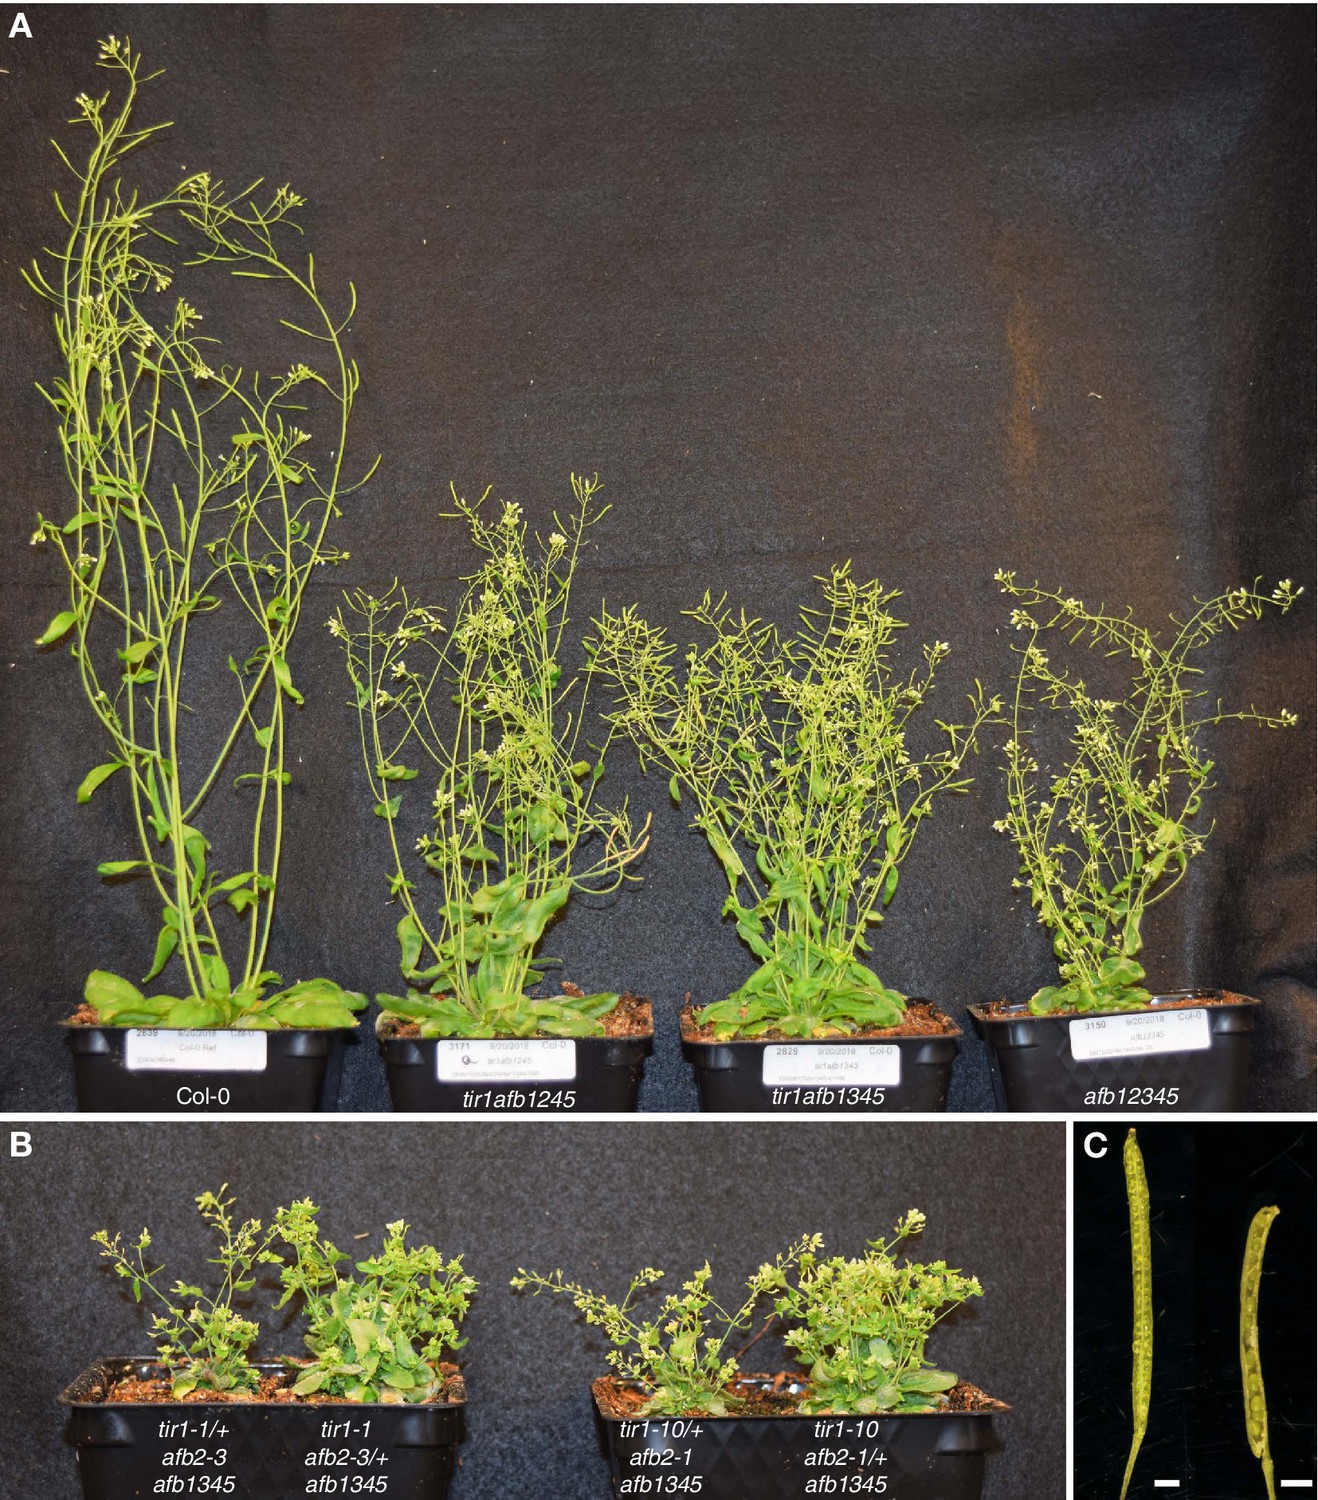
tir1/afb mutant lines exhibit a range of shoot phenotypes.
(A) The viable quintuple mutants, tir1afb1245, tir1afb1345, and afb12345, are each approximately half the height of Col-0 WT, but differ in other phenotypes. Note the curved silique tips of the tir1afb1245 mutant (indicative of gynoecium defects) and the short siliques (due to poor fertility) of the afb12345 mutant. (B) Lines with only one TIR1+ or one AFB2+ allele display similar phenotypes regardless of the mutant tir1 and afb2 alleles: left to right, tir1-1/+ afb2-3 afb1345, tir1-1 afb2-3/+ afb1345, tir1-10/+ afb2-1 afb1345, and tir1-10 afb2-1/+ afb1345. (C) Normal siliques (Col-0, left) have two valves containing developing seeds while 32% of tir1afb1245 siliques have only one. The adaxial half of the valve walls were removed to reveal the developing seeds. Scale bars are 1 mm. Plants were grown for 42 days at 22°C and 16 hr daylength.
Auxin plays an important role in many aspects of root development. To begin to assess the role of the TIR1/AFBs during root growth, we measured the effect of exogenous IAA on primary root growth in the mutant lines. The responses ranged from indistinguishable from WT to nearly insensitive to 0.5 µM IAA (Figure 1—figure supplement 3E), where the roots of lines containing the tir1 and afb2 mutations displayed strong IAA resistance (Dharmasiri et al., 2005; Parry et al., 2009). In addition, we found that the afb3 and afb5 mutations had substantial effects on auxin response, while the afb4 mutation had a more modest effect. The mutant lines also responded similarly to exogenous auxin with respect to lateral root production. The lines more resistant to IAA in the root elongation assay tended to produce fewer lateral roots (Figure 1—figure supplement 3D and E).
Combinatorial mutant analyses revealed roles for TIR1/AFB family members except AFB1
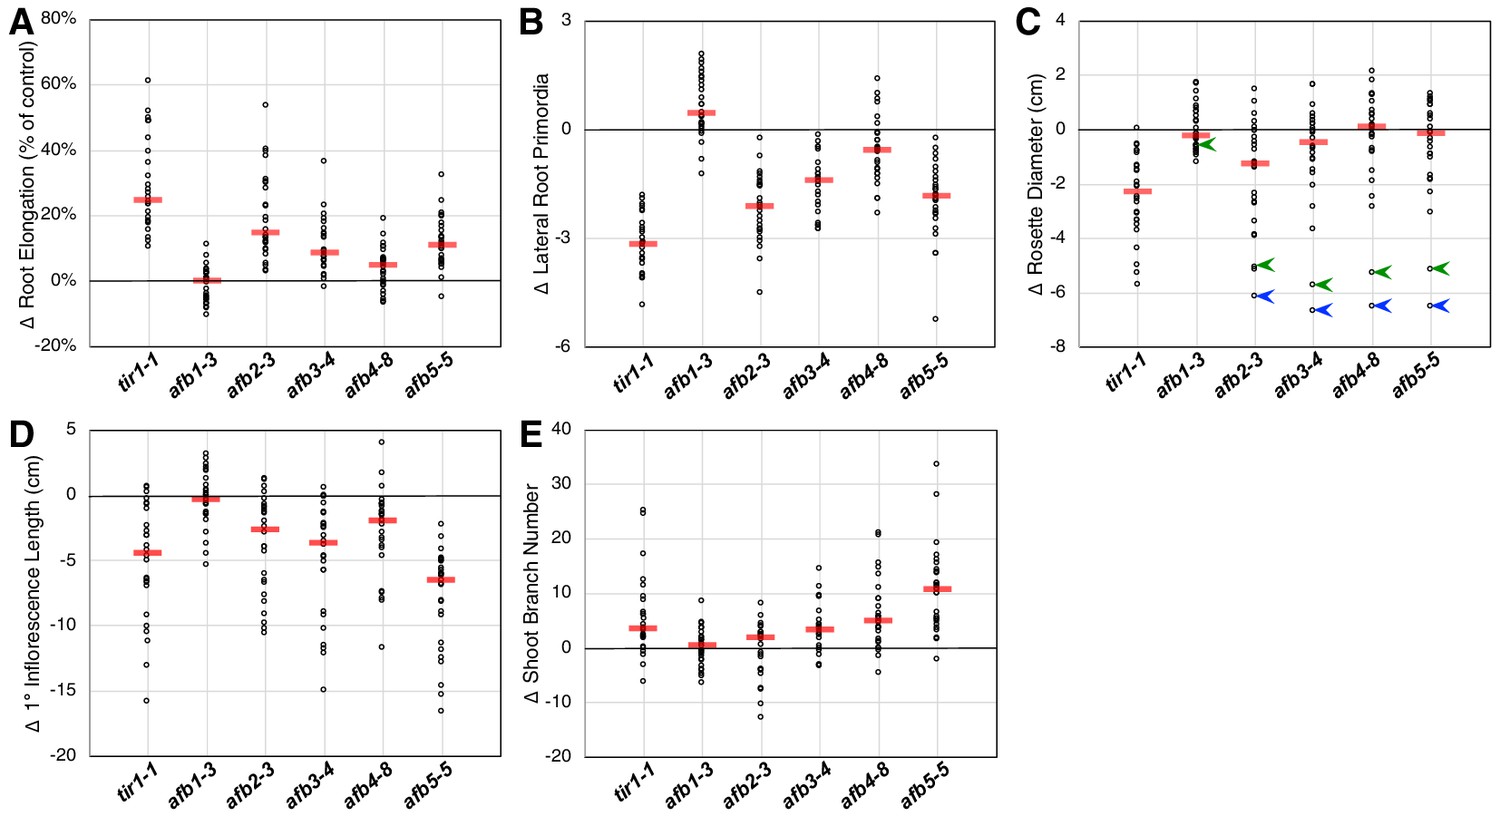
Each of the tir1/afb mutations, except for afb1, affected the above-described phenotypes but to varying extents. To appraise the effects of each mutation on several plant phenotypes, we plotted the mean values for each phenotype minus that of the corresponding line without that mutation. Larger effects are indicated by greater deviations from zero. For both the root elongation assay and the induction of lateral root primordia, the tir1 allele had the largest effect with the afb2, afb5, afb3, and afb4 mutations having smaller median effects (Figure 2A and B). The afb1 mutation had little or no effect on root elongation but, surprisingly, had an opposite effect on lateral root formation.
Figure 2
Relative TIR1/AFB gene effects.
For each of the five phenotype measurements (Figure 1—figure supplement 3), the normalized mean for each genotype with the given mutation was subtracted from the normalized mean for the corresponding genotype lacking that mutation and plotted (circles). The red bars indicate the median difference attributable to the given mutation. (A) Effects of each mutation on IAA-inhibition of root elongation. For each genotype, twelve five-day-old seedlings were transferred and grown for three days on media containing 100 nM IAA, and their average growth was divided by that of twelve seedlings grown on media lacking added auxin. (B) Effects of each mutation on auxin-induced lateral root production. Twelve five-day-old seedlings for each genotype were grown for four days on media containing 100 nM IAA and the numbers of emerged lateral roots were counted. (C) Effects of each mutation on the average rosette diameters of five 42 day old plants. The blue arrowheads indicate difference in phenotypes between the afb2345 quadruple mutant and the four triple mutants, and the green arrowheads indicate those for the afb12345 quintuple mutant and the five quadruple mutants. (D) Effects of each mutation on the average height of the primary inflorescences for five 42 day old plants. (E) Effects of each mutation on the average number of inflorescence branches (≥1 cm) on five 42 day old plants.
Only tir1 and, to a lesser degree, afb2 affect rosette diameter in most contexts with the median effects for afb3, afb4, and afb5 being very close to zero (Figure 2C). However, they have huge collective effects, where the afb2345 quadruple mutant is over 6 cm smaller than each of the four triple mutants (blue arrowheads; Figure 2C). Consistent with previous reports that AFB5 plays a key role in regulating inflorescence branching and height (Prigge et al., 2016; Ligerot et al., 2017), the afb5 mutation has the largest effect on these phenotypes, although each mutation, except for afb1, had some effect (Figure 2D and E).
While the afb1 mutation had minimal effect on most aspects of plant growth, it suppressed the lateral root phenotype of some mutant lines both with and without auxin treatment (Figure 2B; below). We found that the afb1 mutation suppressed the phenotype of both the afb234 (2.15 ± 0.13 versus 1.75 ± 0.10 lateral roots/cm) and afb345 triple mutants (3.10 ± 0.13 versus 1.96 ± 0.14 lateral roots/cm) measured after 12 days on media not supplemented with IAA. This behavior was not observed in an otherwise WT background (2.76 ± 0.11 for afb1 versus 3.23 ± 0.15 lateral roots/cm for Col-0) nor in a tir1-1 background (1.75 ± 0.08 versus 2.34 ± 0.09 lateral roots/cm for tir1). Each of the pairs were significantly different (two-tailed t-test, p<0.03).
Penetrance of tir1/afb embryonic root formation defect is temperature sensitive
The tir1afb23 and tir1afb123 lines were previously shown to display a variably penetrant phenotype in which seedlings lack roots, lack both roots and hypocotyls, or fail to germinate (Dharmasiri et al., 2005; Parry et al., 2009). All lines homozygous for both tir1 and afb2 plus either afb3, afb4, or afb5 display these defects to some degree ranging from 1% in tir1afb24% to 99% in tir1afb1234 (Supplementary file 1; Figure 1—figure supplement 4).
We had noticed a sizeable difference in the proportion of seedlings lacking roots from different batches of seeds. To test whether the temperature at which the seeds mature affects the penetrance of the rootless seedling phenotype, we grew tir1afb23, tir1afb123, tir1afb245 and WT in parallel at 17°C, 20°C, and 23°C and scored the progeny seedling phenotypes (Figure 1—figure supplement 4). The penetrance of the phenotype for all three lines was significantly lower at 20°C than at either 17°C or 23°C for all with the exception that the difference with tir1afb245 at 17°C was not significant using the Fisher’s exact test. This suggests that aspects of the auxin regulatory system are sensitive to temperature.
The tir1afb12345 mutant line exhibits defects early in embryogenesis
Because tir1afb235 seedlings were not identified among the progeny of tir1/+ afb235 or afb2/+ tir1afb35 plants, we examined developing embryos dissected from the siliques from these lines. Eleven of 41 (27%) and 52 of 213 (24%), respectively, of the embryos from each line lacked cotyledons and had over-proliferated suspensors while the rest had a WT phenotype (Figure 3A, A').
Figure 3 with 2 supplements see all
Embryo-lethal phenotypes of tir1/afb mutant lines.
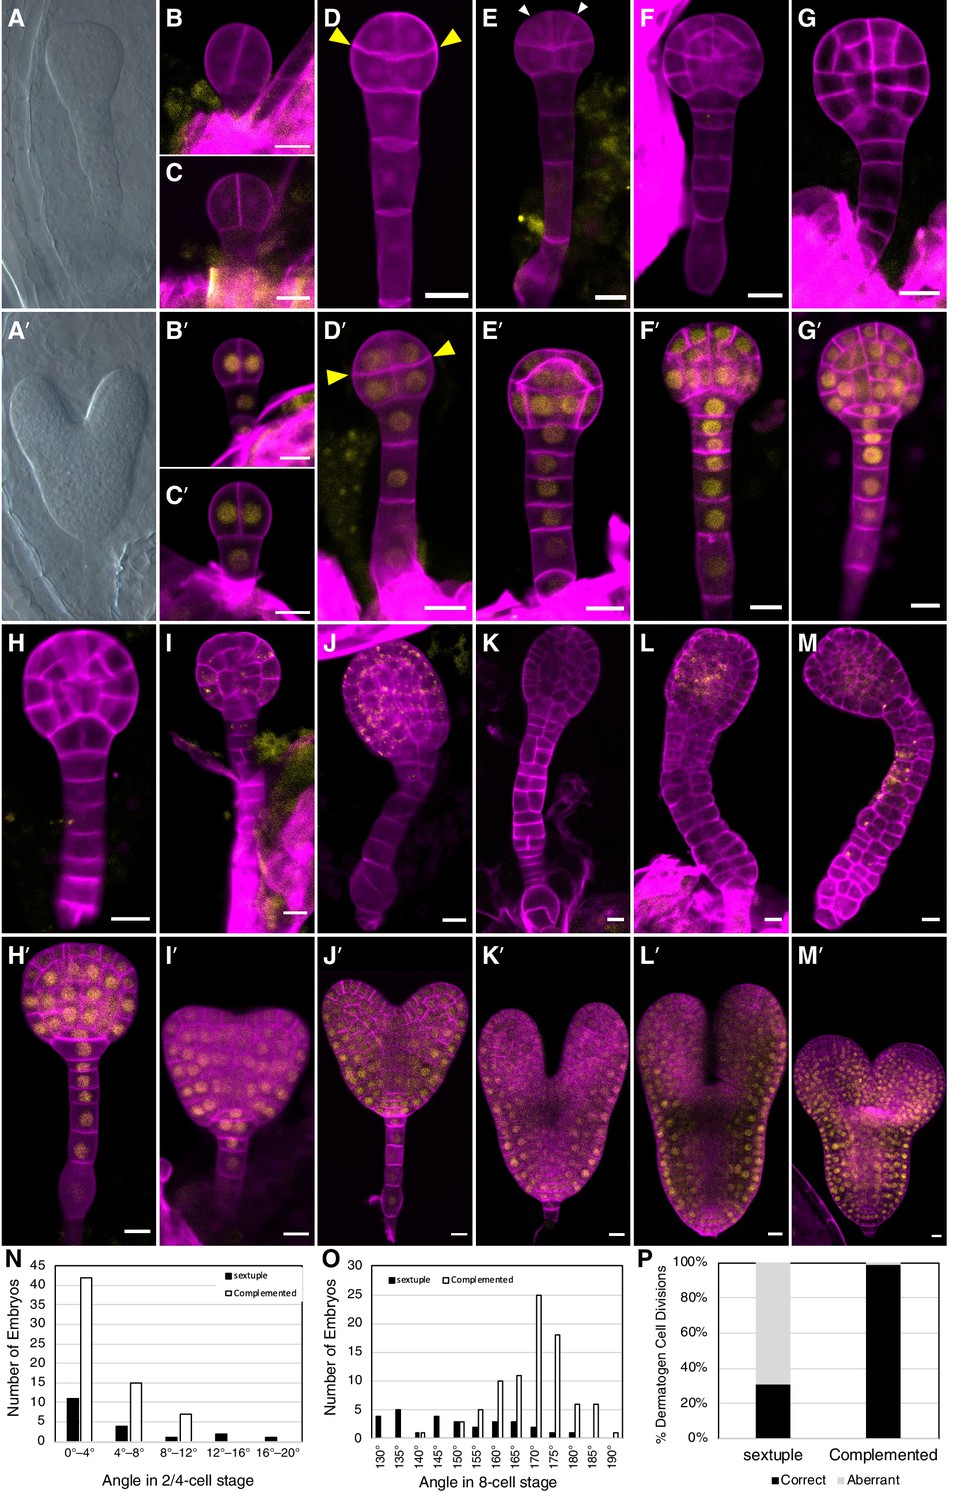
Rows of panels alternate between defective and normal embryos. Approximately one-quarter of the chloral-hydrate-cleared embryos from siliques of afb2/+ tir1afb35 plants did not produce cotyledon primordia and have over-proliferated suspensors (A) while the remaining siblings from the same silique appear normal (A′). Embryos from TIR1/AFB5/AFB2/+ tir1afb12345 plants were fixed, stained with SR2200 (cell walls, magenta), and scanned for fluorescence from the AFB2-mCitrine fusion protein (yellow). All were progeny of ‘d2’ transgenic line and the standard alleles except panels (C and D) contained the tir1-10 and afb2-1 alleles and panels H′ and I were progeny of plants with the ‘d1’ transgenic line. The embryos in panels B–M are sextuple mutants lacking mCitrine signal while those in B′–M′ are complemented siblings. The embryo stages are 2-cell (B–C, B′–C′), 8-cell (octant; D, D′), 16-cell (dermatogen; E, E′), early globular (F, F′), late globular (G–H, G′–H′), late transition (I, I′), heart (J, J′), torpedo (K–L, K′–L′), and bent cotyledon (M, M′). The yellow cytoplasmic signal in panels (I) through (M) likely represents autofluorescence of senescing cells. (N) Histogram of the angles of the first division plane with 0° defined as perpendicular to a line connecting the upper corners of the hypophysis cell for sextuple (black) and complemented siblings (white). The average difference was not significantly different (p=0.32 from t-test, n = 19 and 64). (O) Histogram of the angles of lines connecting the upper and lower tiers of octant embryos from side to center to side (indicated by arrowheads in panels D, D′). The means for the sextuple and complemented siblings were 149.1° and 169.1°, respectively, and were significantly different (p=1.4 × 10⁻⁷ from t-test, n = 29 and 84). (P) Bar graph showing the frequencies of normal (periclinal) and aberrant (anticlinal, arrowheads in panel E) divisions in 16-cell embryos. While aberrant divisions were observed in complemented siblings, they were significantly more frequent in sextuple mutants (p=2.8 × 10−54 from Fisher’s exact test, n = 94 and 437 divisions).
Because all mutant combinations expected to produce one-quarter tir1afb2345 progeny were either seedling lethal or infertile, we created a transgene that hemizygously complements these phenotype and segregates as a single locus. We assembled the complementing genomic fragments encoding TIR1, AFB2, and AFB5, each carboxy-terminally fused with the coding sequences for different monomeric fluorescent proteins (mOrange2, mCitrine, and mCherry, respectively) concatenated into a single binary plasmid (Figure 3—figure supplement 1). This construct was transformed into progeny of tir1/+ afb5/+ afb1234 plants, backcrossed and selfed to obtain a sextuple mutant background, and two TIR1/AFB5/AFB2 lines were identified that complemented the sextuple mutant phenotype when hemizygous and segregated as a single locus. Using this approach, one-quarter of the progeny of plants hemizygous for these transgenes display embryo defects, while the complemented siblings are easily identified because they expressed fluorescent TIR1, AFB2, and AFB5 fusion proteins.
The earliest potential difference between sextuple mutants and the complemented siblings is that the initial division of the embryo proper was occasionally displaced from vertical in sextuple 2-cell embryos (3 of 19 were >12° from vertical) compared to complemented sibling embryos (0 of 64), however the average angles from vertical were not significantly different (p=0.32) (Figure 3B–C versus 3B′–C′, 3N). The third round of divisions in the embryo proper separates the upper and lower tiers with the lower surface of the upper tier typically being slightly convex, and this curvature is significantly more prominent in the sextuple mutants (p=1.4 × 10⁻⁷; Figure 3D versus 3D′, 3O). Later, during the transition from the 8-cell to the 16-cell embryos, nearly all cell divisions in the complemented embryos are oriented periclinally, as in WT embryos. In contrast, 69% of these division are anticlinal in the mutant embryos (Figure 3E and E', 3P). In WT 32-cell stage embryos, the hypophysis cell normally divides asymmetrically to produce the lens-shaped cell which is required for the formation of the embryonic root. This division was delayed in the mutant, and when it occurred, was symmetrical (Figure 3G–H and 3G′–H′). Later, the cells of the embryo proper slow or cease dividing and the cells of the suspensor begin to proliferate and invariably produce a radially symmetric terminal phenotype (Figure 3I–M, 3I′–M′). Around the stage where complemented siblings are at the bent-cotyledon stage, the cells of the sextuple mutant senesce and seed development is aborted (Figure 3—figure supplement 2). Hence, the sextuple mutant reveals the importance of TIR1/AFB auxin response machinery from the earliest stages of embryogenesis.
Expression of embryo-patterning reporters is disrupted in the tir1afb235 quadruple mutant
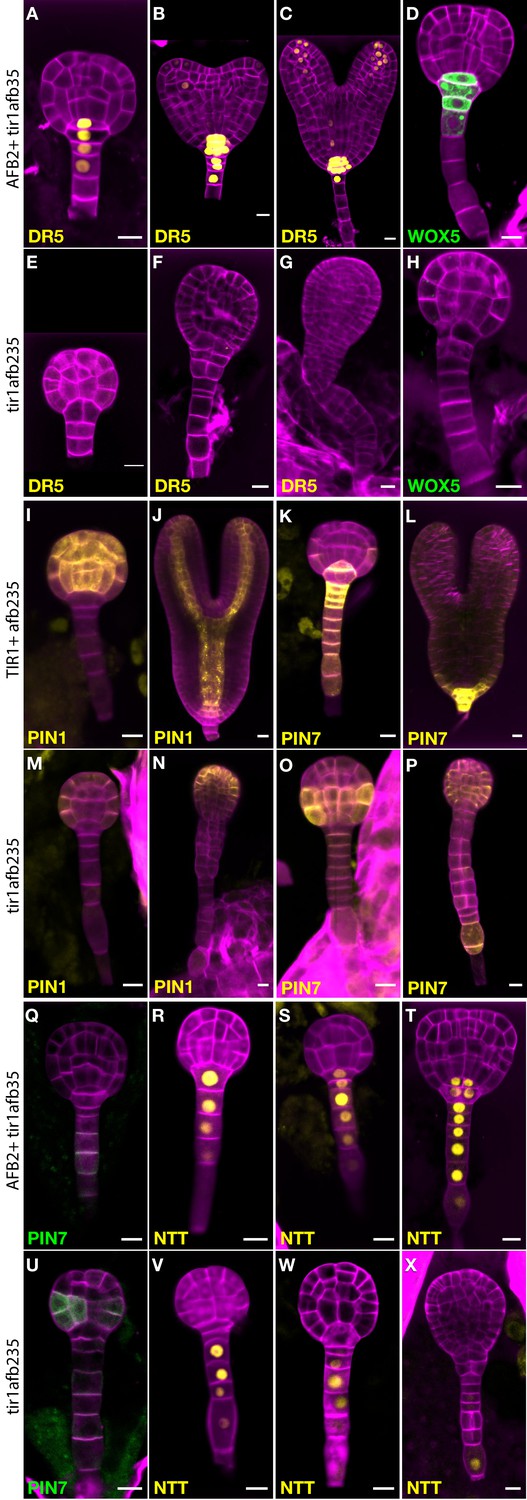
To learn more about the early embryo defects, we introgressed marker genes into lines segregating the tir1afb235 quadruple mutant. This quadruple mutant displays a phenotype indistinguishable from that of the sextuple mutant from at least the dermatogen stage, when quadruple mutants can first be reliably distinguished from non-quadruple mutants (Figure 4). Expression of the auxin-responsive marker DR5rev:3×Venus-N7 was undetectable in embryos displaying the mutant phenotype (Figure 4E–G; compare to Figure 4A–C; 0/10 in quadruple mutants and 26/26 in non-mutant siblings) indicating that auxin-regulated transcription through the remaining receptors, AFB4 and AFB1, is minimal at most during embryogenesis. Similarly, the quiescent center marker WOX5:GFP was not detected in the mutant embryos (Figure 4H), whereas in wild type the reporter is first expressed in the hypophysis prior to its asymmetric division then persists in the quiescent center cells (Figure 4D; 0/11 in quadruple mutants and 28/28 in non-mutant siblings).
Figure 4
Marker gene expression in the tir1afb235 embryos.
Fluorescence in embryos from both afb2/+ tir1afb35 DR5rev:3×Venus-N7 (A–C, E–G) and afb2/+ tir1afb35 WOX5:GFPER (D, H) markers was present in phenotypically normal siblings (A–D) but absent in abnormal (presumed tir1afb235) embryos (E–H). Fluorescence in embryos from tir1/+afb235 PIN1-Venus plants: normal-phenotype globular embryo (I), normal-phenotype torpedo-stage embryo (J), mutant-phenotype globular embryo (M) and later-stage embryo (N). Progeny of tir1/+ afb235 PIN7-Venus or afb2/+ tir1afb35 PIN7-GFP plants: phenotypically normal globular embryos (K, Q) mutant globular embryos (O, U), and normal (L) and mutant (P) torpedo-stage embryos. Progeny of afb2/+ tir1afb35 NTT-YPet plants: normal-phenotype globular- (R–S) and transition- (T) stage embryos, and mutant embryos (V–X). Scale bars: 10 µm.
Auxin efflux reporter PIN7-Venus is normally expressed in the suspensor, hypophysis, hypophysis-derived cells, and weakly in protodermal cells of the lower tier (Figure 4K–L). In mutant embryos, PIN7-Venus is faintly detectable in these cells in globular-stage embryos. Unexpectedly, the signal is much stronger in protodermal cells of the embryo proper, especially in the lower tier, by the 32-cell stage (Figure 4O–P; 7/8 quadruple mutants and 0/14 siblings). The same pattern was observed with the PIN7-GFP marker (Figure 4U; 8/8 quadruple mutants and 0/30 siblings). The auxin efflux reporter PIN1-Venus is initially expressed in a reciprocal pattern to PIN7-Venus, in all the cells above the hypophysis except the lower-tier protodermal cells and is later refined to strips from the provascular cells out to the cotyledon tips (Figure 4I–J; 12/12 of phenotypically normal embryos). In the mutants, PIN1-Venus signal is reduced and restricted primarily to apical protodermal cells (Figure 4M–N; 9/9 quadruple mutants). The NTT-YPet marker gene is normally first strongly expressed in 8- to 16-cell embryos in the nuclei of suspensor cells and the hypophysis and persists in the suspensor and the hypophysis-derived cells in later embryo stages (Figure 4R–T; 58/59 phenotypically normal embryos) (Crawford et al., 2015). In mutants, NTT-YPet appears normally in most suspensor cells, but not always including the hypophysis (2/6 32-cell quadruple mutant embryos had signal above background in the hypophysis), and is progressively lost in the distal suspensor cells before the abnormal lateral cell divisions occur (Figure 4V–X; 4/4 late-globular-stage mutants lacked signal in both the hypophysis and the adjacent suspensor cell). This is very similar to NTT-YPet expression in a monopteros mutant embryos (Crawford et al., 2015).
Gametophytically expressed TIR1/AFBs do not contribute to gametophytic viability
Because the maternal supply of auxin and the endosperm both play important roles in embryo development, it is possible that female gametophytes lacking auxin receptors would not be viable. Although the incidence of sextuple mutant embryos shows that gametophytically-expressed auxin receptors are not required for viability, it is possible that they contribute to robust transmission. To test the transmission through sextuple mutant megagametophytes and pollen, we carried out reciprocal crosses between wild type (Col-0) and the hemizygously TIR1/AFB5/AFB2-complemented sextuple mutant. If the sextuple mutant gametophyte survives and is fertilized, the progeny’s embryo lethality would be rescued by wild-type copies of each receptor provided by the Col-0 parent. The F1 progeny were scored for the presence of the transgene to infer the sextuple’s transmission rates through both gametophytes (Supplementary file 2). The sextuple mutant was transmitted nearly as well as without the complementing transgene as with it through both the pollen (49.4%) and the female gametophyte (47.9%) (χ2 test p=0.81 and 0.43, respectively). This indicates that gametophytically expressed TIR1/AFBs do not contribute to gametophytic viability.
Functional TIR1/AFB-mCitrine reporters reveal contrasting patterns of spatio-temporal expression and sub-cellular localizations
To reveal whether differences in expression pattern can account for the relative importance of the TIR1/AFBs in different aspects of growth and development, C-terminal fusions with the bright, relatively fast-maturing, monomeric fluorescent protein mCitrine were produced for each TIR1/AFB protein in the corresponding single mutant background. Each transgene complemented the mutant phenotypes (Figure 5—figure supplement 1). The fluorescent signal in the AFB5-mCitrine lines was fairly uniformly distributed in shoot apices (Figure 5F), while in the AFB3-mCitrine, AFB2-mCitrine, and TIR1-mCitrine lines, fluorescence was more restricted to young primordia and meristem peripheral zones (Figure 5A and C–D). Within organ primordia, TIR1-mCitrine appears to be strongest in the adaxial domains of the youngest primordia. Signal for the AFB4-mCitrine line was barely detectable (Figure 5E), while that of AFB1-mCitrine was very strong and largely complementary to TIR1-mCitrine in that the strongest signal was in abaxial domains and in the stem (Figure 5B). The expression patterns in either primary or lateral roots for each TIR1/AFB gene except AFB4 translationally fused to a YFP have been reported previously (Prigge et al., 2016; Wang et al., 2016; Rast-Somssich et al., 2017; Roychoudhry et al., 2017). TIR1-, AFB2-, AFB3-, and AFB5-mCitrine signal was uniformly detected throughout the root meristematic region and fainter signal detected in the root cap cells (Figure 5G, I–J and L; Figure 5—figure supplement 2) as shown previously. AFB1-mCitrine is very highly expressed throughout the root except for the columella, cortex, endodermis, and pericycle of the meristematic region (Figure 5H). The expression pattern of an AFB4-mCitrine line (line #3), hypersensitive to the synthetic auxin picloram, was comparable to that of AFB5-mCitrine while that of AFB4-mCitrine line #1 that complemented the afb4 phenotype was barely detectable (Figure 5K; Figure 5—figure supplement 1D, Figure 5—figure supplement 2I–L). In embryos, TIR1-, AFB2-, AFB3-, and AFB5-mCitrine accumulate fairly uniformly throughout the embryos and suspensors while AFB4-mCitrine’s signal was close to background levels and AFB1-mCitrine was undetectable (Figure 5T–Y).
Figure 5 with 3 supplements see all
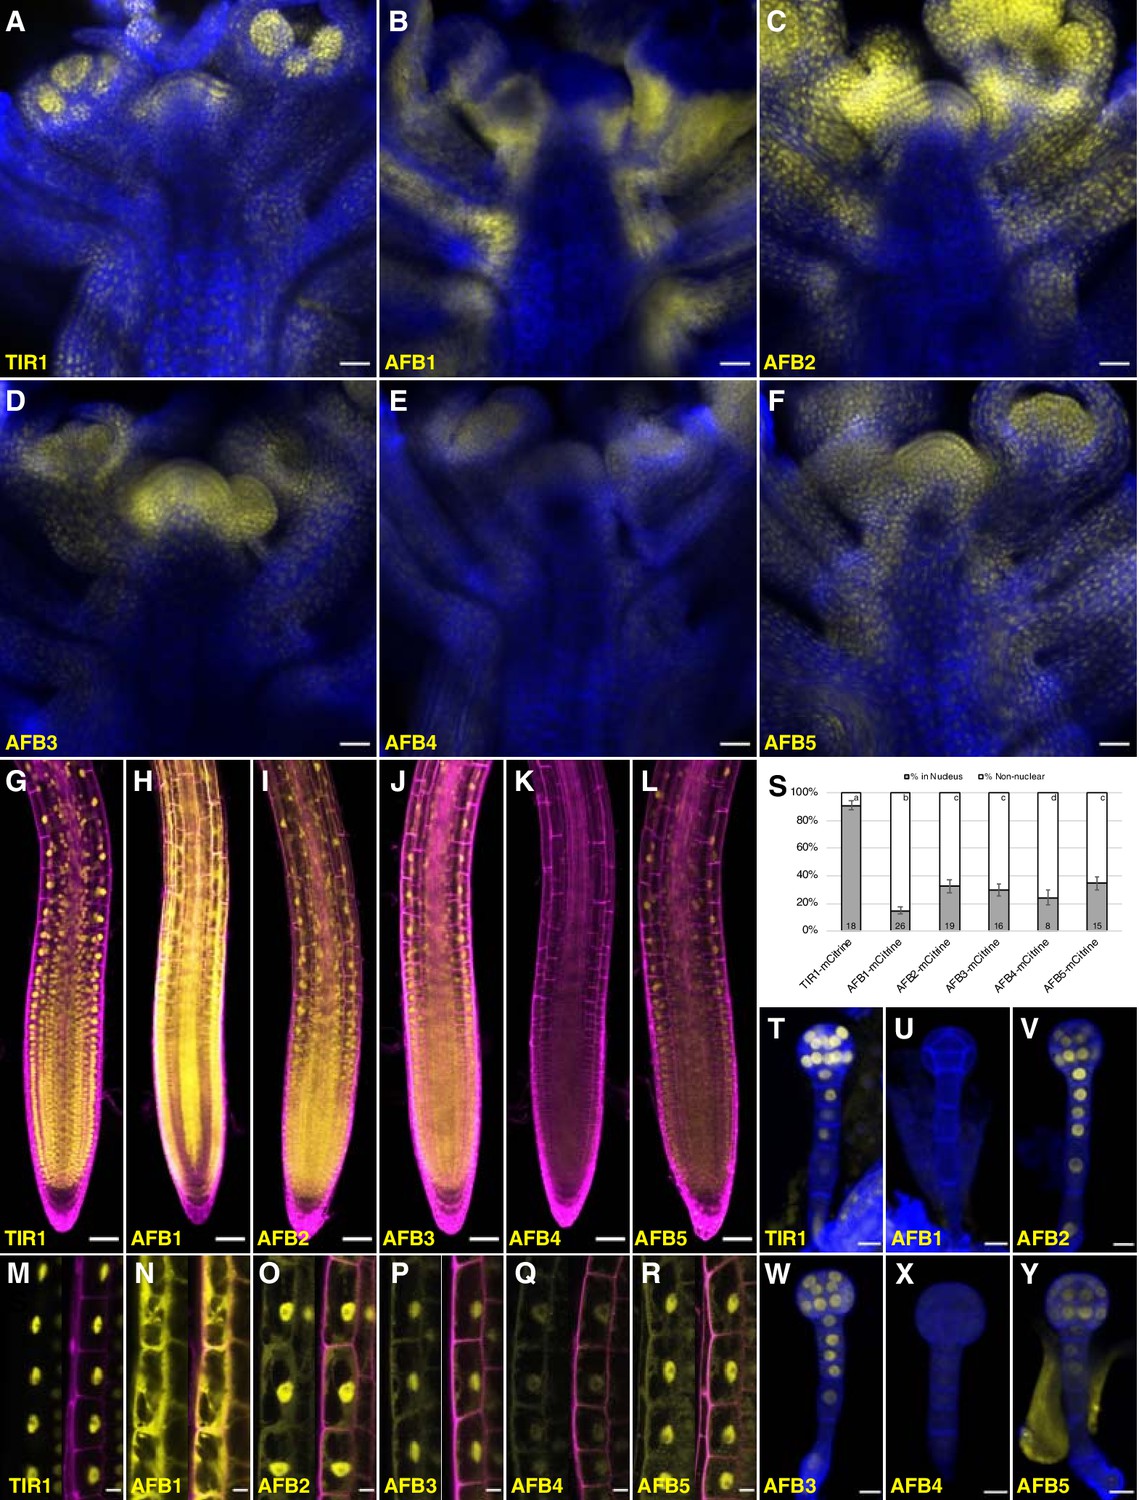
Expression of TIR1/AFB-mCitrine translational fusions.
(A–F) Confocal images of inflorescence apices from 4-week-old plants containing the specified TIR1/AFB-mCitrine transgenes. (G–R) Confocal images of roots of 5-day-old seedlings under lower magnification (G–L) or 7-day-old seedlings under higher magnification (M–R). Images in panels (G) and I–L used similar microscope settings while those in panel (H) used less sensitive settings. (S) Plot comparing the relative proportions of mCitrine signal inside the nucleus (gray) and outside the nucleus (white). Cells were imaged and measured for each TIR1/AFB-mCitrine line, and the averages ± standard deviations are shown. For AFB1-mCitrine, F1 hybrids with the UBQ10:H2B-mTurquoise2 nuclear marker were used so that the nuclei could be delineated (Figure 5—figure supplement 3). The numbers in the bars indicate the number of cells measured and the letters distinguish significantly different averages (two-tailed t-test p<0.05). (T–Y) Confocal images of dermatogen or early globular embryos. mCitrine signal is shown as yellow in all panels, and cell walls were stained with Calcofluor White M2R (blue; A–F), propidium iodide (magenta; G–R), and SCRI Renaissance 2200 (blue; T–Y). In panels M–R, mCitrine fluorescence is shown with and without merging with the propidium iodide stain image. Transgenic lines and genetic backgrounds used: (A, G, M, S, T) tir1-10 TIR1-mCitrine#2; (B, H, N, S, U) afb1-3 AFB1-mCitrine#7; (C, O, V) afb2-3 AFB2-mCitrine#3; (I, S) afb2-3 AFB2-mCitrine#5; (D, J, P, S, W) afb3-4 AFB3-mCitrine#1; (E, K, Q, S, X) afb4-8 AFB4-mCitrine#3; (F, L, Y) afb5-5 AFB5-mCitrine#19 and (R, S) afb5-5 AFB5-mCitrine#23. Scale bars equal 25 µm (A–F), 50 µm (G–L), and 10 µm (M–R, T–Y).
The subcellular localization of different TIR1/AFB proteins varied substantially (Figure 5M–S; Figure 5—figure supplement 3). We quantified this variation more precisely by measuring the relative level of each protein in the nucleus versus outside the nucleus in epidermal cells of the root elongation zone based on mCitrine fluorescence (Figure 5S). TIR1-mCitrine is primarily in nuclei while significant amounts of AFB2 through AFB5 are present in the cytoplasm. Strikingly, AFB1-mCitrine appears primarily outside the nuclei. The localizations are consistent across multiple lines and, when tested, different fluorescent protein tags (Figure 5—figure supplement 2). Hence, despite being from the same clade, TIR1 and AFB1 proteins exhibit contrasting patterns of primarily nuclear and cytoplasmic subcellular localizations, respectively.
AFB1 plays a key role in the rapid auxin inhibition of root growth
Gravitropic curvature of the root is a rapid auxin-regulated growth response that requires asymmetric distribution of auxin between the upper and lower side of the root (Sato et al., 2015). According to the current model, auxin has two modes of action during gravitropism: a rapid nongenomic phase, followed by a transcriptional phase that is dependent on the TIR1/AFB proteins (Shih et al., 2015). Surprisingly, recent studies demonstrate that rapid, nongenomic auxin inhibition of root growth is dependent on the TIR1/AFBs (Fendrych et al., 2018). To determine the relative contribution of the TIR1/AFB family members to the rapid response, we measured the effect of 10 nM IAA on root growth in various tir1/afb lines over a 20 min time period (Figure 6; Figure 6—figure supplement 1; Figure 6—videos 1–2). The results in Figure 6 show that each of the TIR1/AFBs contributes to rapid root growth inhibition but that, surprisingly, the afb1-3 mutant is almost completely resistant to auxin indicating that AFB1 is the dominant auxin receptor for this response. Expression of AFB1-mCitrine under control of the AFB1 promoter restored the wild-level of auxin response. The behavior of the afb1 mutant is particularly remarkable since the mutant is not affected in any of the other auxin-regulated growth processes that we characterized, with the possible exception of lateral root formation. This includes long-term inhibition of root growth. Thus, the afb1 mutant is a useful tool to discriminate between nongenomic and transcriptional auxin responses.
Figure 6 with 4 supplements see all
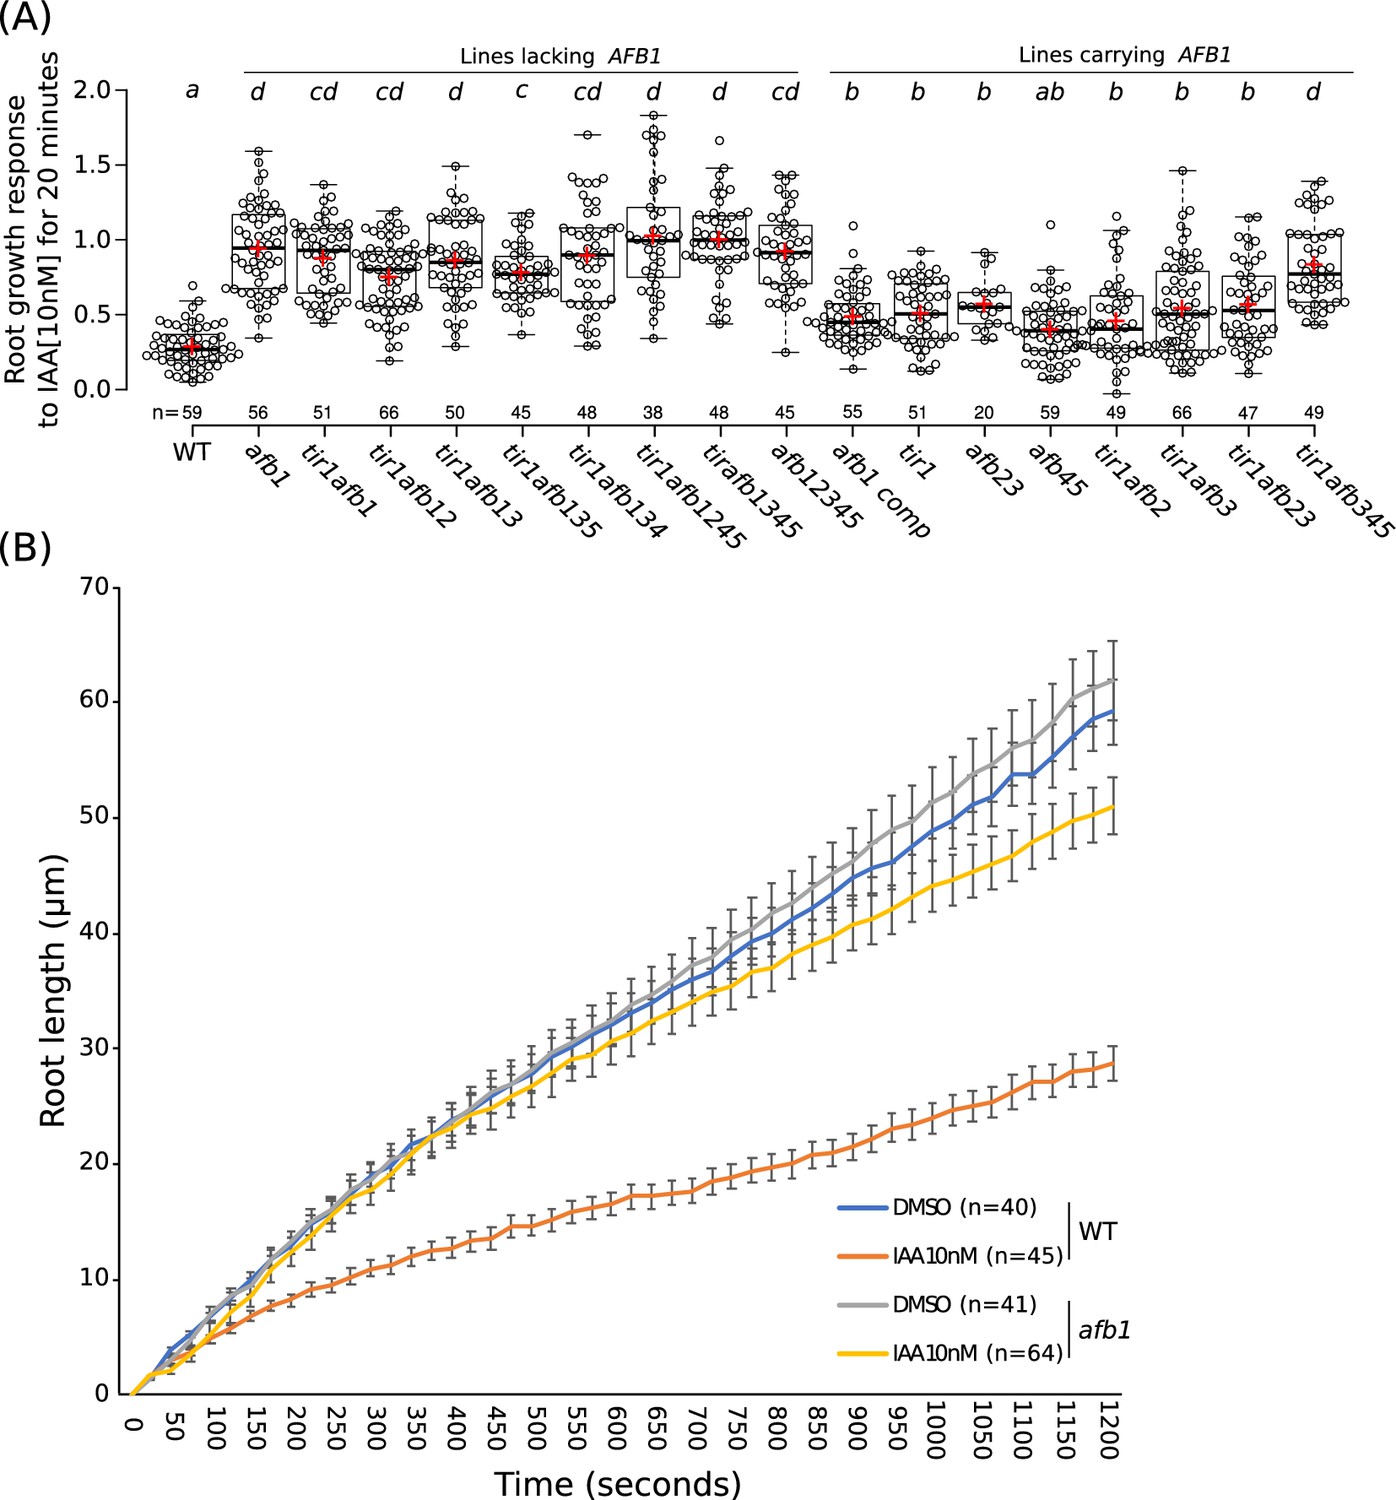
The role of AFB1 in rapid inhibition of root elongation.
(A) Plot of the root growth response of different genotypes to 10 nM IAA for 20 min. Black circles represent the response for one single root. Red crosses indicate the mean. Black bars indicate median. n indicates the number of roots obtained from three independent experiments. Letters indicate statistical differences according to one-way ANOVA coupled with post hoc Tukey honestly significant difference (HSD) test (p=0.05). (B) Graph of the root length in μm according to time in seconds of WT and afb1 in DMSO and 10 nM IAA treatments (blue, gray, orange and yellow lines, respectively). Bars indicates standard deviation of the mean (SEM). n indicates the number of roots obtained from three independent experiments.
-
Figure 6—source data 1
Source data for root elongation assay.
- https://cdn.elifesciences.org/articles/54740/elife-54740-fig6-data1-v2.xlsx
As a contrast we also examined the effect of auxin on etiolated hypocotyl growth in the mutant lines. This response is slower than the root response and depends on the canonical nuclear TIR1/AFB pathway (Fendrych et al., 2016). Dissected hypocotyl segments from etiolated seedlings were treated with 5 µM NAA and imaged every 10 min for 180 min. The response of the mutant lines was complex (Figure 6—figure supplement 2). Several lines were clearly resistant to auxin, particularly tir1afb1245 and tir1afb245. Notably, comparison of these lines suggests that the afb1 mutation did not contribute to resistance. Other lines also lacking both AFB4 and AFB5—afb1345, tir1345, afb1245, and afb12345—display a moderate level of resistance. Finally, three lines, tir1afb134, tir1afb23, and tir1afb124 are hypersensitive to auxin in this assay (Figure 6—figure supplement 2).
AFB1 regulates the initial phase of root gravitropic response
Gravitropic root curvature is first apparent less than 10 min after a gravity stimulus (Shih et al., 2015). It has been proposed that the early stage of gravitropism is mediated by a non-genomic auxin response while prolonged root curvature requires auxin regulated transcription (Sato et al., 2015). Since AFB1, and to a lesser extent, the other TIR1/AFBs, contribute to nongenomic inhibition of root elongation, we wondered if they are required for the early gravitropic response. To test this possibility, we performed gravitropism assays on a number of tir1/afb lines (Figure 7; Figure 7—figure supplement 1). The gravitropic response can be divided into three phases. A slow or lag phase which occurs over the first 90 min in Col-0, followed by a 3 hr linear phase and finishing with a plateau phase. The tir1afb345 line exhibits a slower gravitropic response during the linear phase and a reduced angle at plateau compared to WT (Figure 7A) as expected based on results with other tir1/afb mutant combinations (Dharmasiri et al., 2005). Strikingly, the tir1afb1345 mutant exhibited an additional decrease in the gravitropic response during the initial lag phase demonstrating that AFB1 is required for this phase (Figure 7A; Figure 7—figure supplement 1A). The tir1afb1 line showed a similar decrease in the lag phase compared to tir1 (Figure 7B; Figure 7—figure supplement 1B). It seems likely that TIR1 also contributes to the early response since the tir1afb1 double mutant showed a stronger delay compared to either single mutant. In addition, both tir1 and afb1 displayed a reduced early response in one of the two experiments (Figure 7—figure supplement 1B). Since other members of the family also confer low levels of auxin resistance in the rapid root growth response, these proteins may also make a small contribution to the early phase of gravitropism (Figure 6A). Further, both afb1 AFB1-mCitrine lines responded appreciably faster than the afb1 mutant during the first 2 hr with the brighter of the two mCitrine lines, line #7, exhibiting a difference by 30 min (Figure 7C; Figure 7—figure supplement 1C). Interestingly, both mCitrine lines started to plateau earlier and at a reduced angle compared to wild type while afb1 plateaued later and at an increased angle, suggesting that AFB1 and the rapid response also play a role at later stages of the gravitropic bending response.
Figure 7 with 1 supplement see all
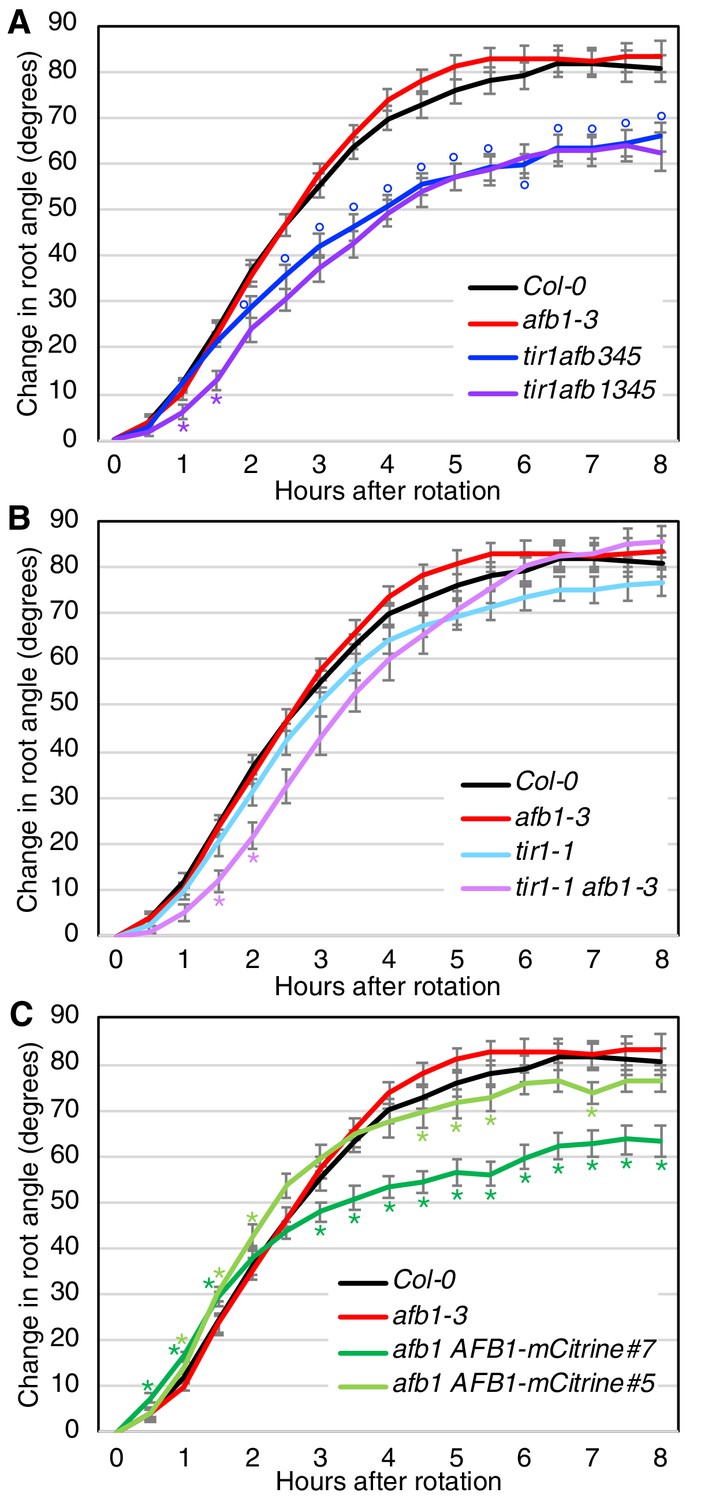
Gravitropic response of tir1/afb lines.
Sixteen seedlings for each line were imaged every 30 min after rotating the plates 90° and the mean difference in the root-tip angle from the original angle ± SEM are plotted versus time. Col-0 and afb1-3 are included in all panels for comparison. Time points at which lines differed from Col-0 are indicated by degree symbols (°) and differences between lines with and without the afb1 mutation are indicated by asterisks (*) of the colors shown in the legend (t-test, p<0.05). Colors: black, Col-0; red, afb1-3; blue, tir1afb345; purple, tir1afb1345; cyan, tir1-1; lavender, tir1-1 afb1-3; light green, afb1-3 AFB1-mCitrine#5; and dark green, afb1-3 AFB1-mCitrine#7.
-
Figure 7—source data 1
Source data for gravitropism assay.
- https://cdn.elifesciences.org/articles/54740/elife-54740-fig7-data1-v2.xlsx
Discussion
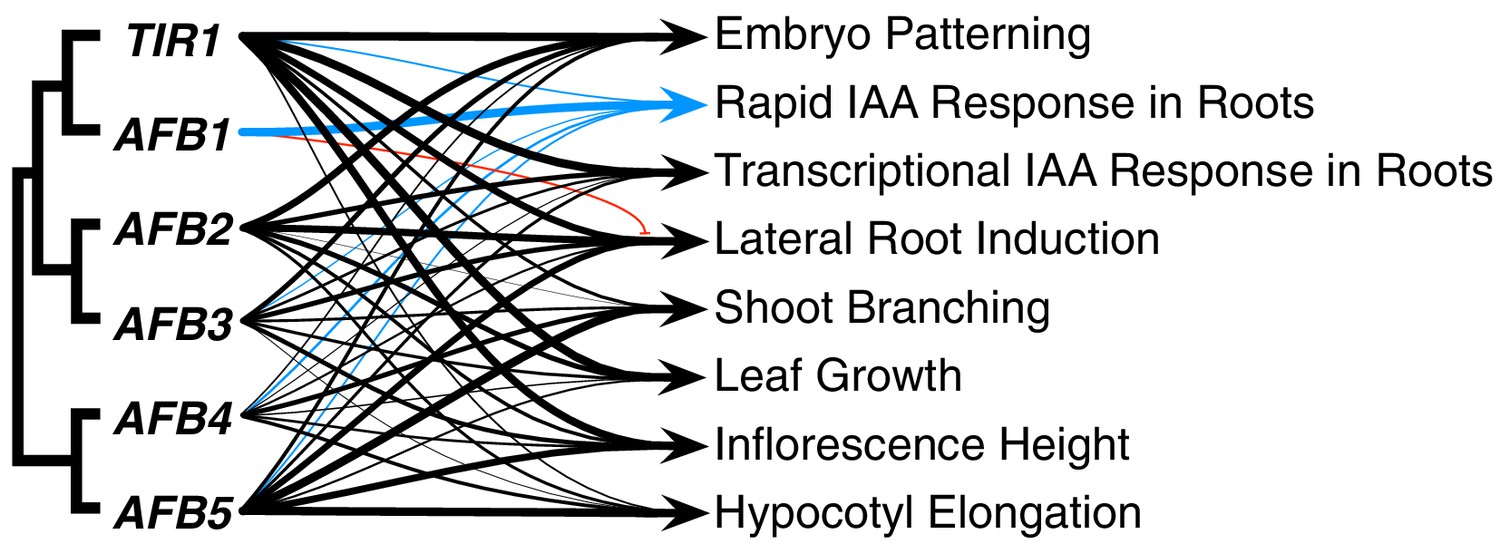
The TIR1/AFB protein family has expanded through a series of gene duplication events that began before fern–seed-plant divergence. Despite the fact that three major subclades were established approximately 400 MYA (Morris et al., 2018), our genetic studies reveal that for most auxin-regulated growth processes, the TIR/AFB proteins retain largely overlapping functions (Figure 8). The striking exception to this general statement is the dominant role for AFB1 in rapid auxin inhibition of root growth. In general, TIR1 is most important for normal growth and development, but AFB5 and AFB2, and to a lesser extent AFB3 and AFB4, also play significant roles. Spatial differences are also apparent; TIR1 has a major role in the root while AFB5 is relatively more important in hypocotyl and inflorescence development.
Figure 8
Summary of each TIR1/AFB gene’s contributions to different responses.
The line weights reflect the relative importance for each gene’s roles. The blue lines represent contributions to the rapid IAA-mediated inhibition of root elongation and the red line with the bar end indicates the antagonistic role observed for AFB1 in lateral root production.
Although all six genes are broadly expressed, it appears that the relative importance of individual TIR1/AFB proteins in various organs are at least partly related to differences in expression. For example, AFB5 is more broadly expressed than the other genes in the inflorescence while in the root, TIR1 and AFB2 are most highly expressed. The AFB4 gene is expressed at a lower level in all tissues consistent with its relatively minor role. Additional differences in patterns of expression are also apparent, particularly in the inflorescence. Further studies will be required to determine if these differences are important.
Our studies demonstrate that the levels of the TIR1/AFB proteins are not uniform throughout the plant. This is true for individual members of the family and for total TIR1/AFB levels across different tissues and cell types. Earlier experiments also showed that TIR1/AFB levels can be dynamic in a changing environment (Vidal et al., 2010; Wang et al., 2016). These observations may have important implications for use of DII-Venus-based auxin sensors to estimate relative auxin levels, since levels of the sensor protein are dependent on both auxin and the TIR1/AFBs (Brunoud et al., 2012; Liao et al., 2015). Given the debate over an auxin-response asymmetry across shoot organ primordia (Bhatia et al., 2019; Guan et al., 2019), it is particularly interesting that we see an asymmetric distribution of TIR1-mCitrine across flower primordia.
It is important to emphasize that individual members of the family may have functions in particular environmental conditions. For example, the microRNA miR393 is known to target TIR1, AFB2, and AFB3 but not other members of the family (Jones-Rhoades and Bartel, 2004; Navarro et al., 2006). Regulation of miR393 abundance modulates the levels of these three TIR1/AFBs to facilitate various growth processes, such as lateral root formation and hypocotyl elongation in response to environmental signals (Vidal et al., 2010; Pucciariello et al., 2018).
Previous in vitro studies have documented some differences in the biochemical activity of members of the TIR1/AFB family (Calderón Villalobos et al., 2012; Lee et al., 2014). Similarly, an auxin-induced degradation assay in yeast reveals differences in the behavior of TIR1 and AFB2 (Wright et al., 2017). In contrast, our results do not reveal any biochemical specificity, except for AFB1 (see below). Thus, a single TIR1 or AFB2 allele is sufficient to support viability throughout the plant life cycle albeit with dramatically reduced fertility. This contrasts to functional diversification seen in other well-studied gene families that diverged in a similar time frame such as the phytochrome photoreceptors and Class III HD-Zip transcriptional regulators (Prigge et al., 2005; Franklin and Quail, 2010; Strasser et al., 2010). It is possible that the retention of overlapping functions reflects stricter constraints on TIR1/AFB protein function. One possibility is that the different TIR1/AFB paralogs have been maintained because they contribute to the robustness of the auxin signaling system. Of course, specific functions may be revealed in future studies.
The importance of auxin in patterning of the developing embryo is well established (Palovaara et al., 2016). Auxin signaling, as evidenced by activity of the DR5 reporter, is first apparent in the apical cell of the embryo (Friml et al., 2003). The essential role of auxin in the apical cell and later in the hypophysis is clearly demonstrated by the defects in the division of these cells in the tir1afb235 quadruple and tir1afb12345 sextuple mutant (Figure 3). Similar defects are observed in a number of other auxin mutants including those affecting response (monopteros and bodenlos), auxin synthesis (yuc1 yuc4 yuc10 yuc11 and taa1 tar1 tar2) and transport (pin1 pin3 pin4 pin7 and aux1 lax1 lax2) (Berleth and Jürgens, 1993; Hardtke and Berleth, 1998; Hamann et al., 1999; Hamann et al., 2002; Friml et al., 2003; Cheng et al., 2007; Stepanova et al., 2008; Robert et al., 2015). However, none of these lines exhibit the fully penetrant embryo-lethal phenotype observed for the tir1afb235 quadruple and tir1afb12345 sextuple mutants. In the other mutants, significant fractions of embryos escape embryo lethality and germinate, albeit often as rootless seedlings.
The expression of key embryonic markers in the mutants also reveals profound defects in embryonic patterning by the dermatogen stage. Although tir1afb235 embryos form a morphologically normal hypophysis cell, this cell never expresses NTT-YPet or WOX5:GFP. The proliferation of suspensor cells in the mutant is associated with reduced expression of the suspensor marker PIN7-Venus and to a lesser extent NTT-YPet suggesting that the TIR1/AFB pathway is required to maintain the suspensor cell fate, consistent with an earlier study (Rademacher et al., 2012). PIN1-Venus is normally expressed in most cells distal from the hypophysis in globular embryos and in provascular tissue in later embryos, but it was expressed primarily in apical protodermal cells in tir1afb235 mutants (Figure 4M–N). This is reminiscent of its pattern in the monopteros mutant, where some protodermal expression appears although the provascular expression is retained (Breuninger et al., 2008). Because both cotyledon specification and PIN1 expression are influenced by auxin perception, it is unclear whether the mutant embryos lack the radial asymmetry that predicts cotyledon positioning or fail to elaborate on this asymmetry. It was surprising to observe that PIN7-Venus exhibits ectopic expression in the embryo proper. The reason for this is unclear but PIN7 expression may normally be repressed in the embryo by a TIR1/AFB-dependent pathway. Given that PIN1 and PIN7 are normally expressed in non-overlapping domains in the embryo (Friml et al., 2003), one possibility is that the reduction in PIN1 expression in the mutants allows PIN7 to be expressed beyond its normal boundaries.
In contrast to the embryo, the role of auxin in gametophyte development is uncertain. Several reports suggest that auxin has an important role in patterning the female gametophyte (Pagnussat et al., 2009; Panoli et al., 2015; Liu et al., 2018). Others have argued against a role for auxin based on theoretical considerations as well as lack of evidence for an auxin response using several auxin reporters (Lituiev et al., 2013). Our studies suggest that the TIR1/AFB auxin receptors are not required for gametophyte development although we cannot rule out a minor role. It is important to note that we have not directly examined developing sextuple gametophytes and it is possible that there are minor defects that do not affect viability. We also can’t eliminate the possibility of perdurance of TIR1/AFB proteins from the maternal tissue. Finally, it is possible that auxin is required, but acts through a non-canonical pathway such as that involving auxin binding to the ETTIN protein (Simonini et al., 2016).
AFB1 is unique among the auxin co-receptors and appears to have undergone pronounced functional changes during the diversification of the Brasssicales order since the TIR1–AFB1 duplication in the At-β WGD around 80 to 90 million years ago (Figure 1—figure supplement 1C; Edger et al., 2018). Although AFB1 can interact with Aux/IAA proteins in an auxin-dependent manner, it does not appear to assemble into a Skp, Cullin, F-box containing (SCF) complex as efficiently as the other TIR1/AFBs and is not primarily localized to the nucleus where it could directly influence transcriptional responses (Dharmasiri et al., 2005; Yu et al., 2015; Figure 5N and S; Figure 5—figure supplement 2C–D). The F-Box substitutions in AFB1 affecting SCF assembly appeared between approximately 45 and 65 million years ago (Figure 1—figure supplement 1C; Edger et al., 2018). It is noteworthy that unlike the other TIR1/AFB genes that are broadly expressed in most cells, AFB1 is expressed very highly in some tissues (root epidermis and vascular tissue) and not at all in others (meristematic pericycle and early embryos). Based on our genetic studies, AFB1 appears to have a negative effect on lateral root initiation in the afb234 and afb345 lines despite the fact that AFB1 is not expressed in the pericycle, the site of lateral root initiation, suggesting that this may be a non-cell-autonomous effect.
We find that AFB2 through AFB5 are distributed between the nucleus and the cytoplasm, at least in epidermal cells of the root (Figure 5S). In contrast, the paralogs TIR1 and AFB1 differ dramatically in being highly enriched in the nucleus and in the cytoplasm, respectively. In Arabidopsis roots, auxin treatment results in very rapid responses including increased cytosolic Ca++ levels, alkalinization of the apoplast and inhibition of root growth (Shih et al., 2015; Dindas et al., 2018; Fendrych et al., 2018). Because these events occurred too rapidly to involve transcription, it was assumed that they did not require the TIR1/AFB proteins. However, recent studies have demonstrated that two rapid responses, inhibition of root growth and membrane depolarization in root hairs, do require the TIR1/AFBs (Dindas et al., 2018; Fendrych et al., 2018). Surprisingly we find that the growth inhibition response is mediated primarily by AFB1. This may reflect the high level of AFB1 in the cytoplasm. It is not currently clear how deeply conserved the cytoplasmic localization of AFB1 is. It is possible that AFB1’s specialization is a relatively recent event and that the responsibility of mediating the rapid response is shared by multiple TIR1/AFB proteins in other plant lineages. An answer to this question will require further information on the molecular basis for AFB1 localization.
It has been proposed that the rapid nongenomic auxin response in the Arabidopsis root has a role in early stages of root gravitropism (Sato et al., 2015), and our results support this idea. Although the afb1 mutant has only a modest effect on gravitropism by itself, in combination with tir1 or tir1afb345, it confers a clear decrease in early gravity response. It is surprising that the afb1 mutation has only a modest effect on root gravitropism given the nearly complete absence of the rapid nongenomic auxin response. This may be a reflection of the gravitropic assay we have employed. Further detailed studies of the gravitropic response may reveal a more substantial role for the rapid response. The fact that two AFB1-mCitrine lines both appear to affect the early response as well as the angle at the plateau phase, hint at additional complexity. Although the rapid auxin response has only been described thus far in Arabidopsis, it is probably not unique to the Brassicales given that a relatively fast gravitropic response is common in diverse seed plants (Zhang et al., 2019). If the rapid auxin response evolved prior to the TIR1–AFB1 duplication event and the ancestral TIR1/AFBs contributed to both the nuclear genomic and cytoplasmic nongenomic auxin responses, the differences between TIR1 and AFB1 represent an elegant example of subfunctionalization of AFB1 to a role in the non-genomic response and, possibly, of TIR1 to specialize in the nuclear auxin response. Furthermore, as AFB1 has a major role in the rapid response but little or no function in the transcriptional response, the afb1 mutant provides a useful tool to separate the two responses.
Materials and methods
Phylogeny
Request a detailed protocolThe sources for the amino-acid sequences (Figure 1—figure supplement 1A) and CDS (Figure 1—figure supplement 1C) are listed in Supplementary file 3 (Jiao et al., 2011; Goodstein et al., 2012; Johnson et al., 2012; Matasci et al., 2014; Wickett et al., 2014; Xie et al., 2014; One Thousand Plant Transcriptomes Initiative, 2019). Taxa were selected based on availability, quality, and diverse sampling at key nodes. A reduced set was included for COI1 homologs. The AFB1 genes from Camelina hispida, C. laxa, and C. rumelica were amplified from genomic DNA using Phusion Polymerase (New England Biolabs or ThermoFisher) and primers to regions of the 5′ and 3′ UTRs conserved in all three C. sativa AFB1 genes in the C. sativa genome (Kagale et al., 2014). The PCR products were subcloned, and three C. hispida and C. laxa clones and a single C. rumelica clone were sequenced. The CamhiAFB1 and CamlaAFB1 sequences included in analysis appeared in two of the three clones (GenBank accession numbers MK423960–MK423962).
To build the alignment of F-Box-LRR protein sequences, sequences from distinct subclades were aligned using T-COFFEE v11.00 (Notredame et al., 2000) to identify and trim unique unalignable regions from individual sequences before aligning the whole set. Ambiguous regions of the full alignments were removed in Mesquite v3.5 (Maddison and Maddison, 2018). The raw alignment of nucleotide CDS sequences of Brassicales TIR1/AFB1 genes was adjusted so that gaps fell between adjacent codons. Phylogenetic trees were inferred using MrBayes v3.2.6 (Ronquist et al., 2012). For the TIR1/AFB/XFB/COI1 phylogeny, a total of six runs of four chains were split between two Apple iMac computers using the parameters aamodelpr = mixed, nst = 6, and rates = invgamma. Only four of the six runs had converged after 16 million generations, so the analysis was restarted with three runs each starting with the best tree from one of the initial runs and with more heating (temp = 0.5) for 10 million generations. The TIR1/AFB1 nucleotide alignments were partitioned by codon position with ratepr = variable, nst = 6, rates = invgamma with three runs of 4 chains run for five million generations. The consensus trees were viewed using FigTree v1.4.4 (Rambaut, 2018).
Mutants
Request a detailed protocolThe alleles used—tir1-1, tir1-9, tir1-10, afb1-3, afb2-1, afb2-3, afb3-1, afb3-4, afb4-8, and afb5-5—have been described previously (Ruegger et al., 1998; Dharmasiri et al., 2005; Parry et al., 2009; Prigge et al., 2016). Seeds from Camelina species were provided by the United States National Plant Germplasm System (USDA-ARS, USA): C. hispida (PI 650133), C. laxa (PI 633185), and C. rumelica (PI 650138). Unless noted, plants were grown at 22°C long-day (16:8) conditions on ½×Murashige and Skoog media with 0.8% agar, 1% sucrose, and 2.5 mM MES, pH 5.7, or in a 2:1 mixture of soil mix (Sunshine LC1 or ProMix BX) and vermiculite. Leaf DNA was isolated with a protocol adapted from Edwards et al. (1991) to use steel BBs (Daisy Outdoor Products), 2 ml microcentrifuge tubes, and 20-tube holders (H37080-0020, Bel-Art). See Supplementary file 4 for primers used for genotyping.
Fluorescent marker lines were described previously:
Request a detailed protocolNTT-2×YPet (Crawford et al., 2015), PIN7-GFP (Blilou et al., 2005), DR5rev:3×Venus-N7 (Heisler et al., 2005), WOX5:GFPER (Blilou et al., 2005). The recombineered PIN1-Venus and PIN7-Venus markers (Zhou et al., 2011) were obtained from the Arabidopsis Biological Resource Center (CS67184 and CS67186). Previously characterized PIN1-GFP lines could not be used because of tight linkage to AFB2 (CS9362) and co-segregation with Ler-derived enhancers of the afb2/+ tir1afb35 phenotype (CS23889). Each marker was introgressed into lines segregating the tir1afb235 quadruple mutant by two sequential crosses, PCR genotyping, and selfing. Marker line homozygosity was confirmed in F1 seedlings from test crosses to WT. The UBQ10:H2B-mTurquoise2 marker was assembled by combining the pK7m34GW destination vector (Karimi et al., 2007), UBQ10prom_P4P1R (Jaillais et al., 2011) (provided by Nottingham Arabidopsis Stock Centre, N2106315), H2B_noStop/pDONR207 (provided by Frederic Berger), and 2×mTurqoise2/pDONR-P2RP3 using the LR Recombinase System (Life Technologies). For 2×mTurqoise2/pDONR-P2RP3, the mTurquoise2 coding sequence (Goedhart et al., 2012); provided by Joachim Goedhart) was amplified using primers mTU2_P2RP3_F and mTU2_P2RP3_wSTOP_R primers and recombined into pDONR-P2RP3 vector in a BP reaction to give mTURQUOISE2/pDONR-P2RP3. This plasmid was amplified using the INS_mTU2_P2RP3_F and INS_mTU2_P2RP3_wSTOP_R primers and the BB_mTU2_ P2RP3_F and BB_mTU2_ P2RP3_R primers. The PCR products were assembled by Gibson cloning (New England Biolabs) to give 2×mTurqoise2/pDONR-P2RP3. The UBQ10:H2B-mTurquoise2 transgene was introduced to Col-0 plants as described (Simon et al., 2014).
Fluorescently tagged TIR1/AFB lines
Request a detailed protocolGenomic regions containing each of the TIR1/AFB genes were amplified using Phusion polymerase (New England Biolabs or ThermoFisher) from corresponding genomic clones (JAtY51F08, JAtY62P14, JAtY53F15, JAtY61O12, and JAtY52F19) except for AFB3 which was amplified from Col-0 genomic DNA. See Supplementary file 4 for primers used. The PCR products were cloned into pMiniT (New England Biolabs), and the stop codon was altered to create a NheI site using site-directed mutagenesis. An XbaI fragment containing either mCitrine (Griesbeck et al., 2001), mOrange2 (Shaner et al., 2008), or mCherry (Shaner et al., 2004) preceded by a short linker (either Arg-Gly5-Ala or Arg-Gly4-Ala) was ligated into the NheI sites. The genomic regions including the fluorescent protein genes were inserted in the MluI site of pMP535 (Prigge et al., 2005) as AscI fragments (AFB5) or as MluI-AscI fragments (others). To produce the sextuple-complementation construct, the TIR1-mOrange2 fragment was cloned into pMP535 as above, then AFB2-mCitrine was inserted into the re-created MluI site followed by AFB5-mCherry into its re-created MluI site. The constructs were introduced into the following strains by floral dip (Clough and Bent, 1998): tir1/+ afb5/+ afb1234 progeny (sextuple-complementation construct), tir1afb23 (TIR1-mCitrine, AFB3-mCitrine, and AFB3-mEGFP), tir1afb1245 (AFB2-mCitrine), afb45 (AFB4-mCitrine and AFB4-tdTomato), afb5-5 (AFB5-mCitrine, and afb1-3 (AFB1-mCitrine). Basta-resistant candidate lines were selected based on complementation of visible phenotypes (except for AFB1-mCitrine) then crossed to get them into the appropriate mutant backgrounds. Once in the sextuple-mutant background, the complementation transgene was maintained as a hemizygote by checking siliques for aberrant embryos or aborted seeds. The afb5-5 AFB5-mCitrine #9 and #19 lines were described previously (Prigge et al., 2016).
Microscopy
Request a detailed protocolFor confocal microscopy of the root meristem, five- to seven-day-old seedlings were stained in a 10 µg/ml aqueous solution of propidium iodide for one minute, rinsed in water, mounted with water, and viewed with either a Zeiss LSM 880 inverted microscope or a Zeiss LSM 710 inverted microscope. Embryos were fixed and stained with SCRI Renaissance 2200 (SR2200; Renaissance Chemicals, UK; Crawford et al., 2015). Briefly, using fine forceps and a 27-gauge needle as a scalpel, developing seeds were dissected from siliques and immediately immerged in fix solution (1 × PBS, 4% formaldehyde (Electron Microscopy Sciences, 15713), and 0.4% dimethyl sulfoxide) in a six-well plate with 100µ-mesh strainers. A vacuum was pulled and held three times for 12 min each time, before rinsing twice with 1 × PBS for 5 min. The embryos were transferred to SR2200 stain [3% sucrose, 4% diethylene glycol, 4% dimethyl sulfoxide and 1% SR2200 and stained overnight with vacuum pulled and released 3–4 times. Seeds were mounted (20% glycerol, 0.1 × PBS, 0.1% dimethyl sulfoxide, 0.1% SR2200, and 0.01% Triton X100) and the embryos were liberated by pressing on the coverslip. To detect mCitrine in the shoot apices, we removed stage 5 and older floral buds using fine forceps, fixed and rinsed (as with the embryos), soaked in ClearSee (Kurihara et al., 2015) for seven to ten days changing the solution every two to three days, and then stained with basic fuchsin (not shown) and Fluorescent Brightener 28 (Calcofluor White M2R) as described (Ursache et al., 2018). Confocal image channels were merged using ImageJ or FIJI (Schindelin et al., 2012; Schneider et al., 2012). Cleared embryos were viewed by mounting dissected ovules in a solution containing 2.5 g chloral hydrate dissolved in 1 ml 30% glycerol and viewed with a Nikon E600 microscope.
Fluorescence quantification
Request a detailed protocolIn order to infer the amounts of TIR1/AFB protein inside and outside the nucleus, 40 × magnification images of epidermal cells in the elongation zone of each TIR1/AFB-mCitrine lines were captured. Because the nuclei of AFB1-mCitrine-expressing cells are not apparent, the F1 of a cross with a plant with a UBQ10:H2B-mTurquoise2 transgene was used to delineate the nucleus. Using FIJI (Schindelin et al., 2012), regions of interests including the entire cell (cell, based on propidium iodide staining), the nucleus (nuc, based on mCitrine or mTurquoise2 signal), and a cell-sized region outside the root (bg, background) were drawn using the freehand selections tool, and the area and mean gray values were measured for the mCitrine channel for each. The percent nuclear was calculated using the equation %nuc = [Areanuc × (Meannuc – Meanbg)] ÷ [Areacell × (Meancell – Meanbg)].
Phenotype comparisons
Request a detailed protocolThe viable tir1afb lines were divided based on whether they contained the tir1 mutation, and the two batches were grown sequentially. The afb123 line included in the initial batch displayed a long-hypocotyl phenotype that may have been picked up after an earlier cross to the afb4-2 mutant, so a third batch was made up of alternative isolates for five lines whose pedigrees included a cross to afb4-2. Each batch included Col-0 and tir1-1. Seeds were surfaced sterilized, stratified in water for five days, spotted onto ½ Murashige and Skoog (MS) medium containing 1% sucrose, and incubated in a light chamber (22°C). Twelve five-day-old seedlings for each genotype were transferred to 120 mm square plates containing the same medium containing either 0, 20, or 100 nM IAA (batch a), 0, 100, or 500 nM IAA (batch b), or 0, 20, 100, or 500 nM IAA (batch c). Each plate received six seedlings from six genotypes spread out over two rows. Seedlings for each genotype were present on the top row of one plate and the lower row on a second plate placed in a different part of the growth chamber after marking the position of the root tips with a marker and scanning with Epson V600 flatbed scanners. The plates were scanned again after 72 hr (96 hr for batch c), and the growth was measured using imageJ. The plates containing 100 nM IAA were grown for a fourth day before the numbers of lateral roots protruding through the epidermis were counted using a dissecting microscope. Five seedlings from the no-IAA control plates were transferred to soil in 6 cm pots and grown an additional 34 days. The genotypes for two plants per line were confirmed by PCR. For each 42-day-old plant, the height from the rosette to the tip of the longest inflorescence and the maximum rosette diameter were measured, and the numbers of branches of at least 1 cm were counted. The IAA effects on root elongation data is presented as the percent relative to the growth without IAA ± the relative standard error of the ratio. For the gene effect analyses, the averages from each batch were normalized using measurements for Col-0 and tir1-1 plants that were included with each batch.
Time lapse imaging of root growth
Request a detailed protocolSeeds were sown on ½ MS medium containing 1% sucrose and 0.8% agar and stratified for 2–3 days at 4°C. Approximately fifteen 5-day-old seedlings were transferred to culture chambers (Lab-Tek, Chambers #1.0 Borosilicate Coverglass System, catalog number: 155361) containing the same agar medium supplemented with DMSO or IAA 10 nM (stock solution at 10 µM in DMSO). The transfer of seedlings was completed within 45–60 s. Images were acquired every 25 s for 20 min representing 50 images per root using Keyence microscope model BZ-X810 with 4 × lens.
Images obtained for one field were stacked and cropped to the region of interest (ROI). An auto threshold using the method ‘Default’ was applied. In addition, the ‘erode’, ‘despeckle’ and ‘Remove outliers’ (radius 10, threshold 50) functions were used to smooth the image and remove the remaining background. Each root tip was selected and the ‘Feret Distance’ within the ROI (which corresponds to the longest distance in an object) was determined for each root. Image processing was automated with an ImageJ macro, Supplementary file 8. For each time point the ‘Feret Distance’ root growth was calculated by subtracting the initial ‘Feret Distance’. The values obtained were used to generate graphs. For each genotype, the experiment was repeated three independent times.
To determine the effect of auxin on root growth throughout the experiment, the area under each curve of auxin-treated roots was determined and divided by the corresponding value for roots grown on DMSO condition to calculate the root growth response to IAA. A response value of 1 indicates that IAA had no effect on root growth. The effect of IAA on root growth was determined this way to account for differences in root growth between genotypes on DMSO.
Each sample was subjected to four different normality tests (Jarque-Bera, Lilliefors, Anderson-Darling and Shapiro-Wilk). Samples were considered as a Gaussian distribution when at least one test was significant (p=0.05). As a normal distribution was observed a one-way ANOVA coupled with a post hoc Tukey Honestly Significant Difference test was performed (p=0.05).
Hypocotyl segment elongation assay
Request a detailed protocolMeasurements of etiolated hypocotyl elongation were carried out essentially as described previously (Fendrych et al., 2016; Li et al., 2018). Seeds were sterilized and stratified for four (set 1) or five (set 2) days before plating. After 6 hr of light treatment, the plates were wrapped in aluminum foil and sealed in a cardboard box for 66 hr. The plates were opened in a room lit only with an LED desk lamp with six layers of green cello film (Hygloss Products) filtering the light. Using a dissecting microscope with its light source filtered with six sheets of green cello film, the roots and cotyledons were excised using razor blades and the hypocotyls transferred to plates containing depletion medium (DM: 10 mM KCl, 1 mM MES pH 6, 1.5% phytagel) overlain with a piece of cellophane (PaperMart.com). After 30 to 80 min on DM, the hypocotyl segments were transferred to treatment plates (DM plus either 5 µM NAA or the equivalent amount of solvent (0.025% ethanol). Eight to sixteen hypocotyls were transferred for each genotype and treatment except for there being only five control-treated tir1afb23. Using Epson V600 flat-bed scanners, the plates were scanned at 1200 dpi 30–60 s after transfer then every ten minutes for three hours. The segments were measured using a FIJI macro that applied ‘Auto Threshold’ (Default), ‘Despeckle,’ ‘Remove Outliers’ (radius = 2 threshold = 50 which = Bright), then returned the ‘Feret Distance’ for each. For each segment at each time point, the Feret distance was subtracted from the initial Feret distance. The lengths were converted to µm using the conversion 21.16667 µm/pixel. In the second experiment, Col-0 hypocotyls were dissected first and a second batch was dissected after the other genotypes to test whether the length of time on DM affected the assay. Measurements for the two batches were only different at the 20 min time point (p<0.05 in two-tailed t-test).
Gravitropism assay
Request a detailed protocolIn the experiments corresponding to Figure 7, six-day-old seedlings were positioned on four 120 mm square plates such that four seedlings of each genotype were in different positions in the four plates to reduce position effects. The plates were placed in the growth chamber vertically for an hour, scanned with an Epson V600 flat-bed scanners, then returned to the chamber vertically but rotated 90° from the original orientation. Plates were re-scanned every 30 min for 8 hr. For each root tip at each time point, the angle was measured in FIJI by drawing a line drawn from the medial point two-root-widths from the root tip to the root tip. These angles were corrected for scan-to-scan differences in plate orientation by measuring the angle of a horizontal line on the plate in each image. The mean changes in root-tip angle from that at time zero ± S.E.M. for each genotype at each timepoint was plotted. The experiments corresponding to Figure 7—figure supplement 1 were carried out in the same manner except that each plate contained a single genotype, and the seedlings were not repositioned onto different plates prior to rotation and scanning.
Data availability
All data generated or analysed during this study are included in the manuscript and supporting files. Source data files have been provided for Figure 1—figure supplement 2B, Figure 1—figure supplement 3, Figure 1—figure supplement 4, Figure 5—figure supplement 1, Figure 6, Figure 6—figure supplement 2, Figure 7, Figure 7—figure supplement 1.
-
Data CommonsData packages for One Thousand Plant transcriptomes and phylogenomics of green plants.https://doi.org/10.25739/8m7t-4e85
References
-
Something ancient and something neofunctionalized-evolution of land plant hormone signaling pathwaysCurrent Opinion in Plant Biology 47:64–72.https://doi.org/10.1016/j.pbi.2018.09.009
-
A combinatorial TIR1/AFB-Aux/IAA co-receptor system for differential sensing of auxinNature Chemical Biology 8:477–485.https://doi.org/10.1038/nchembio.926
-
Whole-Genome duplication and plant macroevolutionTrends in Plant Science 23:933–945.https://doi.org/10.1016/j.tplants.2018.07.006
-
A simple and rapid method for the preparation of plant genomic DNA for PCR analysisNucleic Acids Research 19:1349.https://doi.org/10.1093/nar/19.6.1349
-
Phytochrome functions in Arabidopsis developmentJournal of Experimental Botany 61:11–24.https://doi.org/10.1093/jxb/erp304
-
Phytozome: a comparative platform for green plant genomicsNucleic Acids Research 40:D1178–D1186.https://doi.org/10.1093/nar/gkr944
-
Reducing the environmental sensitivity of yellow fluorescent protein mechanism and applicationsThe Journal of Biological Chemistry 276:29188–29194.https://doi.org/10.1074/jbc.M102815200
-
The 35S promoter-driven mDII auxin control sensor is uniformly distributed in leaf primordiaJournal of Integrative Plant Biology 61:1114–1120.https://doi.org/10.1111/jipb.12853
-
The auxin-insensitive bodenlos mutation affects primary root formation and apical-basal patterning in the Arabidopsis embryoDevelopment 126:1387–1395.
-
Recombinational cloning with plant gateway vectorsPlant Physiology 145:1144–1154.https://doi.org/10.1104/pp.107.106989
-
ARF2-ARF4 and ARF5 are essential for female and male gametophyte development in ArabidopsisPlant and Cell Physiology 59:179–189.https://doi.org/10.1093/pcp/pcx174
-
The evolutionary demography of duplicate genesJournal of Structural and Functional Genomics 3:35–44.
-
Mesquite: a modular system for evolutionary analysisMesquite: a modular system for evolutionary analysis.
-
T-Coffee: a novel method for fast and accurate multiple sequence alignmentJournal of Molecular Biology 302:205–217.https://doi.org/10.1006/jmbi.2000.4042
-
Tissue and organ initiation in the plant embryo: a first time for everythingAnnual Review of Cell and Developmental Biology 32:47–75.https://doi.org/10.1146/annurev-cellbio-111315-124929
-
Evolution of gene duplication in plantsPlant Physiology 171:00523.2016–.00523.2316.https://doi.org/10.1104/pp.16.00523
-
The Arabidopsis auxin receptor F-Box proteins AFB4 and AFB5 are required for response to the synthetic auxin picloramG3: Genes, Genomes, Genetics 6:1383–1390.https://doi.org/10.1534/g3.115.025585
-
FigTree v1.4.4FigTree v1.4.4, http://tree.bio.ed.ac.uk/software/figtree/.
-
The Arabidopsis JAGGED LATERAL ORGANS (JLO) gene sensitizes plants to auxinJournal of Experimental Botany 68:2741–2755.https://doi.org/10.1093/jxb/erx131
-
Contrasting modes of diversification in the aux/IAA and ARF gene familiesPlant Physiology 135:1738–1752.https://doi.org/10.1104/pp.104.039669
-
Plant embryogenesis requires AUX/LAX-mediated auxin influxDevelopment 142:702–711.https://doi.org/10.1242/dev.115832
-
New insights into root gravitropic signallingJournal of Experimental Botany 66:2155–2165.https://doi.org/10.1093/jxb/eru515
-
Fiji: an open-source platform for biological-image analysisNature Methods 9:676–682.https://doi.org/10.1038/nmeth.2019
-
NIH image to ImageJ: 25 years of image analysisNature Methods 9:671–675.https://doi.org/10.1038/nmeth.2089
-
A noncanonical auxin-sensing mechanism is required for organ morphogenesis in ArabidopsisGenes & Development 30:2286–2296.https://doi.org/10.1101/gad.285361.116
-
Evolution of fast root gravitropism in seed plantsNature Communications 10:3480.https://doi.org/10.1038/s41467-019-11471-8
-
A recombineering-based gene tagging system for ArabidopsisThe Plant Journal 66:712–723.https://doi.org/10.1111/j.1365-313X.2011.04524.x
Article and author information
Author details
Bipin Kumar Pandey

Rahul Arvind Bhosale
Funding
National Institutes of Health (GM43644)
- Mark Estelle
Human Frontier Science Program (LT000340/2019-L)
- Matthieu Platre
Biotechnology and Biological Sciences Research Council (Research fellowship)
- Rahul Arvind Bhosale
The funders had no role in study design, data collection and interpretation, or the decision to submit the work for publication.
Acknowledgements
We thank Yingluo Wang and Diane Le for technical assistance, Brian Crawford for help with embryo microscopy, and the Arabidopsis Biological Resource Center and the US National Plant Germplasm System for seeds. This work was supported by a grant from the NIH (GM43644 to ME) and by start-up funds from the Salk Institute of Biological Studies (WB). MP was supported by a long-term postdoctoral fellowship (LT000340/2019 L) by the Human Frontier Science Program Organization, and NK was supported in part through a UC San Diego Biological Sciences Eureka! Summer Research Scholarship. RB was supported by BBSRC Discovery and Future Food Beacon Nottingham Research Fellowships.
Version history
- Received: December 27, 2019
- Accepted: February 4, 2020
- Accepted Manuscript published: February 18, 2020 (version 1)
- Version of Record published: February 28, 2020 (version 2)
Copyright
© 2020, Prigge et al.
This article is distributed under the terms of the Creative Commons Attribution License, which permits unrestricted use and redistribution provided that the original author and source are credited.
Metrics
-
- 8,261
- Page views
-
- 1,116
- Downloads
-
- 90
- Citations
Article citation count generated by polling the highest count across the following sources: Scopus, Crossref, PubMed Central.
Download links
A two-part list of links to download the article, or parts of the article, in various formats.
Downloads (link to download the article as PDF)
Open citations (links to open the citations from this article in various online reference manager services)
Cite this article (links to download the citations from this article in formats compatible with various reference manager tools)
Genetic analysis of the Arabidopsis TIR1/AFB auxin receptors reveals both overlapping and specialized functions
eLife 9:e54740.
https://doi.org/10.7554/eLife.54740
Further reading
-
- Developmental Biology
- Neuroscience
Human fetal development has been associated with brain health at later stages. It is unknown whether growth in utero, as indexed by birth weight (BW), relates consistently to lifespan brain characteristics and changes, and to what extent these influences are of a genetic or environmental nature. Here we show remarkably stable and lifelong positive associations between BW and cortical surface area and volume across and within developmental, aging and lifespan longitudinal samples (N = 5794, 4–82 y of age, w/386 monozygotic twins, followed for up to 8.3 y w/12,088 brain MRIs). In contrast, no consistent effect of BW on brain changes was observed. Partly environmental effects were indicated by analysis of twin BW discordance. In conclusion, the influence of prenatal growth on cortical topography is stable and reliable through the lifespan. This early-life factor appears to influence the brain by association of brain reserve, rather than brain maintenance. Thus, fetal influences appear omnipresent in the spacetime of the human brain throughout the human lifespan. Optimizing fetal growth may increase brain reserve for life, also in aging.
-
- Developmental Biology
- Immunology and Inflammation
During embryogenesis, the fetal liver becomes the main hematopoietic organ, where stem and progenitor cells as well as immature and mature immune cells form an intricate cellular network. Hematopoietic stem cells (HSCs) reside in a specialized niche, which is essential for their proliferation and differentiation. However, the cellular and molecular determinants contributing to this fetal HSC niche remain largely unknown. Macrophages are the first differentiated hematopoietic cells found in the developing liver, where they are important for fetal erythropoiesis by promoting erythrocyte maturation and phagocytosing expelled nuclei. Yet, whether macrophages play a role in fetal hematopoiesis beyond serving as a niche for maturing erythroblasts remains elusive. Here, we investigate the heterogeneity of macrophage populations in the murine fetal liver to define their specific roles during hematopoiesis. Using a single-cell omics approach combined with spatial proteomics and genetic fate-mapping models, we found that fetal liver macrophages cluster into distinct yolk sac-derived subpopulations and that long-term HSCs are interacting preferentially with one of the macrophage subpopulations. Fetal livers lacking macrophages show a delay in erythropoiesis and have an increased number of granulocytes, which can be attributed to transcriptional reprogramming and altered differentiation potential of long-term HSCs. Together, our data provide a detailed map of fetal liver macrophage subpopulations and implicate macrophages as part of the fetal HSC niche.


